






Quantitative Proteomics: Methods, Strategies, Workflow, and Applications
Quantitative proteomics uses liquid chromatography-tandem mass spectrometry (LC-MS/MS) to identify proteins and compare their abundance across predefined biological samples. It supports group comparison, differential abundance analysis, functional interpretation, and candidate ranking for later follow-up.
The useful result depends on the comparison already defined, the sample material available, and whether the project needs a relative group contrast or a calibrated amount for selected proteins. TMT, DDA-based label-free quantification (LFQ), DIA, and targeted methods then become different routes to that result.
This guide explains how quantitative proteomics studies are planned from strategy selection through workflow and data outputs. It covers what quantitative proteomics can reveal, how major strategies differ at a planning level, what to define before acquisition, how the bottom-up workflow is organized, and what deliverables support later interpretation. Researchers who already have defined samples, comparison groups, or a specific project objective can also review the MtoZ Biolabs Quantitative Proteomics Service for project-specific feasibility and analysis planning.
What Is Quantitative Proteomics?
Quantitative proteomics measures protein abundance across samples or experimental conditions using LC-MS/MS. Compared with identification-only proteomics, it adds a quantitative signal so researchers can determine how the same protein changes between defined groups.
Most LC-MS/MS proteomics uses a bottom-up workflow. Proteins are extracted and enzymatically digested, peptides are separated by liquid chromatography, and precursor and fragment-ion spectra are matched to a reference protein database. Identification asks which proteins have peptide support. Quantification asks whether their measured signals differ among samples or groups. Peptide recovery, ionization, and detectability still shape the protein-level value.
For most discovery studies, the quantitative values are relative. Tandem mass tag reporter-ion ratios, label-free peptide peak areas, and data-independent acquisition fragment-ion quantities support comparison of the same protein across samples within a coherent study. Relative values answer how a protein changes between groups. Amount or concentration for selected proteins uses a separately designed targeted method with suitable standards and calibration.
What Can Quantitative Proteomics Reveal?
Quantitative proteomics can show protein-abundance differences among biological groups, sample-level patterns, and protein sets associated with a treatment, phenotype, time point, or perturbation. These results are used to discover candidates and place them in biological context before focused verification.
Differential Protein Abundance and Biological Comparison
A planned study can compare treated and control samples, genetically perturbed and matched reference samples, disease-model and control tissues, clinical phenotypes, developmental stages, time points, or environmental conditions. The output shows which proteins were identified, how consistently they were measured, and which proteins meet the project-defined statistical and effect-size criteria for a contrast.
Correlation analysis, principal component analysis, and clustering help review replicate coherence, group patterns, outliers, or batch structure. Differential proteins are then prioritized using effect size, replicate consistency, peptide evidence, sample metadata, and the feasibility of independent follow-up. The resulting list is a working candidate set for biological interpretation.
Functional Interpretation of Quantitative Proteomics Data
Functional annotation helps translate differential protein lists into biologically meaningful patterns. Gene Ontology analysis summarizes molecular functions, biological processes, and cellular components, while KEGG pathway enrichment identifies pathways associated with the selected protein set. Protein-protein interaction analysis can further reveal functional relationships and network-level connections among candidate proteins.
Together, these analyses help researchers prioritize proteins, identify enriched biological processes and pathways, generate mechanistic hypotheses, and select candidates for further validation. Interpretation is most informative when the comparison is clearly defined and appropriate species-specific annotation resources are available.
|
Research goal |
Is quantitative proteomics suitable? |
What it can answer |
|---|---|---|
|
Compare protein abundance between defined groups |
Yes |
Which proteins differ in relative abundance between groups |
|
Rank candidates associated with treatment or phenotype |
Yes |
Which proteins show consistent condition-associated changes |
|
Place changing proteins in pathway or process context |
Yes, for hypothesis generation |
Whether changing proteins concentrate in related annotated functions |
|
Measure concentration of selected proteins |
Only with a calibrated targeted design |
Absolute amount for a predefined panel |
|
Prove that a protein change causes a phenotype |
Not alone |
Functional experiments are required |
|
Establish a diagnostic or prognostic biomarker |
Not alone |
Independent validation and performance assessment are required |
Quantitative Proteomics Strategies
Quantitative proteomics strategies can be grouped by measurement endpoint, labeling status, acquisition mode, and whether the project is broad discovery or targeted analysis. This hierarchy keeps TMT, label-free quantification, and DIA in their proper roles rather than treating them as interchangeable names for one method.
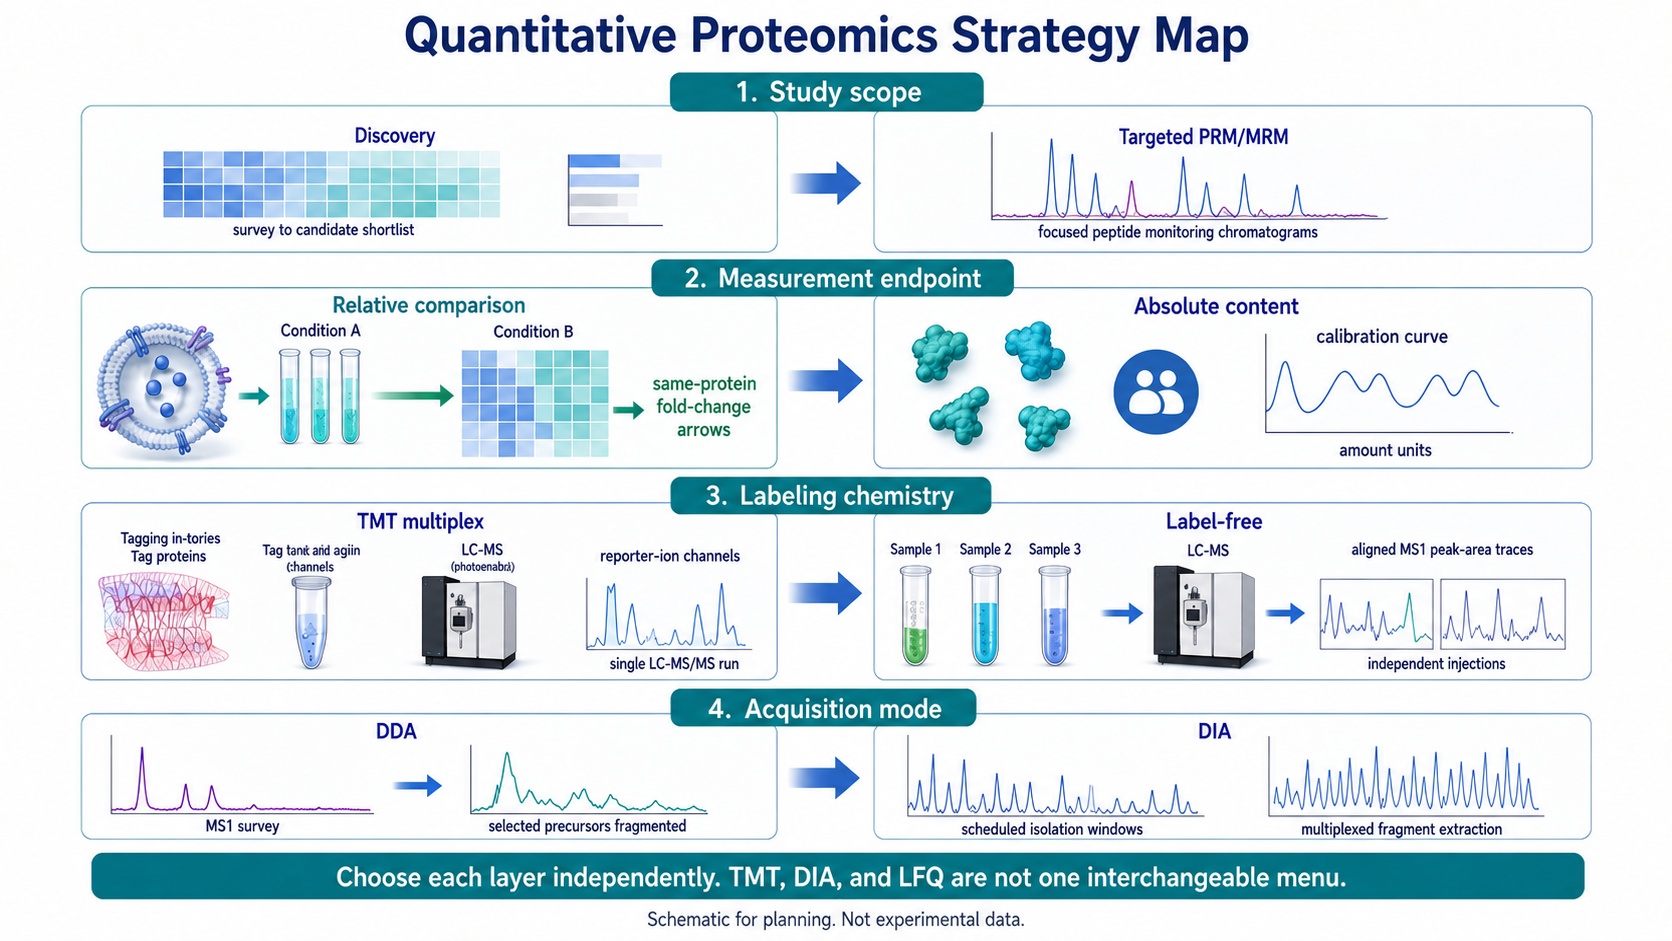
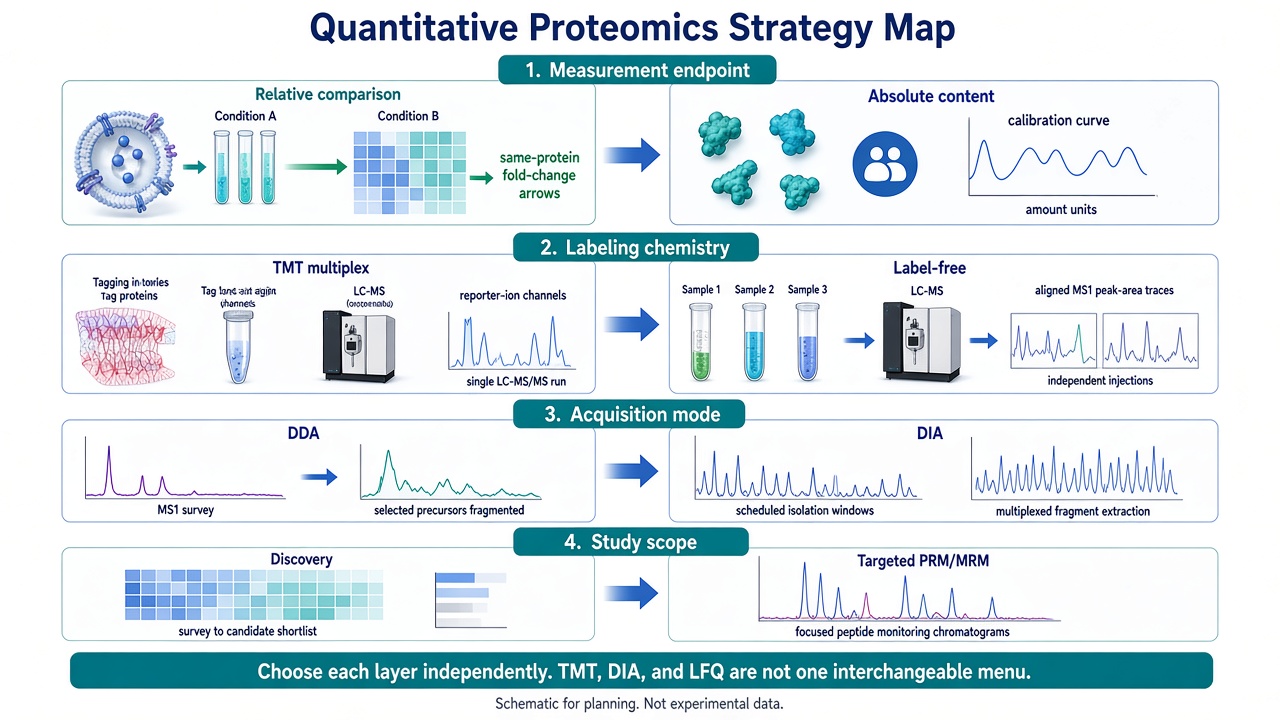
Figure 1. Quantitative proteomics strategy map: measurement endpoint, labeling chemistry, acquisition mode, and study scope are planned as separate layers.
Discovery vs. Targeted Quantitative Proteomics
Discovery proteomics surveys many proteins to generate candidates from a defined comparison. Targeted proteomics measures predefined proteins or peptides with a focused assay. Parallel reaction monitoring (PRM) records full fragment-ion spectra for selected precursors (Peterson et al. 2012). Multiple reaction monitoring (MRM) and selected reaction monitoring (SRM) monitor predefined precursor-to-fragment transitions (Lange et al. 2008).
PRM becomes relevant after the question narrows and suitable target peptides can be selected. Absolute PRM also uses prior detection evidence, analytically suitable peptides, standards, and calibration. Discovery quantification and targeted follow-up are sequential designs: the first ranks candidates, and the second measures a named panel with a method built for those peptides. For researchers planning targeted quantitative workflows, refer to Targeted Quantitative Proteomics: Principles, Strategies, and Applications.
Relative vs. Absolute Quantification
Relative quantification compares the same protein across samples and supports discovery of group-associated changes. The reported value is a ratio, normalized intensity, or related within-study quantity that is interpreted against the planned contrast.
Absolute quantification estimates the amount or concentration of predefined proteins or peptides using a calibrated quantitative design. Such workflows commonly use suitable surrogate peptides, stable-isotope-labeled standards, and calibration curves. The AQUA strategy described by Gerber et al. (2003) established the use of isotope-labeled peptide standards for absolute protein quantification, while modern targeted workflows can apply acquisition methods such as SRM/MRM or PRM. Relative quantification and calibrated absolute measurement address different quantitative objectives.
Label-Based Quantitative Proteomics
Label-based quantitative proteomics introduces stable isotope or isobaric labels to enable relative protein quantification across different samples. Depending on the labeling strategy, label-based approaches can include metabolic labeling methods such as SILAC and chemical labeling methods such as TMT and iTRAQ. These strategies introduce defined mass differences or reporter signals that allow peptide abundance comparisons after LC-MS/MS analysis. Among these approaches, tandem mass tag (TMT) proteomics is widely used for multiplexed quantitative proteomics studies. TMT reagents label peptides from different samples with isobaric tags of matching overall mass. After labeling, samples are pooled for LC-MS/MS analysis, where fragmentation releases channel-specific reporter ions. The reporter ion intensities are used to calculate relative protein abundance ratios (Thompson et al. 2003).
TMT enables multiplexed comparisons by combining multiple labeled samples within a coordinated experimental design. Quantitative performance depends on factors such as channel balance, labeling completeness, co-isolation interference, and batch design. In MtoZ projects, comparisons are typically planned within one TMT plex of 10 samples or fewer to support balanced experimental design. Primary-amine-containing buffers require review because TMT labeling targets peptide amino groups. For a detailed explanation of TMT labeling principles, multiplexed experimental design, relative quantification workflow, and data characteristics, refer to TMT Proteomics: Tandem Mass Tag-Based Relative Quantification.
Label-Free Quantitative Proteomics
Label-free quantitative proteomics (LFQ) compares protein abundance across samples without introducing isotope-coded or isobaric labels. Samples are analyzed as separate LC-MS/MS injections, and quantitative information is derived directly from peptide signals. LFQ can be implemented with different acquisition modes. In DDA-based LFQ, protein abundance is commonly estimated from precursor-ion intensities after chromatographic alignment and normalization. In DIA-based LFQ, quantitative information is extracted from systematically acquired fragment-ion data across defined precursor windows. Both approaches support relative protein quantification, but they differ in acquisition strategy, data completeness, interference characteristics, and data-processing workflow.
Label-free approaches are well suited to studies requiring flexible sample numbers, independently analyzed samples, or cohort designs that do not fit within a fixed multiplex. Because samples are acquired separately, chromatographic reproducibility, run order, quality control, normalization, and batch planning are important considerations. For more details on LFQ principles, peptide signal-based quantification, experimental considerations, and suitable application scenarios, refer to Label-Free Quantitative Proteomics: LFQ-Based Protein Quantification.
DDA and DIA Acquisition Strategies
Acquisition mode describes how the mass spectrometer selects precursors for fragmentation. It is a separate layer from labeling. Data-dependent acquisition (DDA) surveys precursor ions and fragments eligible signals, typically the more intense ones in each cycle. In a DDA-LFQ workflow, precursor peak areas are then aligned and compared across runs.
Data-independent acquisition (DIA) cycles through precursor windows and records multiplexed fragment-ion data that are extracted computationally (Gillet et al. 2012). Acquisition mode and labeling status are separate planning axes: DIA defines how precursors are scheduled for fragmentation, not whether peptides carry isotope or isobaric tags. In MtoZ relative-discovery offerings, DIA is typically paired with unlabeled digests for label-free quantification, while TMT workflows are typically acquired in DDA so that reporter ions are measured from fragmentation of labeled precursors. Windowing, interference, chromatography, and the protein database still shape DIA results.
For a detailed discussion of DIA principles, differences between DIA and DDA, quantitative characteristics, and data-processing considerations, refer to DIA Proteomics: Data-Independent Acquisition for Quantitative Analysis.
When sample number, multiplexing requirements, acquisition strategy, or targeted follow-up make the choice less straightforward, researchers can refer to How to Choose a Quantitative Proteomics Strategy for a more detailed strategy-selection framework.
Planning a Quantitative Proteomics Study
A quantitative proteomics study is planned around the biological contrast, measurement endpoint, sample matrix, available material, group structure, reference database, batch plan, and expected deliverables. Method selection follows these inputs.
Selecting a Quantitative Strategy Based on Research Goals
Define what the result must mean before a method family is locked. Group-wide discovery generally uses relative quantification. Amounts for known proteins use a targeted, calibrated method. For relative discovery, TMT versus unlabeled independent-injection designs is assessed first; within unlabeled routes offered by MtoZ, DDA versus DIA is then compared.
TMT is a strong match when a complete comparison can be labeled together and the chemistry supports amine labeling. Label-free DDA-LFQ or DIA is a strong match when samples are better kept as independent injections or the cohort structure is more open. Targeted PRM is selected when a named protein or peptide panel is already defined. When the matching decision itself needs a fuller framework, use the How to Choose a Quantitative Proteomics Strategy.
Sample Requirements
Common matrices include tissues, cultured cells, microbial pellets, biofluids, culture supernatants, FFPE material, and protein solutions. Suitability depends on recoverable protein and chemistry. Detergents, salts, nucleic acids, degradation, freeze-thaw history, and buffer composition are reviewed together with protein amount and concentration.
A searchable reference protein database is part of standard full-spectrum analysis because peptide identification depends on a suitable sequence search space. Species, strain, and database completeness are planning variables.
The amounts below are typical planning guides used during feasibility review, not acceptance or rejection gates.
|
Route |
Typical planning amount |
Additional planning notes |
Typical output |
|---|---|---|---|
|
TMT |
More than 50 ug protein per channel; 100 ug is commonly used |
Concentration typically above 1 ug/uL; detergent typically below 0.1%; complete comparison often planned in one plex of 10 samples or fewer; review primary-amine buffers |
Relative reporter-ion comparison |
|
DDA-LFQ |
More than 20 ug total protein; 50 ug is commonly used |
Concentration typically above 0.5 ug/uL; independent injections in a controlled cohort |
Relative precursor peak-area comparison |
|
DIA-LFQ |
More than 20 ug total protein; 50 ug is commonly used |
Concentration typically above 0.5 ug/uL; independent injections that benefit from consistent coverage |
Relative fragment-ion comparison |
|
Targeted PRM |
More than 40 μg total protein in solution state |
Concentration above 0.5 μg/μL; predefined targets; prior detection evidence preferred; proteotypic peptides; heavy standards and calibration for absolute quantification |
Targeted relative comparison or calibrated amount |
Plan Experimental Groups and Replicates
Experimental groups, biological contrasts, and replicate structure should be defined before LC-MS/MS analysis. Each biological replicate should represent an independent experimental unit, such as an independent culture, animal, patient sample, or biological harvest. Technical replicates can be used to evaluate analytical reproducibility but do not replace biological replication when comparing biological conditions.
Experimental design should also consider factors that may influence quantitative results, including sample preparation batches, acquisition order, and potential technical variation. Replicate number depends on biological variability, expected effect size, group structure, sample availability, and the intended downstream analysis. A clearly defined comparison design, sample-to-group mapping, and batch plan help ensure that quantitative proteomics data can be interpreted reliably.
Quantitative Proteomics Workflow
The quantitative proteomics workflow moves from sample assessment and protein extraction through peptide preparation, LC-MS/MS acquisition, database-based identification, quantitative processing, statistics, and biological annotation. Each stage shapes the evidence available at the next stage.
- Assess the sample and extract protein.
- Digest proteins into peptides.
- Prepare labeling or independent acquisition.
- Acquire LC-MS/MS data.
- Identify and quantify proteins.
- Compare groups and interpret results.
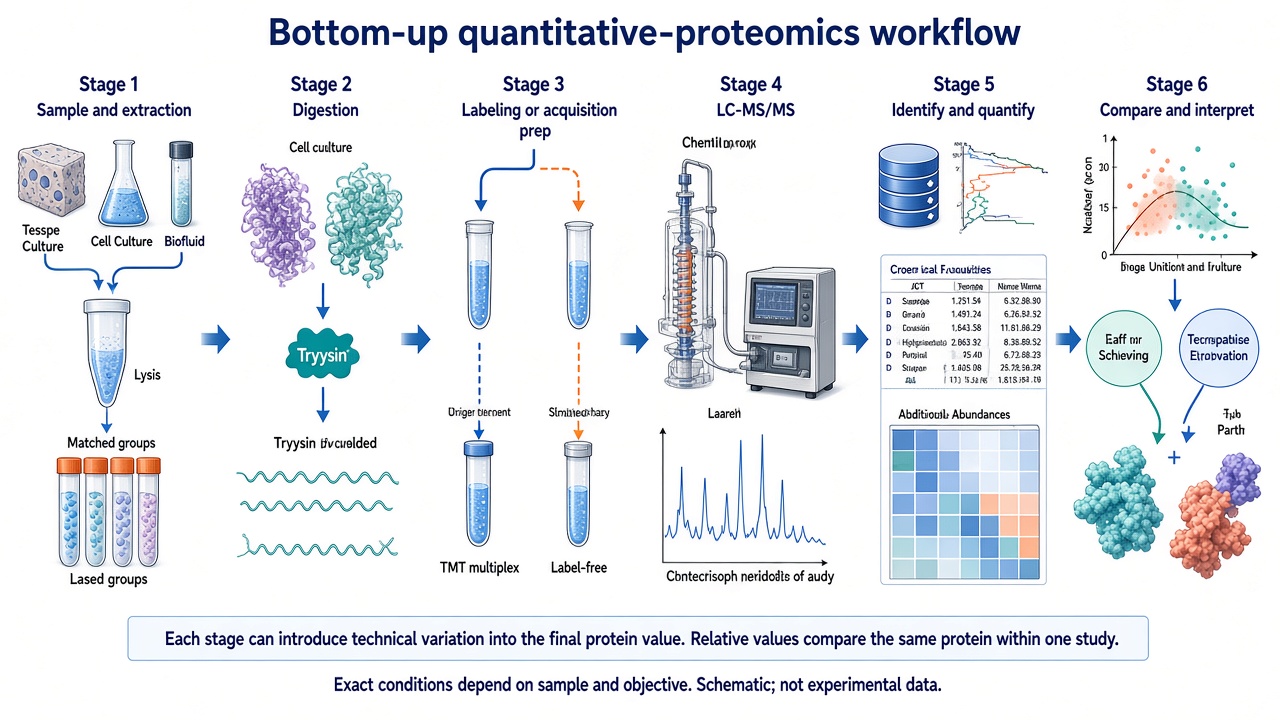
Figure 2. Bottom-up quantitative proteomics workflow from sample extraction and digestion through LC-MS/MS to identification, quantification, and group comparison.
Sample Preparation and Protein Extraction
Samples are assessed for identity, amount, condition, and any handling notes that affect protein recovery. Extraction aims to recover protein reproducibly across the comparison set while controlling salts, detergents, lipids, nucleic acids, and other interfering substances. Matched lysis and cleanup across groups keep later abundance differences easier to attribute to the biological contrast.
Protein Digestion and Peptide Preparation
Proteins are reduced, alkylated when the protocol requires it, enzymatically digested, and cleaned to produce LC-MS/MS-compatible peptides. Consistent digestion and peptide recovery matter because protein quantities are inferred from the resulting peptide signals.
Labeling or Acquisition Preparation
In a TMT route, digests are assigned to channels, labeled, checked, pooled, and prepared for acquisition. Channel layout follows the group and replicate plan so that a contrast is not confounded with a single channel position.
In a label-free route, samples remain separate injections. Run order, quality-control injections, and batch structure are planned at this stage so chromatographic drift and injection sequence can be reviewed with the biological design.
LC-MS/MS Analysis
Liquid chromatography separates peptides, and tandem mass spectrometry records precursor and fragment-ion evidence. DDA selects eligible precursors for fragmentation. DIA repeatedly covers precursor windows. Acquisition is kept stable and matched to the study structure, including the labeling or label-free decision made earlier.
Protein Quantification and Data Processing
Spectra are interpreted against the approved protein database. Identifications are filtered, and quantitative signals are extracted, aligned or corrected when needed, normalized, and summarized to protein or protein-group values. Shared peptides can produce protein groups rather than unique gene products.
Missing values may reflect low signal, sampling, interference, filtering, or alignment. Any imputation is recorded as an analysis choice. The quantitative table is then ready for the planned group comparison.
Statistical and Bioinformatics Analysis
Sample quality is reviewed before differential testing using identification summaries, intensity distributions, replicate correlations, multivariate views, and batch variables. Planned contrasts are then evaluated with effect size and statistical evidence.
Enrichment and network analysis organize the candidate list into annotated functions, pathways, and interaction neighborhoods. These outputs support biological follow-up. They describe the selected protein set under the annotation resources used for that species.
What Data Can You Obtain from Quantitative Proteomics?
Quantitative proteomics can provide protein and peptide identifications, relative abundance values, quality summaries, differential-protein results, and annotation-based functional outputs. The exact deliverables depend on the strategy, design, sample quality, database, and approved analysis scope.
Protein Identification and Quantification
The core table links protein or protein-group identifiers to peptide evidence and quantitative values across samples or channels. Supporting files and reports may summarize identification quality, missingness, normalization, and sample mapping. Interpretation uses the comparison direction, the processing rules, and the protein-inference method, not a single intensity in isolation.
Differential Protein Analysis
Differential analysis produces effect-size and statistical fields for predefined contrasts. Volcano plots help review magnitude and significance together. Heatmaps and clustering views help inspect group patterns among selected proteins. The resulting list is a candidate shortlist for biological interpretation and, where needed, targeted verification.
Functional Enrichment and Pathway Analysis
GO, KEGG, and protein-protein interaction outputs place candidates in annotation and network context. Their interpretation depends on list construction, background set, database version, species coverage, and identifier conversion. These results help rank processes and pathways for the next experiment. Researchers who need a more detailed framework for judging differential protein changes can refer to How to Analyze and Interpret Quantitative Proteomics Data and Results, including how quantitative change, statistical support, replicate consistency, and follow-up readiness contribute to interpretation.
Applications of Quantitative Proteomics
Quantitative proteomics supports research wherever a defined comparison may produce informative protein-abundance patterns. Its usual role is to discover, rank, and contextualize candidates before focused verification or functional testing.
Disease and Mechanism Research
Disease-model tissues, cells, or biofluids can be compared with matched controls to identify phenotype-associated proteins. Time, tissue composition, and treatment history are part of the design so that the contrast maps to the intended biological question. The resulting protein set suggests processes, compartments, and pathways to test in dedicated follow-up experiments.
Biomarker Discovery and Validation
Discovery proteomics can generate candidate biomarkers from defined cohorts by ranking proteins that differ between phenotypes or treatment-response groups. Those discovery lists are candidate sets. Independent analytical verification is the next research stage after the discovery list is produced.
Drug Response and Mechanism-of-Action Studies
Treatment comparisons can identify proteins associated with response, resistance, dose, or exposure time. Vehicle controls, cell state, and sampling windows belong in the design because they shape which protein changes can be attributed to the compound. Quantitative changes generate hypotheses that can be tested with target-engagement or functional assays.
Functional Genomics and Molecular Mechanism Research
Genetic perturbation studies can identify downstream protein changes after knockout, knockdown, overexpression, or related interventions. Protein and transcript levels need not match, because translation, degradation, localization, and post-translational regulation also operate. Proteomics adds protein-level evidence to the molecular picture.
Stress and Environmental Response Research
Stress studies can identify response-associated protein patterns in plants, microbes, cells, or animal models. Sampling time, tissue composition, growth stage, and exposure dose are controlled so the protein changes can be linked to the intended contrast. Enriched annotations then guide physiological or genetic follow-up.
Frequently Asked Questions
1. Is quantitative proteomics suitable if the groups are already defined but the method is not?
Yes. Provide the biological contrast, sample type, sample count, replicates, available protein, buffer chemistry, species, and expected output so that a labeled, label-free, or targeted route can be assessed. The method family is selected from those study inputs.
2. Does quantitative proteomics report protein concentration?
Discovery workflows usually report relative abundance for the same protein across samples within one study. Concentration or absolute amount uses a targeted method with suitable standards and calibration. Relative discovery and calibrated targeted measurement can be planned as consecutive stages when both a broad comparison and later amount estimates are needed.
3. Can a new species be analyzed without a reference protein database?
Quantitative proteomics typically requires a suitable protein sequence database for peptide identification. If a complete reference proteome is unavailable, a closely related species database or a customer-provided protein sequence database may be considered depending on the research objective. The availability and quality of the reference database can affect protein identification depth and confidence. For newly sequenced or poorly annotated species, database preparation and feasibility evaluation should be considered before analysis.
4. When should discovery candidates move to targeted PRM?
Consider PRM when a shortlist has been defined and the next question requires focused measurement in the same or an independent sample set. Absolute PRM also uses suitable target peptides, standards, calibration, and evidence that the targets can be measured reliably.
Conclusion
Once the biological question has been translated into a defined comparison, sample plan, analytical strategy, and expected protein-level output, the project can be evaluated as an integrated quantitative proteomics study. Researchers can review the MtoZ Biolabs Quantitative Proteomics Service for project-specific sample evaluation, feasibility assessment, and workflow planning.
References
1. Gerber SA, Rush J, Stemman O, Kirschner MW, Gygi SP. Absolute quantification of proteins and phosphoproteins from cell lysates by tandem MS. Proceedings of the National Academy of Sciences of the United States of America. 2003;100(12):6940–6945. doi:10.1073/pnas.0832254100.
2. Gillet LC, Navarro P, Tate S, Röst H, Selevsek N, Reiter L, Bonner R, Aebersold R. Targeted data extraction of the MS/MS spectra generated by data-independent acquisition: A new concept for consistent and accurate proteome analysis. Molecular & Cellular Proteomics. 2012;11(6):O111.016717. doi:10.1074/mcp.O111.016717.
3. Lange V, Picotti P, Domon B, Aebersold R. Selected reaction monitoring for quantitative proteomics: A tutorial. Molecular Systems Biology. 2008;4:222. doi:10.1038/msb.2008.61.
4. Peterson AC, Russell JD, Bailey DJ, Westphall MS, Coon JJ. Parallel reaction monitoring for high resolution and high mass accuracy quantitative, targeted proteomics. Molecular & Cellular Proteomics. 2012;11(11):1475–1488. doi:10.1074/mcp.O112.020131.
5. Thompson A, Schäfer J, Kuhn K, Kienle S, Schwarz J, Schmidt G, Neumann T, Johnstone R, Mohammed AKA, Hamon C. Tandem mass tags: A novel quantification strategy for comparative analysis of complex protein mixtures by MS/MS. Analytical Chemistry. 2003;75(8):1895–1904. doi:10.1021/ac0262560.
How to order?




