






How to Analyze and Interpret Quantitative Proteomics Data and Results
Quantitative proteomics generates large-scale protein abundance datasets that enable researchers to compare protein changes across different biological conditions. However, obtaining quantitative values is only the first step. Proper data analysis and interpretation are required to determine which proteins change, whether these changes are statistically reliable, and how they relate to biological processes.
Quantitative proteomics data analysis typically includes quality assessment, normalization, statistical comparison, differential protein identification, and functional interpretation. The appropriate analytical strategy depends on the quantitative method, experimental design, sample structure, and biological questions.
This article explains how quantitative proteomics results are analyzed and interpreted, from understanding output data to identifying meaningful biological insights. Researchers who already have a completed contrast and need project-level review can also consult the MtoZ Biolabs Quantitative Proteomics Service for feasibility and analysis-scope discussion.
Understanding Quantitative Proteomics Output Data
After LC-MS/MS analysis and quantitative processing, quantitative proteomics projects typically generate multiple types of output files. These results provide information about protein identification, abundance changes, statistical comparisons, and biological interpretation.
What Information Is Included in Quantitative Proteomics Results?
Quantitative proteomics results usually include:
- Protein identification information;
- Quantitative abundance values;
- Differential protein analysis results;
- Statistical evaluation;
- Functional annotation results.
The exact output depends on the quantitative strategy used. For example, LFQ, TMT, and DIA workflows generate quantitative datasets based on different measurement principles but ultimately provide protein-level abundance information for biological comparison.
Protein Abundance Tables and Quantitative Values
The core output of quantitative proteomics is usually a protein abundance matrix, where each row represents a protein and each column represents a sample or experimental condition. Quantitative values describe the relative abundance of proteins within the study design. Depending on the quantitative method, these values may be reported as normalized intensities, ratios, or other processed measurements.
Researchers typically use these values to answer questions such as:
- Which proteins increase or decrease between experimental groups?
- Which proteins show consistent changes across biological replicates?
- Which proteins may be associated with a specific treatment, phenotype, or biological condition?
Protein abundance values should be interpreted together with experimental design and statistical analysis. A quantitative difference alone does not necessarily indicate biological importance unless it is supported by appropriate statistical evidence and biological context.
How Peptide Measurements Support Protein Quantification?
Protein quantification is typically derived from peptide-level measurements. During LC-MS/MS analysis, peptides are identified based on their mass spectra, and quantitative signals from corresponding peptides are summarized to estimate protein abundance.
Reliable interpretation requires considering:
- The number and quality of supporting peptides;
- Consistency among peptide measurements;
- Agreement between biological replicates.
Protein-level results represent summarized quantitative evidence rather than a direct measurement of every individual protein molecule.
Quality Assessment Before Interpreting Quantitative Proteomics Results
Before interpreting biological differences, researchers should evaluate whether the quantitative dataset is reliable and suitable for comparison.
Evaluating Data Quality and Experimental Consistency
Quantitative proteomics results can be influenced by biological variation, sample preparation, LC-MS/MS performance, and data processing.
Common quality considerations include:
- Identification consistency across samples;
- Quantitative data completeness;
- Technical variation between runs;
- Reproducibility among biological replicates.
High-quality datasets generally show consistent quantitative patterns among replicate samples and sufficient data quality for statistical comparison.
The Role of Normalization and Missing Value Assessment
Normalization helps reduce systematic variation caused by technical differences between samples or LC-MS/MS runs. Missing values are common in quantitative proteomics datasets, especially for low-abundance proteins or complex samples. A missing signal does not necessarily indicate biological absence, as it may result from detection limitations, sample variation, or analytical factors. Therefore, missing values should be evaluated together with experimental design and quantitative evidence rather than interpreted independently.
Assessing Biological Replicates and Sample Comparability
Biological replicates are essential for distinguishing biological variation from technical variation.
Common assessments include:
- Correlation between replicate samples;
- Similarity of quantitative distributions;
- Clustering patterns among samples.
These evaluations help determine whether observed protein changes represent consistent biological differences.
How to Identify and Interpret Differentially Quantified Proteins
Differential protein analysis is used to identify proteins with different abundance patterns between predefined experimental groups. The analysis helps researchers prioritize candidate proteins by combining abundance changes with statistical evaluation and biological context.
Identifying Proteins With Significant Abundance Changes
Differentially quantified proteins are typically identified by comparing protein abundance between experimental groups.
Common visualization outputs include:
- Volcano plots, showing the relationship between abundance changes and statistical significance;
- Heatmaps, showing quantitative patterns across samples;
- Cluster analysis, showing similarity among experimental groups.
These results help researchers identify proteins associated with specific treatments, phenotypes, or biological conditions.
Interpreting Fold Change and Statistical Significance
Two commonly considered factors are:
- Fold change: indicates the magnitude and direction of protein abundance changes between groups.
- Statistical significance: evaluates whether the observed differences are likely to represent meaningful changes rather than random variation. Common indicators include: p-value, adjusted p-value or false discovery rate (FDR).
Proteins showing both substantial abundance changes and statistical support are often prioritized for further biological interpretation.
Understanding Upregulated and Downregulated Proteins
Differentially quantified proteins are commonly classified as:
- Upregulated proteins: proteins with increased abundance in one condition compared with another.
- Downregulated proteins: proteins with decreased abundance in one condition compared with another.
These protein candidates can be further explored through pathway enrichment, protein interaction analysis, or targeted validation. However, abundance changes alone do not directly demonstrate biological function and should be interpreted together with additional biological evidence.
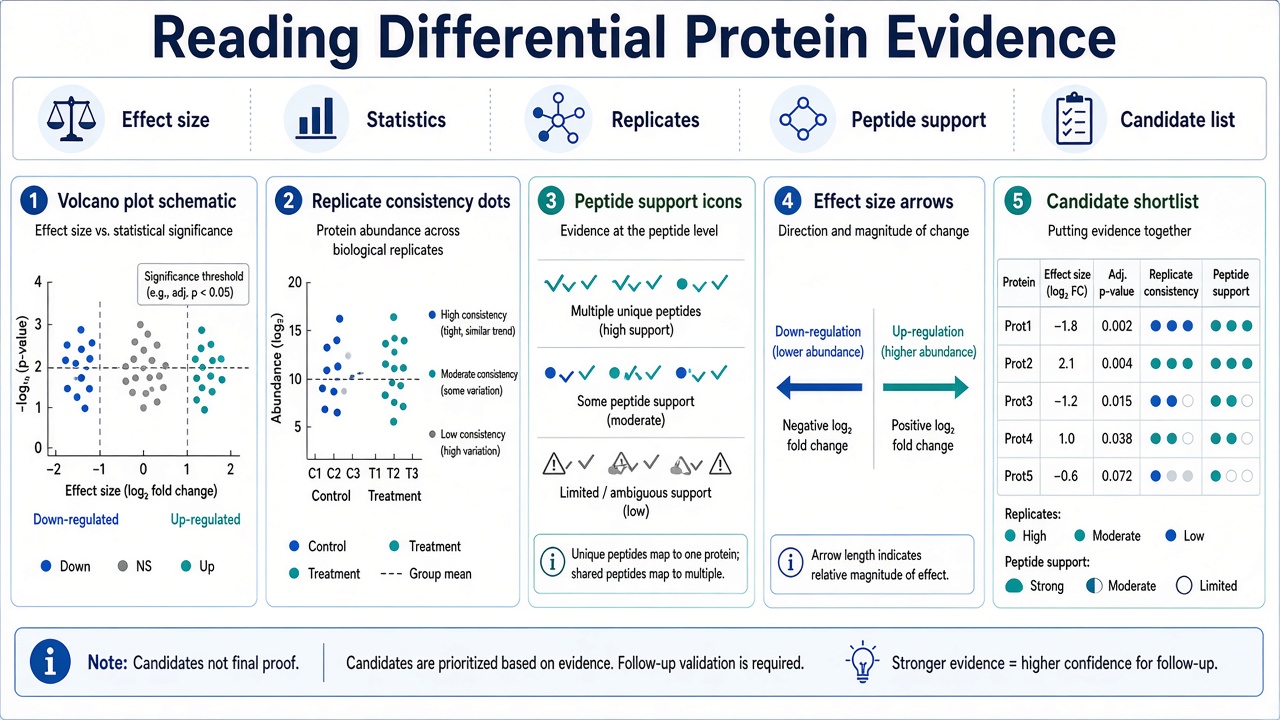
Figure 1. Differential interpretation combines effect size, statistics, replicate behavior, and peptide support into a candidate shortlist.
How to Interpret Biological Meaning From Quantitative Proteomics Results
Identifying differential proteins is only the first step in quantitative proteomics interpretation. To understand the potential biological meaning of these changes, researchers typically use functional annotation and pathway-based analyses to connect individual proteins with broader biological processes.
Functional Annotation and Pathway Enrichment Analysis
Common analyses include:
- Gene Ontology (GO) analysis, which classifies proteins according to Biological Process (BP), Molecular Function (MF), and Cellular Component (CC);
- KEGG pathway enrichment analysis, which maps proteins to known biological pathways and molecular processes.
These analyses help identify enriched functional categories and pathways associated with protein abundance changes, providing biological context for further investigation.
Protein Interaction and Network Analysis
Protein interaction and network analysis can provide additional context by showing relationships among changed proteins.
Network-based interpretation may help identify:
- Protein clusters with coordinated changes;
- Potential regulatory relationships;
- Biological processes involving multiple proteins.
However, these analyses provide supportive evidence rather than direct proof of biological mechanisms. Final interpretation should consider experimental design, existing biological knowledge, and additional validation data.
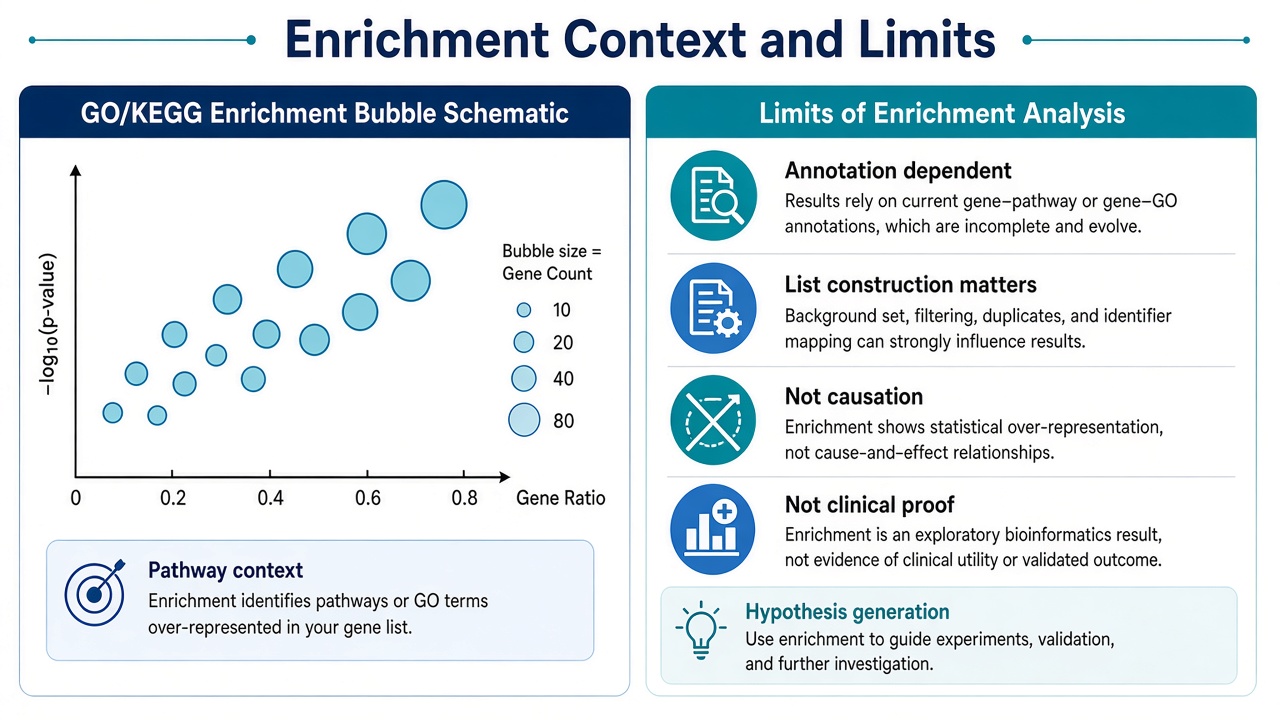
Figure 2. Enrichment and pathway views support hypothesis generation; they are not stand-alone causal or clinical proof.
From Quantitative Proteomics Results to Biological Validation
Quantitative proteomics often serves as a discovery or screening approach that identifies candidate proteins for further investigation.
Validating Quantitative Findings With Targeted Proteomics
For selected proteins requiring further confirmation, targeted proteomics approaches such as PRM or MRM can provide focused quantitative measurement.
Targeted workflows are particularly useful when:
- Target proteins are already defined;
- Specific peptides need precise measurement;
- Larger sample cohorts require targeted verification.
More details on targeted validation strategies are available in Targeted Quantitative Proteomics: Principles, Strategies, and Applications.
Integrating Quantitative Results With Other Omics Data
Quantitative proteomics results can also be combined with other molecular datasets, such as transcriptomics or metabolomics, to provide broader biological interpretation. Multi-omics integration can help compare changes across different biological layers and generate more comprehensive research hypotheses. MtoZ Biolabs provides multi-omics analysis solutions for integrated biological studies. Contact us for a free consultation on your project design and feasibility.
For a broader understanding of quantitative proteomics methods and strategy selection, explore Quantitative Proteomics: Methods, Strategies, Workflow, and Applications and How to Choose a Quantitative Proteomics Strategy.
Frequently Asked Questions
1. Does a significant p-value mean the protein is biologically validated?
No. Statistical fields support ranking under the planned contrast. Biological validation needs independent follow-up matched to the claim.
2. Why can protein and transcript changes disagree?
Translation, degradation, localization, and post-translational regulation also operate. Proteomics adds protein-level evidence; it need not mirror transcript fold changes.
3. How should missing values be read?
A missing value is not proof that a protein is absent or downregulated. It may reflect low signal, sampling, interference, filtering, or alignment.
4. What makes an enrichment result more credible?
A clearly defined input list, an appropriate background, adequate species annotation, and transparent database versions. Even then, enrichment remains hypothesis-generating.
5. When should results move to PRM or absolute assays?
When a shortlist is named and the next question requires focused or calibrated measurement rather than broader discovery ranking.
Conclusion
Quantitative proteomics interpretation starts from the planned contrast, then reads abundance tables, differential evidence, and enrichment context with their limits intact. Candidate lists guide the next experiment; they do not close the biological claim by themselves. Once the result scope and follow-up question are clear, researchers can review the MtoZ Biolabs Quantitative Proteomics Service for project-specific sample evaluation, feasibility assessment, and analysis planning.
How to order?




