






How to Interpret Lysosomal Proteomics Results
Introduction
After a lysosome-enriched LC-MS/MS project finishes, many teams face the same practical question: what do the files actually support, and what do they not prove? Identification tables can look dense. Quantitative matrices can contain thousands of rows. Differential lists and pathway charts can suggest biology that is stronger than the enrichment design can justify.
How to interpret lysosomal proteomics results is therefore a reading skill as much as a bioinformatics skill. This article walks through the usual deliverable set for lysosomal proteome analysis, explains how to use each file type, and flags common overinterpretation risks before follow-up experiments are planned.
What a Standard Result Package Usually Contains
A typical project package includes:
- protein identification tables
- quantitative matrices when the study was designed for quantification
- differential analysis outputs for comparative arms
- bioinformatics views such as GO, KEGG, and PPI
- raw or processed data files plus an analysis report
Result interpretation support can help map these outputs to the original claim. Orthogonal candidate validation, such as Western blot or targeted MS follow-up, is not an automatic next package and should be scoped separately when needed.
Treat every table as an enrichment-associated readout. Proteins appear because they were recovered and detected in the lysosome-enriched preparation under the chosen method, not because exclusive lysosomal localization was proven for each entry.
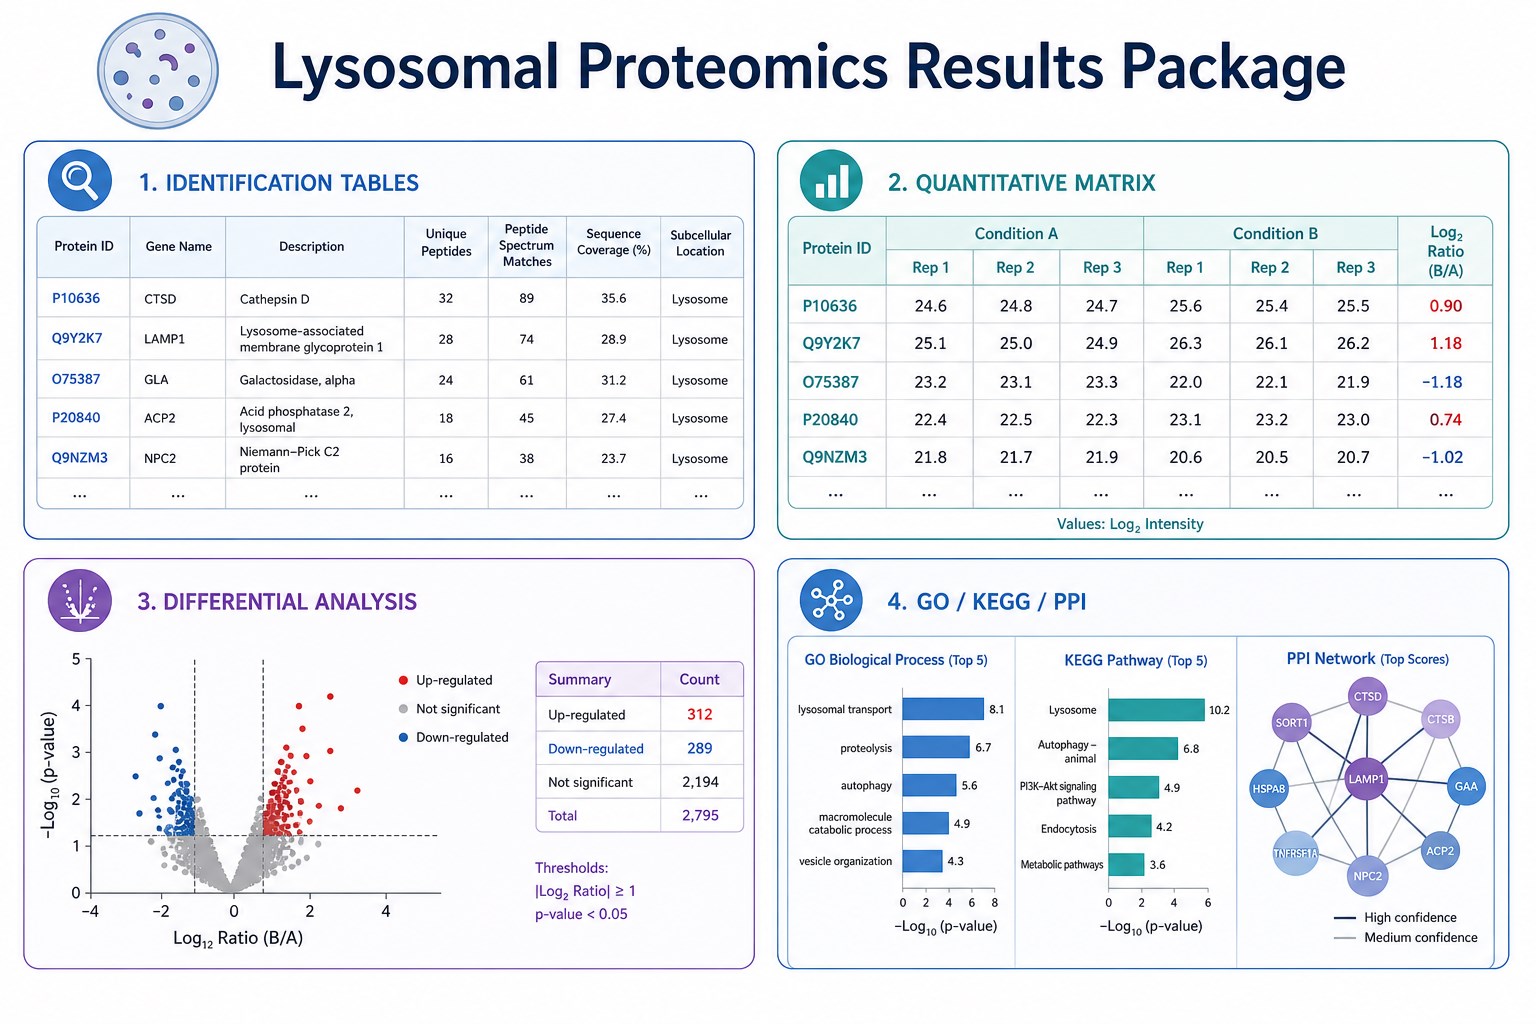
Figure 1. A standard package usually combines identification tables, quantitative matrices, differential lists, and GO, KEGG, and PPI views.
How to Read Protein Identification Tables
Identification tables answer which proteins were detected in the lysosome-enriched samples. Useful columns commonly include protein accessions, gene or protein names, peptide counts, and confidence metrics defined by the processing pipeline.
Use identification depth as context, not as a purity score. Cell-derived preparations and tissue preparations can report different protein and peptide ranges because input complexity and enrichment yield differ. A longer list does not by itself mean cleaner lysosomes.
Cross-check expected markers such as LAMP1 or LAMP2 when enrichment QC was part of the study. Marker presence supports readiness for omics discussion. Marker absence or weak support should slow strong organelle claims.
Do not convert an identification hit into a membrane-versus-luminal assignment. Standard enrichment-based analysis does not separate those classes as independent analytical outputs.
How to Read Quantitative Matrices
Quantitative matrices organize abundance estimates across samples or channels. They are the bridge between detection and comparison.
Before ranking biology, confirm that sample labels, group definitions, and normalization assumptions match the study design. Matched enrichment across arms matters here. If isolation efficiency differed systematically between groups, matrix differences may reflect preparation imbalance rather than true organelle biology.
Missing values are common in proteomics matrices. Decide whether a protein was undetectable, inconsistently quantified, or filtered by quality rules before treating absence as biological depletion.
For Label-free, DIA, or TMT designs, keep the quantification chemistry in view when comparing effect sizes across projects or vendors. Different acquisition modes are not interchangeable scorecards.
How to Use Differential Analysis Outputs
Differential tables are usually the decision layer for mechanism hypotheses. They rank proteins by group contrast under defined statistical or fold-change filters.
Read differentials as candidate prioritization, not as final proof of disease mechanism. Enrichment-associated changes can include true lysosome cargo remodeling and residual co-enriched proteins.
Focus first on proteins that match the original claim, such as hydrolases, transporters, trafficking components, or autophagy-lysosome pathway members. Then expand to unexpected hits only after checking enrichment consistency and replicate support.
When comparing suppliers, ask whether differential filters, replicate handling, and report documentation are transparent enough to reproduce the same decision logic on your side.
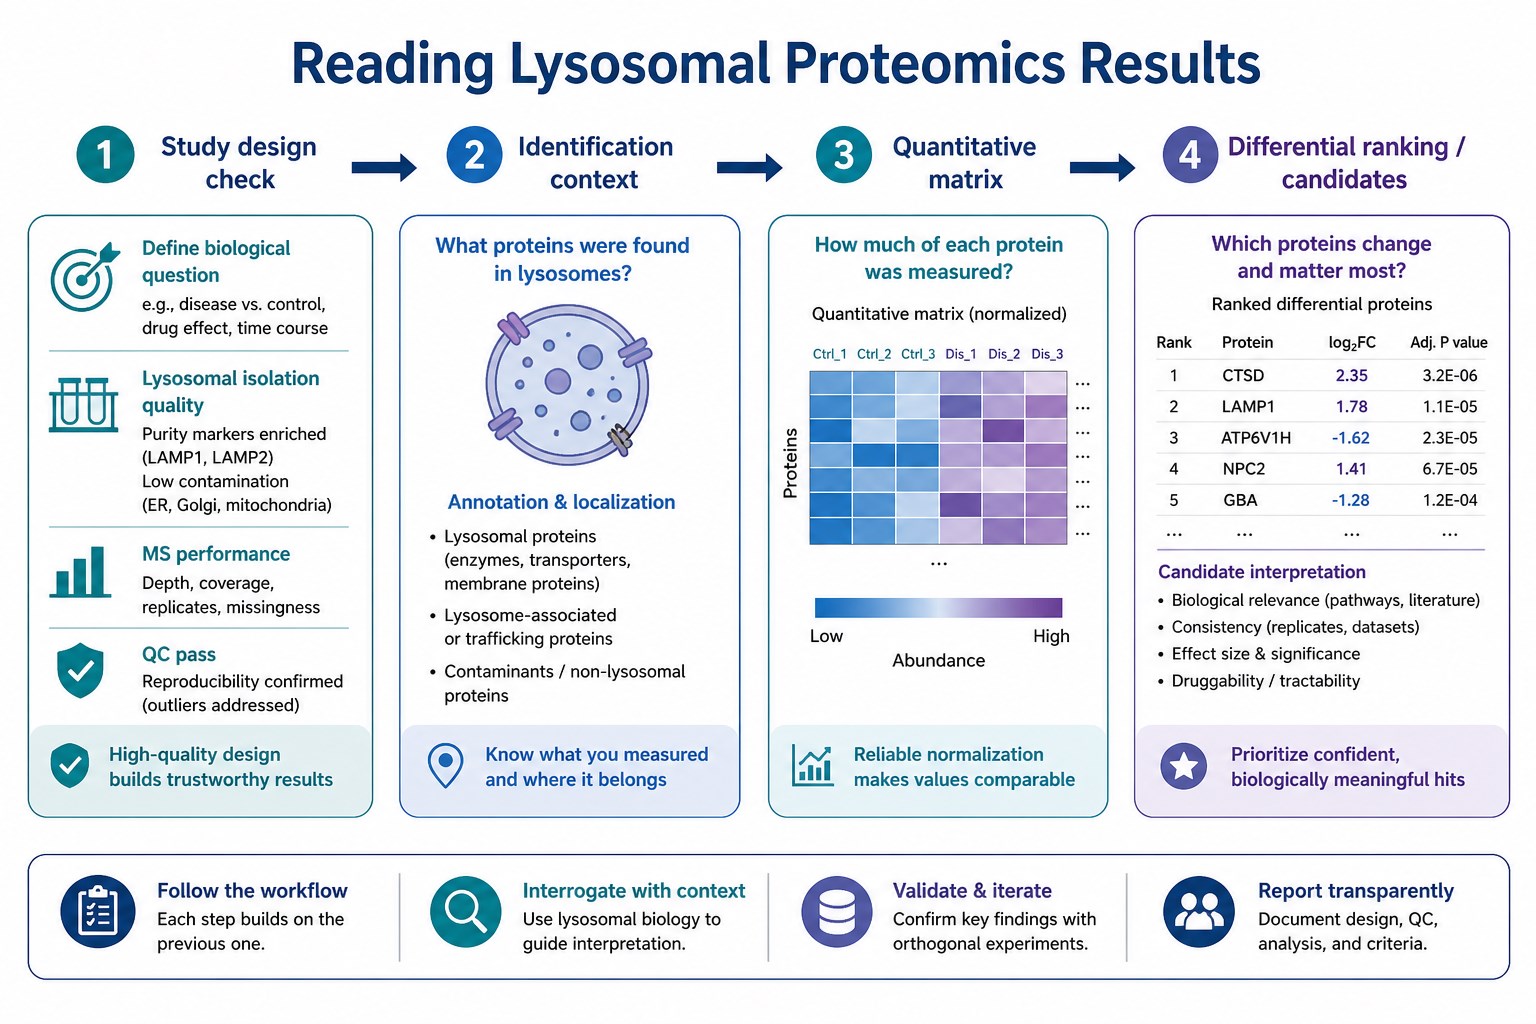
Figure 2. A practical reading order moves from identification context to quantitative matrices, then to differential ranking under the original organelle claim.
How to Use GO, KEGG, PPI, and Related Bioinformatics
Standard bioinformatics helps organize candidates:
- GO terms summarize functional categories
- KEGG maps place proteins into pathway context
- PPI views highlight interaction neighborhoods around priority proteins
Reactome annotation can be available for selected species. Specialized lysosome-only annotation packages beyond the standard set are not a default deliverable.
Pathway enrichment is a hypothesis organizer. Lysosome pathway terms in a chart do not replace enrichment evidence, and they do not prove that every annotated protein was exclusive to lysosomes in the sample.
Use bioinformatics to shorten the candidate list for orthogonal checks. Keep the biological claim narrow enough that pathway language does not outrun the data.
Related Services
Subcellular Proteomics Service
Subcellular Structure and Organelle Proteomics Service
Organelle Isolation and Protein Purification Service
Protein Subcellular Localization Service
Label-Free Quantitative Proteomics Service, MS Based
Quantitative Proteomics Service
iTRAQ/TMT/MultiNotch Quantitative Proteomics Service
Teams comparing report formats or planning follow-up from lysosomal proteomics results can consult MtoZ Biolabs to review which deliverable layers match the current decision stage.
Common Misinterpretations to Avoid
Treating every identified protein as exclusively lysosomal
The dataset is enrichment-associated. Residual contaminants can remain after isolation.
Equating pathway annotation with organelle localization
GO or KEGG lysosome terms are useful context, not localization proof.
Ignoring enrichment balance across groups
Unequal isolation can create false differentials that look biologically convincing.
Expecting membrane and luminal class separation by default
Standard analysis does not resolve those classes as separate reported categories.
Assuming validation is already included
Discovery reports support ranking. Western blot or other confirmation usually needs a separate plan, often with client-defined antibodies or targets.
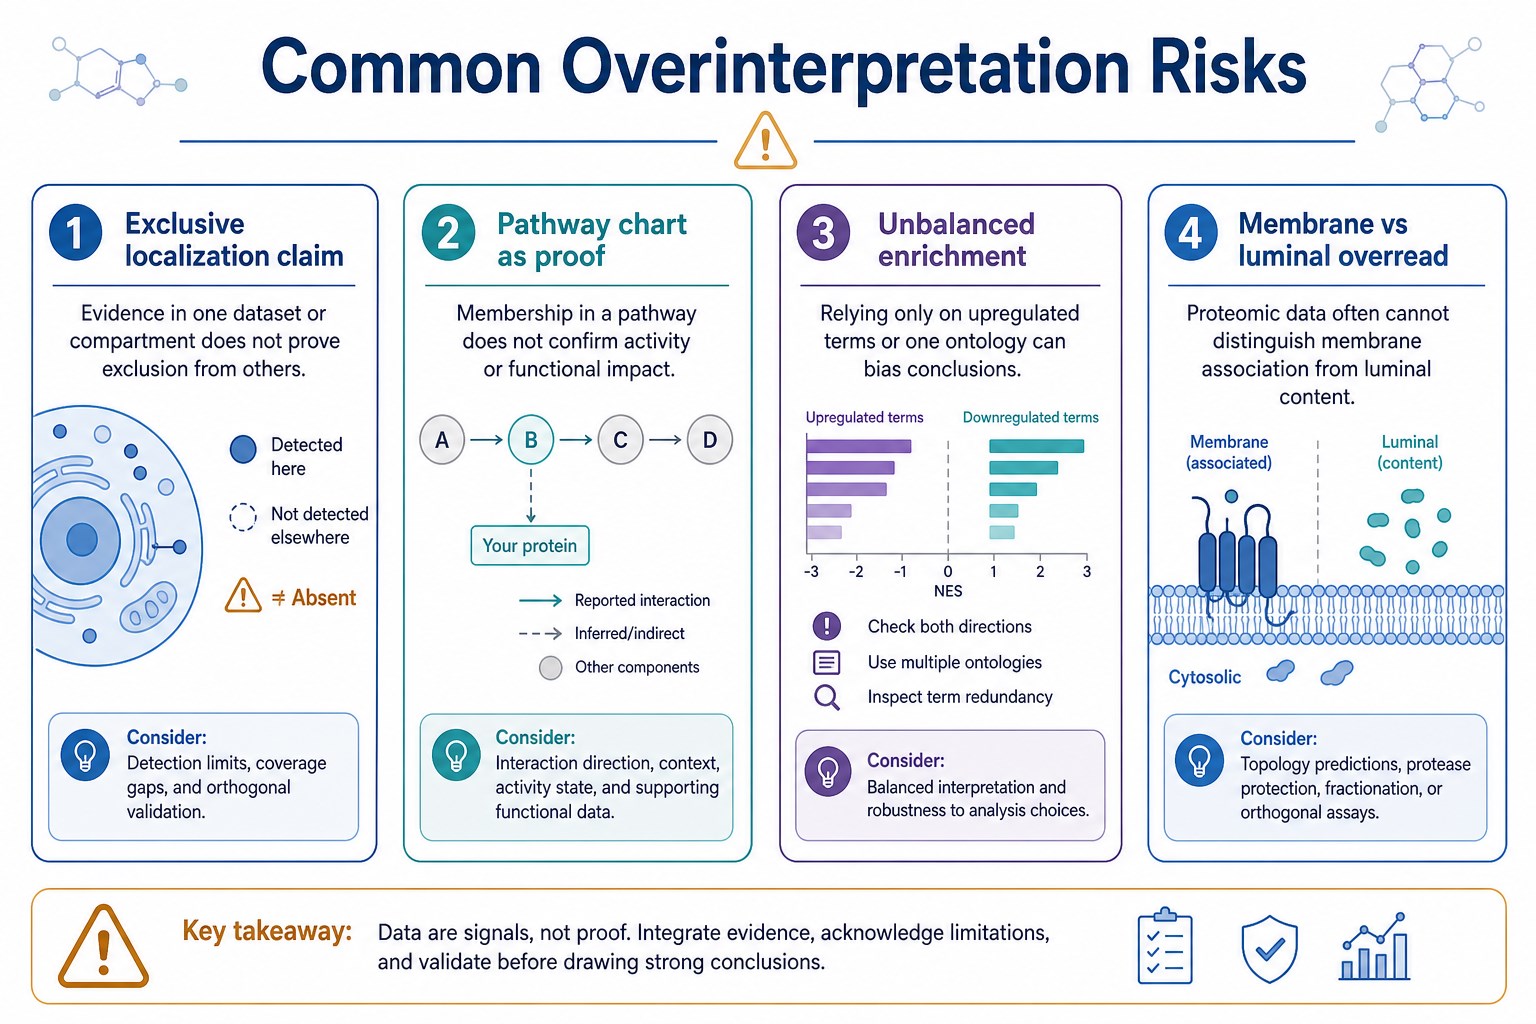
Figure 3. The most frequent overreads are exclusive localization claims, pathway-as-proof logic, and unbalanced enrichment across comparison arms.
A Practical Review Checklist for Vendor or Report Comparison
Confirm that the package includes identification tables, quantitative matrices when promised, differential outputs, and standard GO, KEGG, and PPI layers.
Ask how enrichment QC was documented, including marker checks such as LAMP1 or LAMP2 when isolation was part of the workflow.
Check whether group labels, filters, and missing-value rules are stated clearly enough for independent review.
Decide which candidates need orthogonal confirmation before manuscript or go or no-go decisions.
For projects that need help translating lysosomal proteome analysis outputs into a short candidate list, MtoZ Biolabs can support result review against the original organelle claim.
Frequently Asked Questions
1. What should be checked first in lysosomal proteomics results?
Start with study design alignment: sample groups, enrichment matching, and whether the claim is organelle-centered. Then move to identification context and differential ranking.
2. What does the standard bioinformatics layer usually include?
Standard outputs commonly include GO, KEGG, and PPI views. Reactome may be available for selected species. Specialized lysosome-only annotation is not a default layer.
3. Can identification depth alone prove enrichment quality?
No. Depth reflects detection under the chosen method and input. Marker QC and matched enrichment design are stronger readiness checks.
4. How should differential proteins be prioritized?
Prioritize proteins tied to the original claim, with adequate replicate support, then plan orthogonal confirmation for the top set.
5. Are lysosomal proteomics results enough for final mechanism conclusions?
They are strong for discovery and ranking in enrichment-associated material. Final mechanism claims usually need additional orthogonal evidence.
Conclusion
Interpreting lysosomal proteomics results means reading each deliverable against the original organelle claim. Identification tables define detection context. Quantitative matrices support comparison. Differential lists and GO, KEGG, and PPI outputs organize candidates without proving exclusive localization.
The most reliable review habit is to separate enrichment-associated evidence from localization proof, then reserve orthogonal validation for priority proteins. Teams evaluating report packages or planning next experiments can contact MtoZ Biolabs to review whether the current outputs are being used within their proper interpretive limits.
How to order?




