


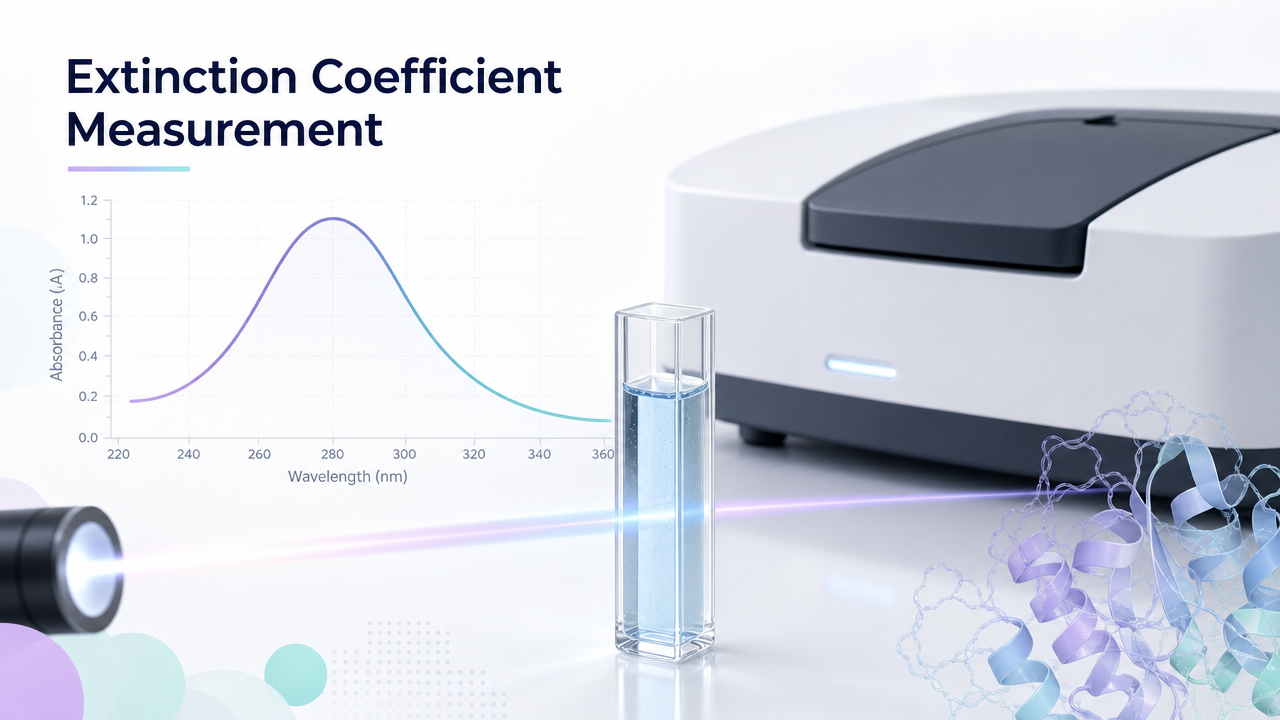
How to Measure the Extinction Coefficient for Proteins and Formulations?
- The extinction coefficient ties absorbance, concentration, and path length; in practice, you either measure it empirically or calculate it from sequence and chemical assumptions for proteins.
- UV-Vis spectrophotometry is the default platform; results are only as trustworthy as buffer blanking, stray-light limits, linear range, and wavelength choice.
- For proteins, A280 is convenient but requires a reliable molar absorptivity (epsilon) at 280 nm; when the true epsilon is unknown, orthogonal methods (for example, amino acid analysis or peptide-based quantification) reduce systematic bias.
- Strong absorbers, turbid samples, and non-specific scattering violate ideal assumptions; baseline subtraction, dilution series, and orthogonal verification are standard risk controls.
- Fast in-process concentration monitoring when the molecule and matrix are stable, and the assay is qualified for the range.
- Tighter comparability across batches when absorbance-based estimates are tracked with consistent methodology.
- Bridgeable release testing in some programs where UV-Vis is justified as a release or characterization test, when linked to primary standards and historical qualification data.
- Unknown or approximate epsilon: Literature epsilon values for similar proteins can mis-estimate concentration if aromatic content differs materially.
- Light scattering and turbidity: Aggregates, subvisible particles, and opalescent formulations increase apparent absorbance without increasing true chromophore concentration the same way.
- Buffer additives: Certain excipients and stabilizers absorb in the near-UV; blanks must match the formulation as closely as possible.
- Nonlinearity at high absorbance: Stray light and detector saturation compress the upper end of the calibration curve; dilution is often required for accuracy.
- If you have a pure, stable analyte with a known chromophore and a clean UV spectrum: measure epsilon by UV-Vis using bracketed concentrations and a traceable concentration anchor.
- If epsilon is uncertain but you need robust protein quantification: pair A280 (where appropriate) with orthogonal quantification (for example, peptide-centric quantification strategies) to reduce bias.
- If the sample is turbid or strongly scattering: prioritize clarification controls, dilution, wavelength selection, and scattering mitigation; do not interpret raw A280 as concentration without qualification.
The extinction coefficient (often discussed alongside molar absorptivity) links measured absorbance to concentration and path length. For biopharmaceutical workflows, a defensible extinction coefficient enables rapid solution concentration estimates, comparability checks, and formulation analytics, provided the measurement is designed around valid Beer-Lambert assumptions and documented uncertainty.
Key Takeaways
What is the Extinction Coefficient?
In UV-Vis work, you commonly see absorbance defined by the Beer-Lambert relationship:
A = epsilon * c * l
where A is absorbance (AU), c is concentration (often mol L^-1 for molar absorptivity epsilon), and l is path length (cm). The product epsilon * l is sometimes discussed as an extinction term in applied settings, while epsilon itself is the molar absorptivity (historically also called the molar extinction coefficient) at a specific wavelength.
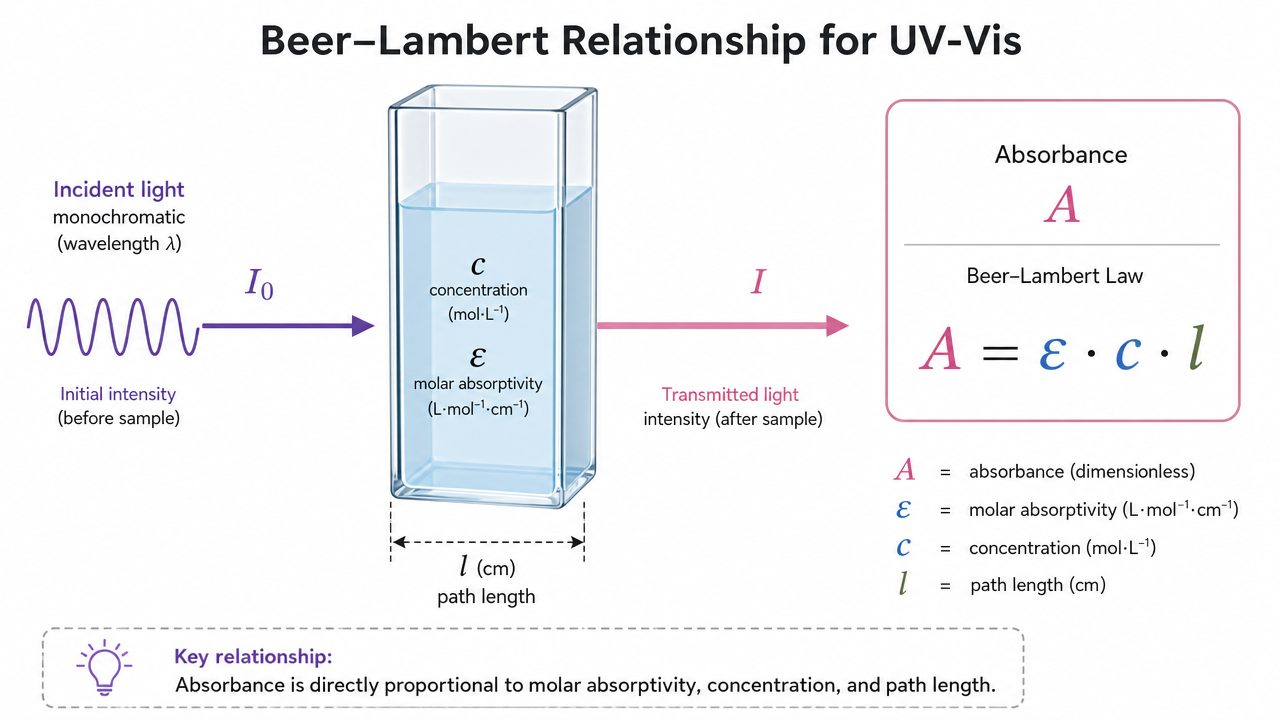
Figure 1. Beer-Lambert relationship schematic linking absorbance, path length, and concentration.
For biopharma analytics, the practical question is not only what epsilon is, but what epsilon is valid for this matrix, at this wavelength, with this instrument, for this concentration range. That is why measurement protocols emphasize linearity, blank composition, and documentation.
Related Services
UV/VIS/NIR Spectroscopy Analytical Service
Protein Circular Dichroism Analysis Service
Fourier Transform Infrared Spectroscopy (FTIR) Service
Why Extinction Coefficients Matter in Biopharmaceutical Analysis?
A well-characterized epsilon enables:
The main benefit is speed and simplicity; the main tradeoff is that absorbance is sensitive to interfering species and instrument effects, so epsilon should be treated as a conditional constant unless the method is fully bracketed.
Main limitations
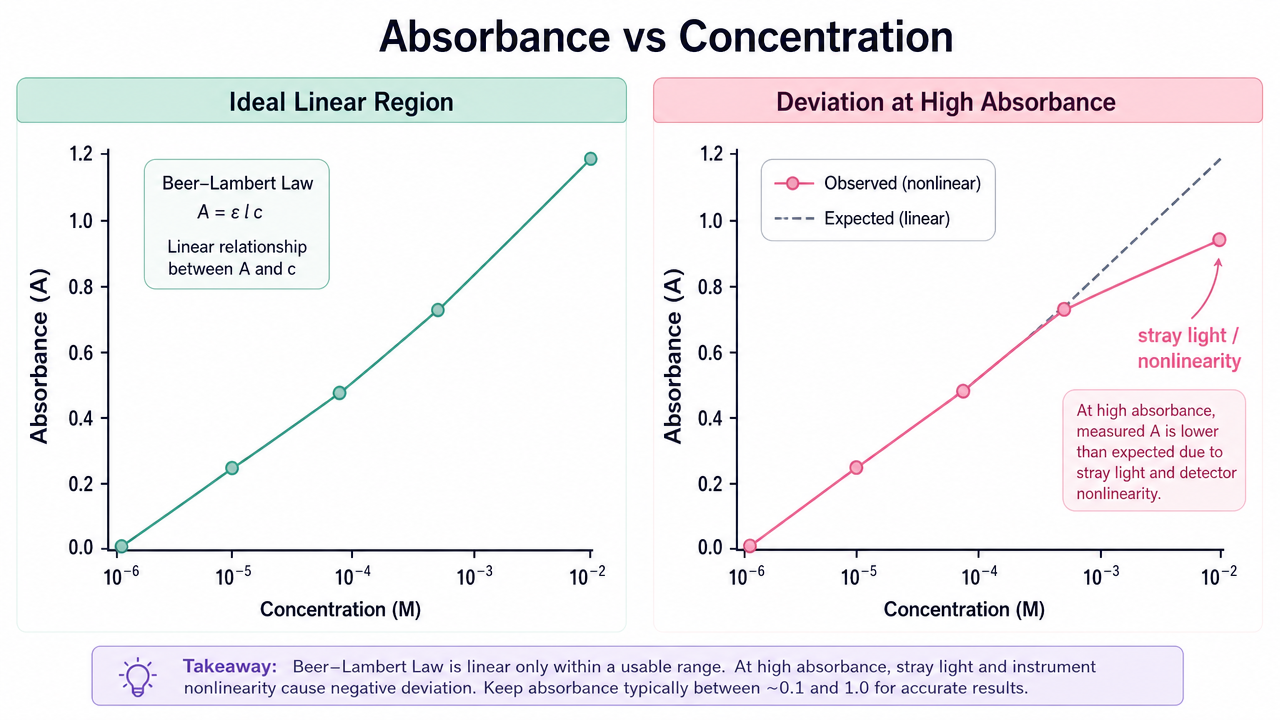
Figure 2. Ideal linear Beer-Lambert region versus high-absorbance curvature driven by stray light and instrument nonlinearity.
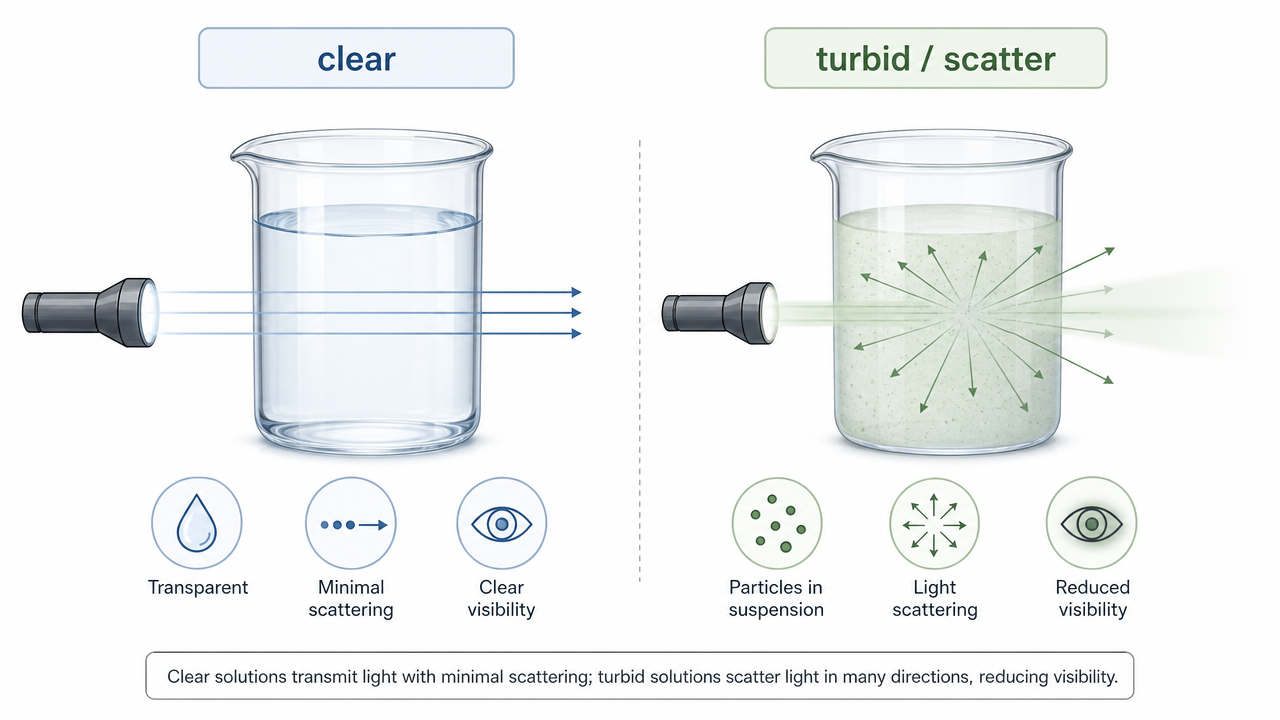
Figure 3. Clear versus turbid samples and how scattering can inflate apparent absorbance readings.
Measurement Methods
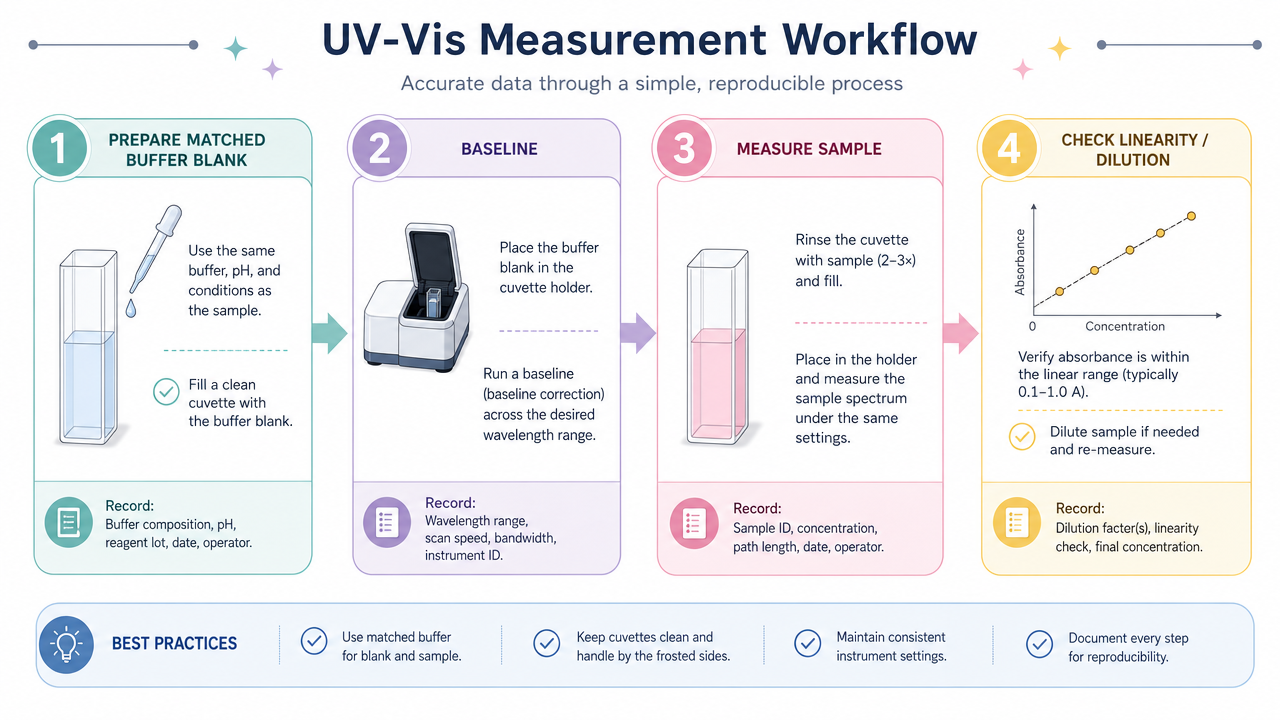
Figure 4. UV-Vis workflow emphasizing matched blanks, baseline subtraction, sample readout, and linearity verification.
1. Spectrophotometry
Measure absorbance across wavelengths (or at a fixed wavelength), then determine epsilon from a bracketed concentration series prepared gravimetrically or by a traceable primary method. This is the default approach for small molecules with clean spectra and for proteins when an independent concentration anchor exists.
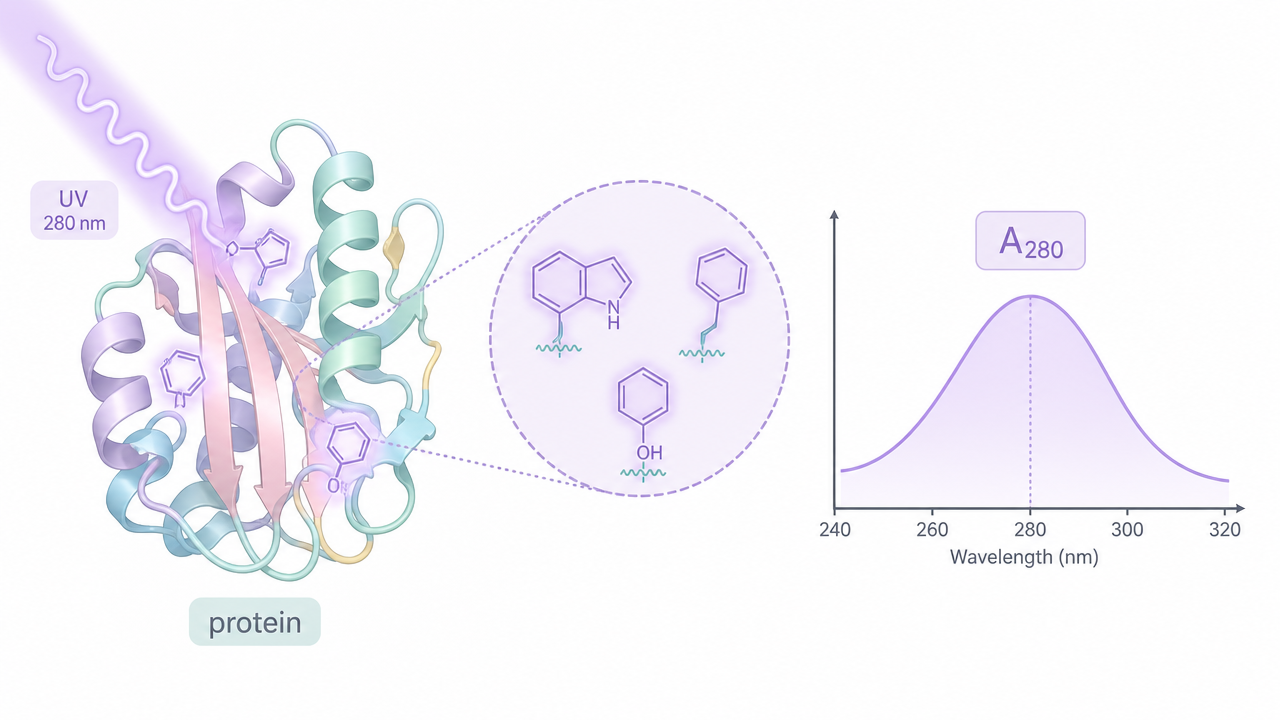
Figure 5. Conceptual illustration of protein absorbance at 280 nm (A280) when a defensible molar absorptivity is available.
2. Colorimetric assays
Colorimetric methods estimate concentration via a reporter reaction (dye binding, reduction assays, etc.). They are valuable for protein quantification when epsilon is uncertain, but they measure an assay response, not a fundamental molar absorptivity of the native protein chromophores; treat the calibration curve as its own analytical entity.
3. Photometry at a fixed wavelength
Fixed-wavelength photometry is common for routine QC when a method has been qualified against a reference standard. The extinction coefficient in this context is effectively embedded in the validated conversion from absorbance to concentration for a defined product and matrix.
Decision Guide for Choosing A Method
FAQ
1. What wavelength should I use to determine epsilon for proteins?
280 nm is standard for proteins with aromatic side chains because absorbance arises largely from tryptophan and tyrosine contributions. If your molecule has unusual chromophores or strong additives that absorb near 280 nm, you may need an alternative wavelength or a different primary method.
2. Can I use a published epsilon value from a database?
Published values can be a starting point, but treat them as hypotheses until verified for your construct, formulation buffer, and instrument path. Even small differences in buffer baseline or aggregation state can shift apparent absorbance.
3. How do I prove linearity?
Prepare at least five non-zero concentrations spanning the working range, measure absorbance, and evaluate residuals versus the Beer-Lambert model. Inspect the upper end for curvature; if curvature appears, reduce concentration range or path length.
4. Is absorbance the same as optical density?
In many biopharma settings the terms are used interchangeably for UV-Vis measurements, but documentation should still define whether values are true absorbance (after blank subtraction) and report path length and wavelength.
Conclusion
Measuring an extinction coefficient is straightforward in principle (fit absorbance to concentration with a known path length), but biopharmaceutical reality demands tighter controls: matched blanks, linearity, scattering awareness, and orthogonal anchors when epsilon is not truly known. When UV-Vis alone is insufficient, spectroscopy services and peptide- or proteomic quantification workflows provide credible bridges from optical readout to traceable concentration.
How to order?

