






Why Tissue Proteomics Results Vary and How to Interpret Protein Changes
Tissue proteomics datasets can differ in protein identification counts, relative abundance profiles, and differential-protein lists because the measured signal combines several layers of variation. Biological regulation changes protein abundance within cells; tissue composition and sampling region change the mixture of proteins entering the analysis; and peptide detectability, quantitative coverage, and data-processing settings influence which proteins are identified and reported as differential. A clear interpretation begins by locating the difference, evaluating the evidence behind the result, and relating the pattern to tissue biology.
Why Do Tissue Proteomics Results Differ?
1. Biological Changes Within Cells
Disease states, treatments, developmental stages, and other biological conditions can alter protein abundance within a cell population. Changes in protein synthesis or degradation may shift particular proteins even when the overall tissue composition remains similar. When the pattern is consistent across samples, the abundance shift may reflect the biological response under study. Because bulk tissue data combine signals from multiple cell populations, histology and cell-composition information can help clarify which tissue components are most likely to contribute to the change.
2. Tissue Composition and Regional Heterogeneity
Bulk tissue proteomics measures the combined protein signal from the cells and extracellular structures present in the analyzed material. A higher abundance of immune-associated proteins may reflect increased immune-cell representation, altered abundance within immune cells, or both. Likewise, higher collagen and other extracellular matrix signals may reflect matrix accumulation or a greater proportion of stromal tissue. Different regions of the same organ can also vary in viable cells, vessels, inflammatory infiltrates, necrotic material, and matrix content. As a result, samples assigned the same organ or tissue label may still produce distinct protein profiles.
3. Biological Variation and Quantitative Coverage
Samples within the same group naturally vary in their protein abundance profiles. Biological variation broadens the range of measured values, while peptide detectability influences which proteins receive usable quantitative measurements. A protein may be identified in one sample but lack a quantitative value in another, particularly when its signal is near the measurement limit. Reviewing sample-level values and peptide evidence helps distinguish biological variation from differences in quantitative coverage.
4. Data Processing and Differential Protein Results
The final differential-protein list reflects both the measured data and the analytical choices used to evaluate them. Normalization, protein-filtering rules, missing-value handling, the statistical model, and multiple-testing correction all shape which proteins are reported. Analyses based on related datasets may therefore yield different candidate lists when their processing methods or selection criteria differ. Cross-study comparisons are more informative when the reference database, quantification definitions, processing methods, and reporting criteria are reviewed alongside the protein names.
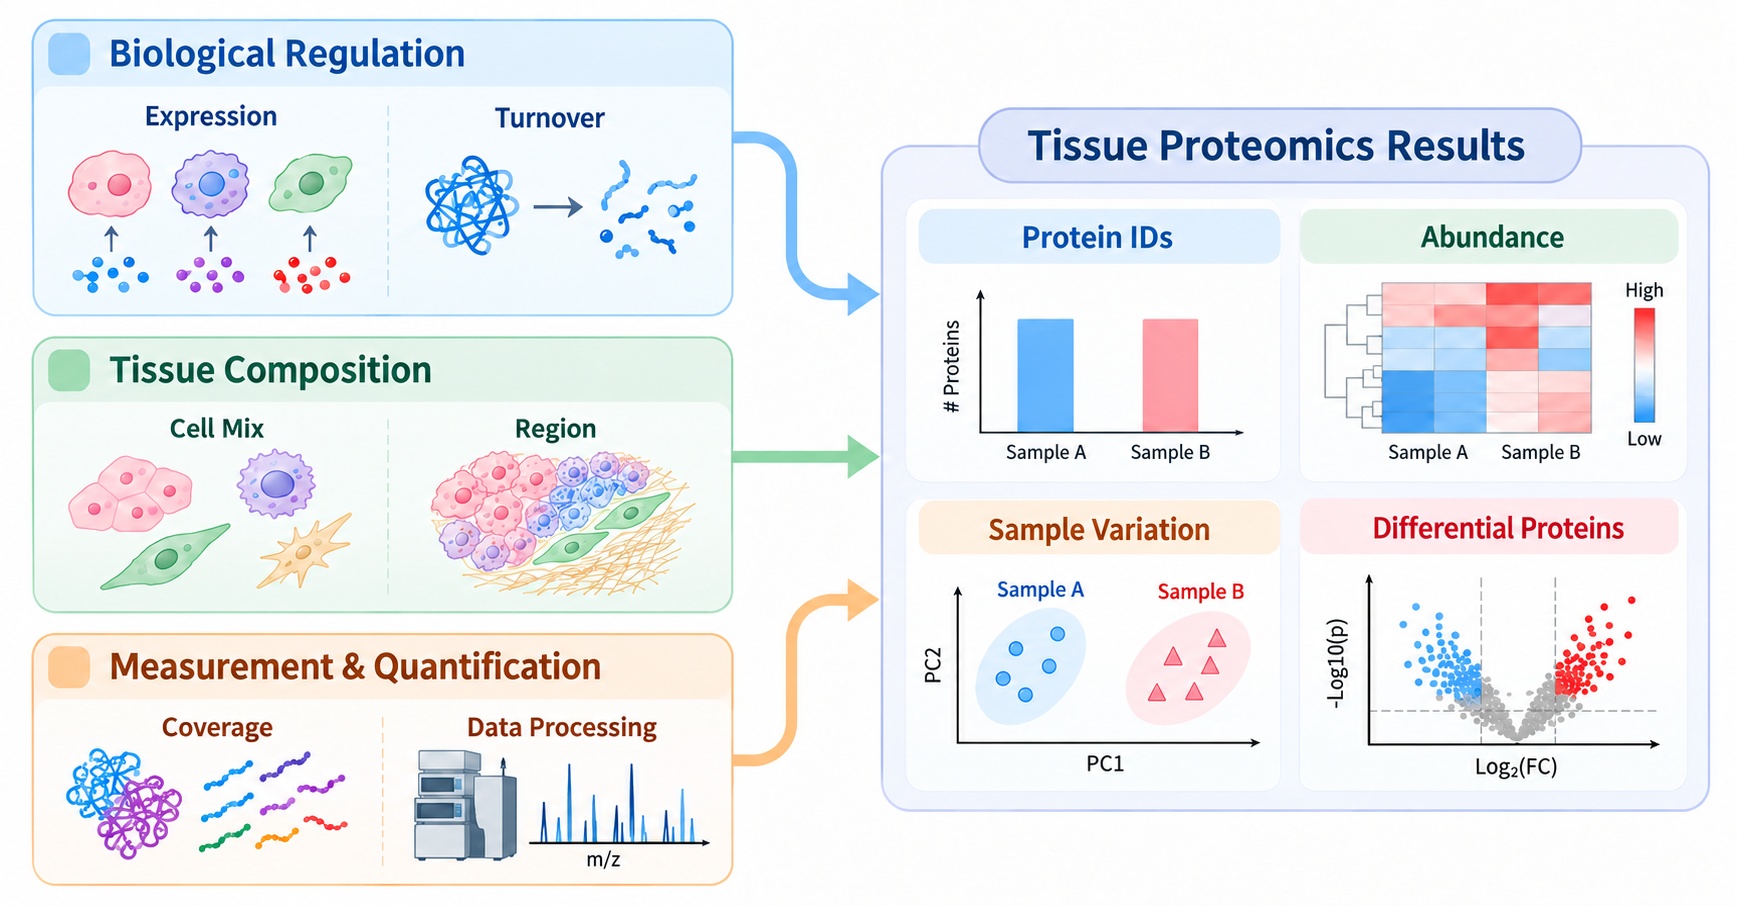
Figure 1. Sources of variation in tissue proteomics.
These sources often overlap. For example, inflamed tissue may contain a greater proportion of immune cells while also showing altered protein abundance within those cells. Interpreting the observed profile therefore involves assessing how biological regulation, tissue composition, and quantitative evidence contribute to the same result.
Protein Identification and Data Quality
1. Protein Counts and Identification Confidence
Protein identification counts describe the breadth of detected proteins. Their values vary with tissue complexity, abundance distribution, and peptide detectability. For proteins central to the research question, peptide-level evidence and identification confidence show how firmly each identification is supported; quantitative coverage then indicates how broadly the protein can be compared across samples.
2. Quantitative Coverage and Missing Values
Identification and quantification provide complementary evidence. When a protein has quantitative values for only a subset of samples, the group comparison may be less stable. Review the number of samples contributing to the estimate, the distribution of missing values, and the peptide evidence supporting identification. Group-specific detection may reflect a real abundance difference or variation in detectability and quantitative coverage; sample-level values help distinguish these patterns.
Protein Abundance Variation Across Samples
1. Sample-Level Abundance Profiles
A relative abundance matrix shows whether differences are widespread across a protein profile or concentrated in a smaller set of proteins. Group averages can conceal overlap between individual samples, while a few extreme values can amplify an apparent group difference. Inspect individual sample values and within-group spread alongside summary statistics. LC-MS/MS tissue proteomics generally reports relative abundance, so intensity values are most useful for comparing samples within the dataset.
2. Correlation, PCA, and Clustering
Pairwise correlation summarizes similarity between sample-level abundance profiles. Principal component analysis (PCA) highlights major sources of variation, while clustering groups samples according to similarity across the proteins included in the analysis. Together, these views show whether samples from the same condition share a profile and identify samples or groups that warrant closer review. When PCA shows group separation, examine the proteins contributing to the pattern and compare them with the abundance matrix and tissue annotations to develop a biologically grounded interpretation.
For questions about tissue-region matching, paired comparisons, and group comparability, see Experimental Design for Comparative Tissue Proteomics.
Evaluating Differential Protein Results
1. Fold Change and Sample-Level Variation
Fold change describes the magnitude and direction of an abundance difference. Its interpretation becomes stronger when the change is consistent across samples. A moderate shift observed in the same direction across most samples may provide a clearer pattern than a large estimate driven by one extreme value. Review individual abundance values and within-group variation before prioritizing candidates, particularly when tissue composition or histological features differ among samples.
2. Adjusted P-values and Quantitative Evidence
An adjusted P-value summarizes statistical evidence after correction for multiple testing. Fold change describes effect size, while quantitative coverage and sample-level consistency help establish how robust the observed pattern is. Read these measures together: a large estimated change supported by limited coverage or uneven missingness needs more careful review than a pattern supported across the group.
3. Candidate Protein Prioritization
Candidates are more compelling when the direction of change is consistent, quantitative evidence is adequate, statistical support is credible, and the result is relevant to the research question or tissue phenotype. A useful ranking integrates fold change with sample-level consistency and the biological context. Coordinated changes among related proteins can further strengthen a hypothesis when the pattern fits the sampled tissue.
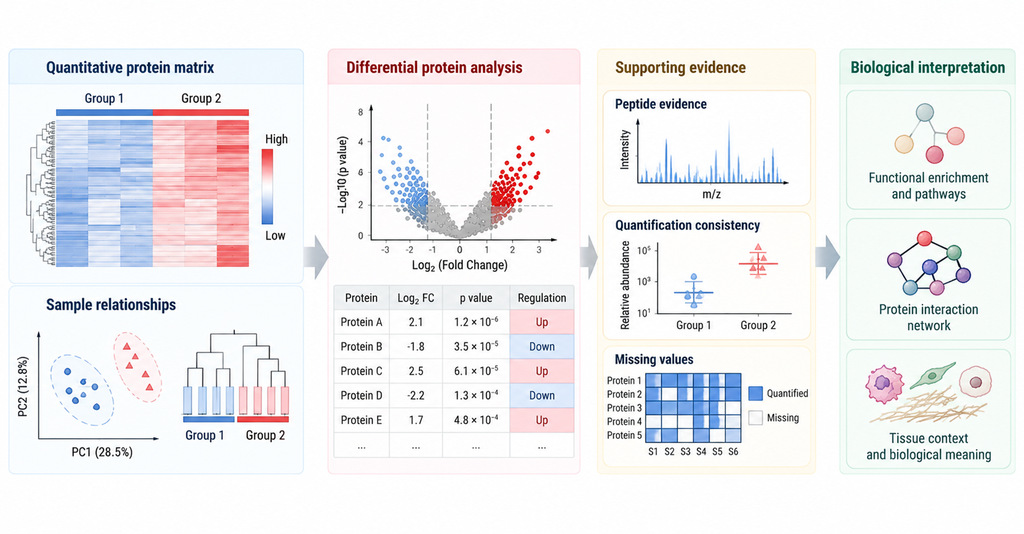
Figure 2. Evidence for Interpreting Differential Protein Results.
Functional Analysis and Biological Interpretation
1. Functional Enrichment in Tissue Context
Gene Ontology (GO) describes proteins by biological process, molecular function, and cellular component; KEGG and Reactome organize proteins into pathways. Enrichment analysis tests whether annotations are overrepresented in a selected protein list relative to a defined background. Results depend on protein identification coverage, the composition of the input list, annotation availability, and background selection. Enriched immune or extracellular matrix terms point to themes represented in the selected proteins. Reviewing the contributing proteins, their abundance directions, and the tissue phenotype helps establish what those themes may mean biologically.
2. Protein-Protein Interaction Networks
Protein-protein interaction (PPI) networks place differential proteins in the context of reported or predicted molecular relationships. Network clusters can highlight candidate processes for follow-up. Comparing network patterns with differential-protein evidence and independent observations about the tissue helps determine which hypotheses merit further study. For disease- and drug-response applications, see Tissue Proteomics for Disease and Drug Response Studies.
Frequently Asked Questions
1. How should protein identification counts be compared?
Identification counts reflect coverage and can vary with tissue composition, abundance distribution, and peptide detectability. To assess data quality, review peptide evidence and quantitative coverage for proteins relevant to the research question alongside the total count.
2. How should group-specific protein detection be assessed?
Group-specific detection may reflect a genuine abundance difference or limited detectability in the other group. Sample-level measurements, peptide support, and missing-value patterns help distinguish these possibilities.
3. How can cell-composition evidence inform bulk tissue results?
Bulk tissue proteomics captures a combined signal from multiple cell populations and extracellular structures. Histology, tissue annotations, and independent cell-composition evidence can help assess whether expression changes, shifts in cell proportions, or both contribute to the observed profile.
4. Which proteins should be considered for follow-up validation?
Prioritize candidates with adequate quantitative coverage, consistent sample-level changes, credible statistical support, and a clear link to the research question. The follow-up approach should match the protein, available material, and type of evidence needed.
Conclusion
Tissue proteomics results differ because biological regulation changes protein abundance within cells, tissue composition and sampling region alter the mixture being measured, and identification, quantification, and data-processing factors shape the reported results. A strong interpretation connects these sources to peptide evidence, quantitative coverage, sample-level variation, differential statistics, and tissue context. Following this sequence helps explain both where a difference originates and how confidently it can be interpreted.
For the broader research pathway, see Tissue Proteomics: Sample Preparation, Workflow, Data Analysis, and Applications. MtoZ Biolabs provides Tissue Proteomics Service for protein identification, relative quantification, differential protein analysis, and related data analysis according to project scope.
How to order?