






How to Interpret Serum Proteomics Results and Quality Metrics
Serum proteomics reports contain several layers of information, from protein identification and relative quantification to sample-level quality metrics, differential proteins, and functional analysis. These results should be read in sequence rather than interpreted independently. Protein identification establishes what was detected, quantitative data show how protein signals vary across samples, quality metrics indicate whether those comparisons are sufficiently consistent, and differential and functional analyses place the observed changes in the context of the research question. This page focuses on how these result types connect and what evidence supports a reliable biological interpretation.
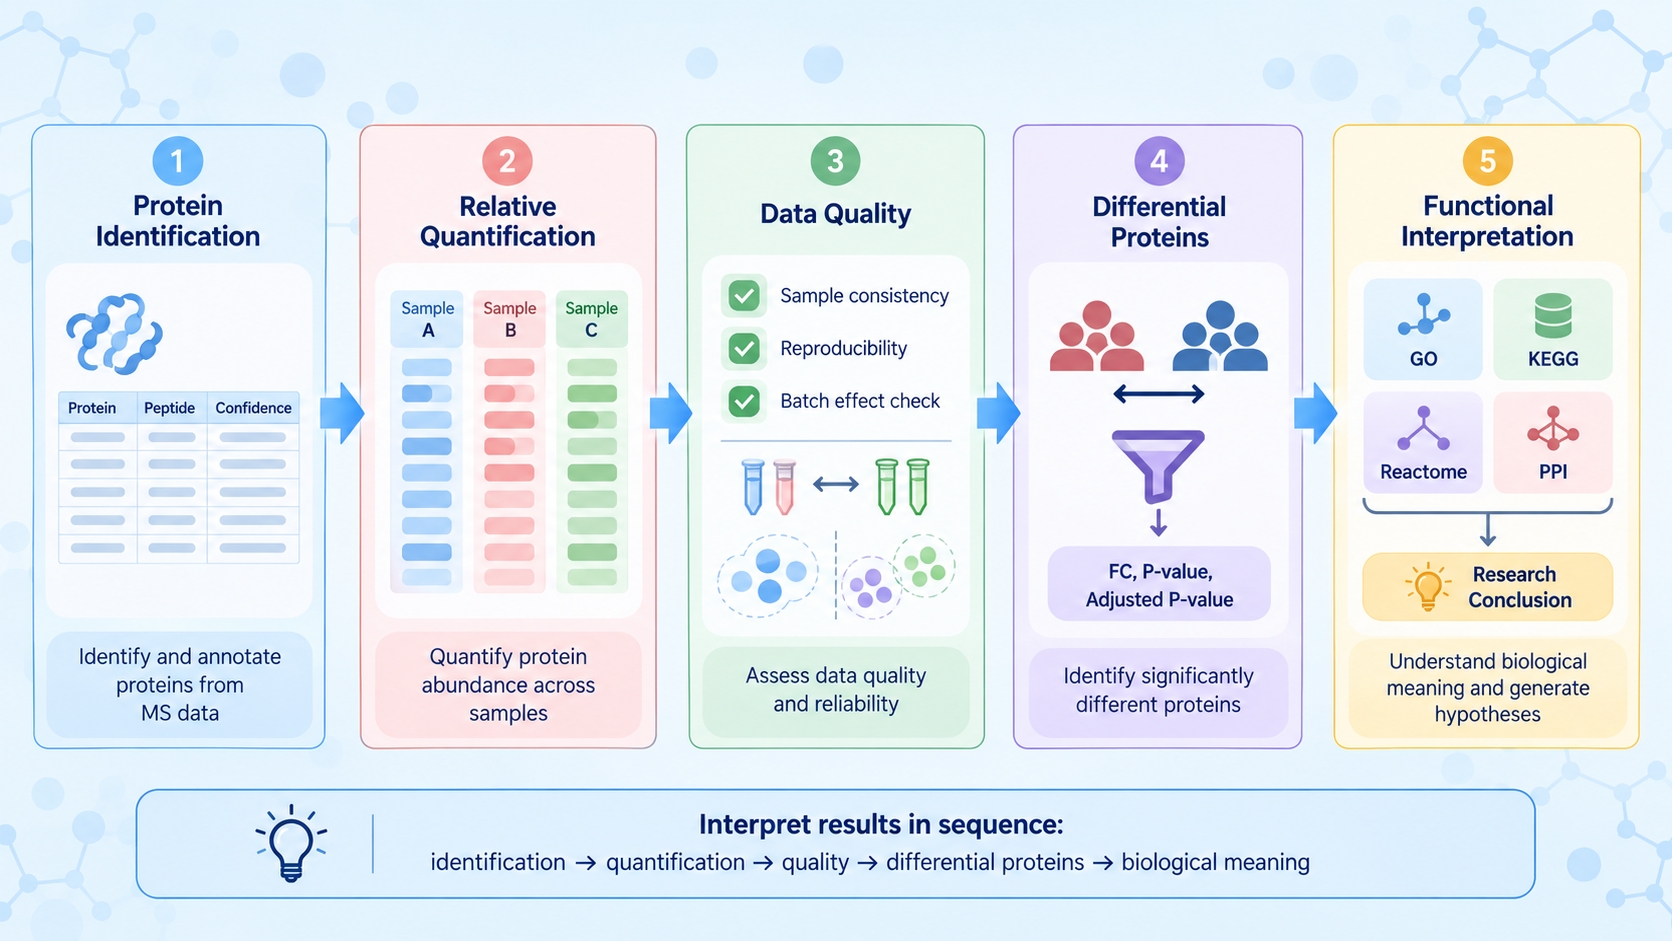
Figure 1. Recommended sequence for interpreting serum proteomics results.
Protein Identification and Quantification Results
A serum proteomics report may include protein identification, relative quantification, QC metrics, sample comparisons, differential analysis, functional annotations, raw data, and an analysis report. Start by identifying what each result represents and how it contributes to interpretation.
|
Result Type |
Information Available for Interpretation |
|
Protein identification |
Identified proteins / protein groups and associated peptide evidence |
|
Relative quantification |
Protein or peptide intensity values across samples |
|
Quality control |
Peptide length, identification scores, and sample-level data quality |
|
Sample comparison |
Correlation, PCA, and clustering |
|
Differential analysis |
Differential proteins and volcano plot results |
|
Functional analysis |
GO, KEGG, Reactome, and PPI, depending on project settings |
|
Other deliverables |
Raw data and analysis report |
1. Reading Protein Identification Tables and Quantification Matrices
Protein identification and quantification tables answer different questions. Identification results show which proteins are supported by peptide evidence, while quantitative results describe how the measured protein signal varies among samples.
(1) Protein Groups
When several proteins share the same identified peptides, results may be reported as a protein group because the available evidence does not distinguish each protein individually. Interpret the group using the reported peptide evidence rather than assuming that every listed protein was independently identified.
(2) Protein Abundance and Sample-Specific Values
Quantification matrices report protein-level signals for individual samples. Before comparing values, check whether the reported data are raw intensities, normalized values, or log-transformed values. The same protein can then be followed across samples to determine whether its abundance pattern is consistent with the reported group difference.
2. Protein Identification Counts and Relative Quantification
Protein identification counts describe dataset coverage. Interpret the counts alongside peptide evidence and quantitative data; differences among samples can be more informative than the absolute number and may warrant review of sample-level QC.
(1) Reference Protein Coverage
For standard DIA analysis of human serum without high-abundance protein depletion, approximately 1,000–3,000 proteins may be identified per sample. Actual coverage varies with sample condition and analytical performance, so the range is a technical reference rather than an expected result.
(2) Relative Protein Abundance
Relative quantification compares the measured signal of the same protein across samples or experimental groups. Higher normalized abundance in one group indicates a stronger relative signal under the applied quantification method; it does not represent an absolute serum concentration. Quantitative values from different proteins should also not be compared as if they were directly equivalent concentrations because mass spectrometric response differs among peptides and proteins.
3. Interpreting Undetected Proteins and Missing Quantitative Values
A protein absent from the report may reflect low abundance, limited peptide detectability, or data-processing filters rather than biological absence. For proteins quantified in only some samples, examine whether missing values are isolated, concentrated in particular samples, or associated with low quantitative completeness across the dataset. This pattern helps distinguish protein-specific detection limits from broader data-quality concerns.
Assessing Serum Proteomics Data Quality
1. Quality Metrics and Quantitative Data Completeness
QC results help assess whether protein identification and quantification are consistent enough for sample comparison. Review the available metrics together to understand whether analytical performance is comparable across samples.
(1) Identification-Level Metrics
Peptide length distributions and identification scores provide information about the peptide evidence supporting protein identification. The emphasis should be on whether the overall distributions are reasonable and whether individual samples show clear deviations from the rest of the dataset.
(2) Quantitative Completeness
Quantitative completeness shows how consistently protein abundance values are available across samples. Extensive missing values in one sample or a subset of proteins can affect subsequent statistical analysis. The distribution of missing values is therefore more informative than a single overall percentage.
2. Sample Correlation and Within-Group Consistency
Sample correlation shows how similar the overall protein abundance profiles are between samples. Biological replicates are generally expected to show comparable patterns, but there is no universal correlation coefficient that defines an acceptable serum proteomics dataset. A sample with consistently lower correlation to other samples in the same group should be reviewed together with its quantitative completeness and other QC results. High overall correlation also does not exclude biologically meaningful changes in a smaller subset of proteins.
3. Principal Component Analysis and Outlier Assessment
PCA summarizes major sources of quantitative variation across serum samples. Samples positioned close together have more similar abundance patterns along the displayed components; separation indicates differences in those components. Group separation or overlap should be interpreted with correlation, quantitative completeness, and study context to assess whether the pattern reflects group effects, technical variation, or biological heterogeneity.
When sample condition may explain an unusual pattern, see How Does Serum Sample Quality Affect Proteomics Results?. For questions about group structure and study design, see Comparative Serum Proteomics: Study Design for Differential Protein Analysis.
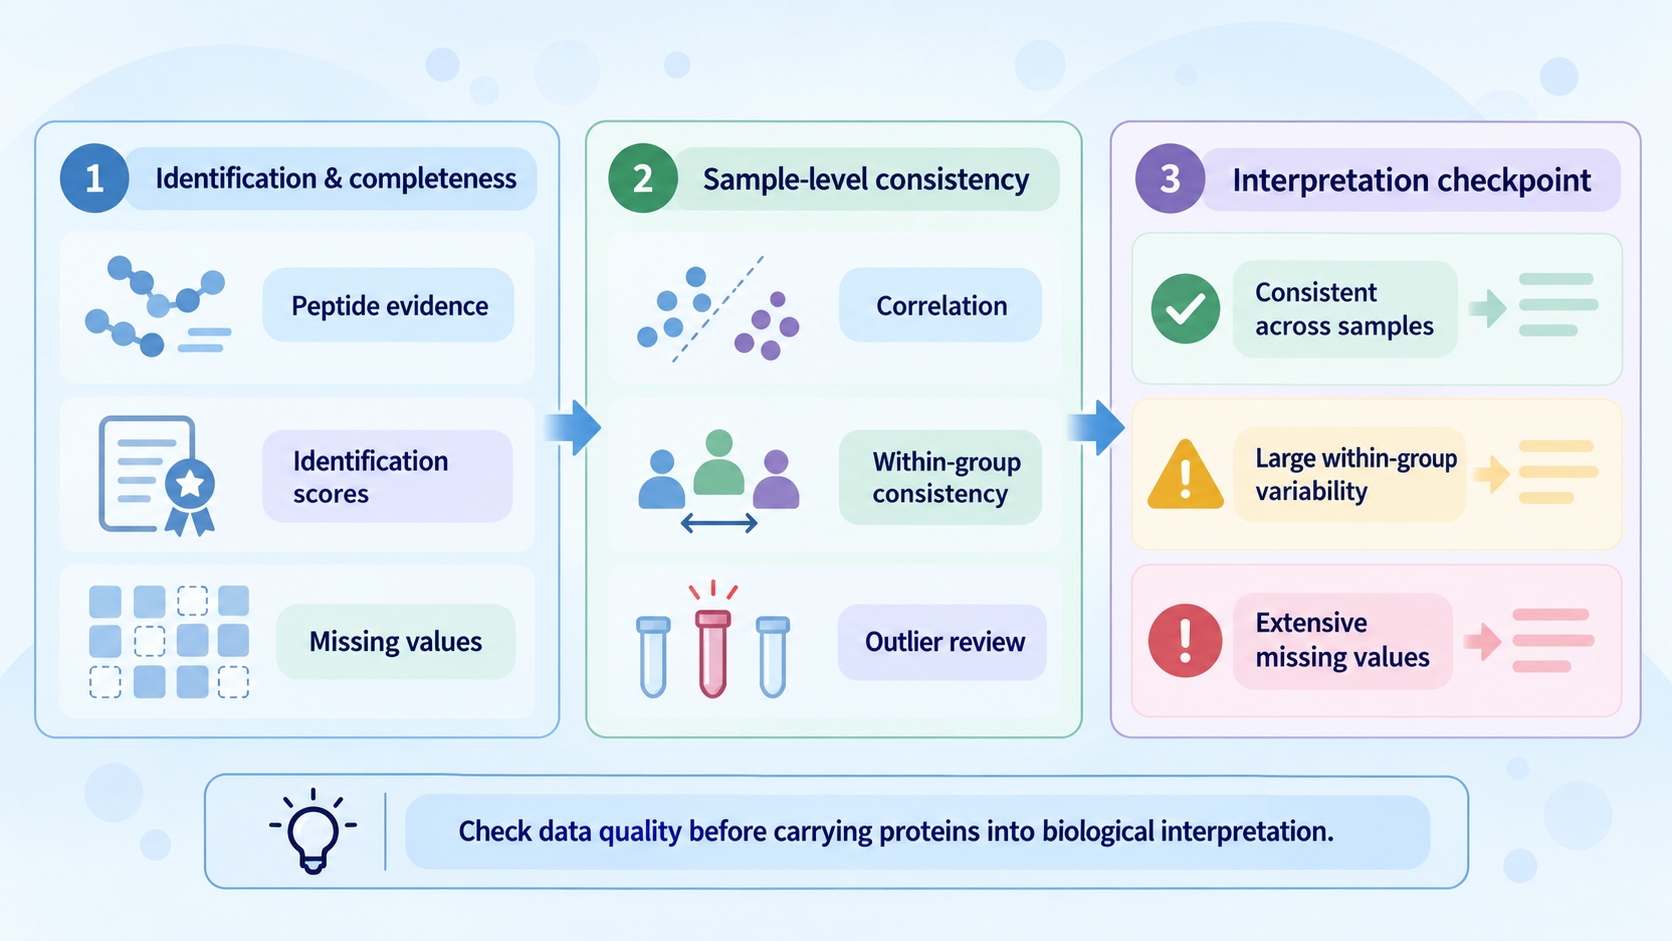
Figure 2. Data quality checkpoints in serum proteomics result interpretation.
Interpreting Differential Protein Results
1. Fold Change and Statistical Significance
(1) Fold Change
Fold Change describes the relative abundance difference between two groups, while log2 Fold Change expresses the same difference on a logarithmic scale. Positive and negative values indicate opposite directions of change according to the comparison defined in the report.
(2) P-value and Adjusted P-value
The P-value reflects statistical evidence under the applied model, while the Adjusted P-value accounts for multiple protein comparisons. A large Fold Change with substantial within-group variability may have weak statistical support, whereas a smaller but consistent change can produce stronger statistical evidence.
2. Reading Volcano Plots and Heatmaps
Volcano plots combine abundance change and statistical evidence in a single view. The horizontal axis represents log2 Fold Change, while the vertical axis generally represents −log10(P-value) or −log10(Adjusted P-value), depending on the analysis settings. The direction of up- and downregulation must always be read according to the defined group comparison.
Heatmaps show how selected proteins vary across individual samples. Because many heatmaps use protein-wise standardized values, color intensity should not automatically be interpreted as the original quantitative abundance. A consistent group-level pattern supports the reported difference, whereas strong variation among biological replicates warrants closer inspection.
3. Evaluating the Reliability of Differential Proteins
Review individual sample values before carrying a differential protein into biological interpretation. Changes in the same direction across most samples in one group are easier to interpret than results driven by a single extreme value. High within-group variation or extensive missingness can make statistical significance sensitive to a few observations or to missing-value handling.
Biological Functions of Differential Proteins
Functional analysis may include GO, KEGG, Reactome, and PPI analysis, depending on the project scope. UniProt is used for standard protein annotation. When a customer-provided FASTA file is used for customized database searching, downstream GO, KEGG, Reactome, and PPI analyses are not performed by default because annotation availability depends on the supplied protein information.
1. GO Enrichment of Biological Processes and Molecular Functions
GO enrichment identifies functional terms that are overrepresented among the differential proteins. The result should be interpreted from the proteins contributing to each term rather than from the term name alone. Several significant GO terms may be driven by overlapping protein sets, so multiple enriched terms do not necessarily represent multiple independent biological changes. Terms that are relevant to the research question and supported by coherent protein changes are generally more informative than isolated annotations.
2. KEGG and Reactome Pathway Analysis
KEGG and Reactome analyses place differential proteins within annotated biological pathways. Enrichment indicates that differential proteins are overrepresented in a pathway under the applied statistical model. Assess the contributing proteins and their Fold Changes to determine whether the pattern supports a coherent biological interpretation; pathway activation or inhibition requires additional evidence.
3. Protein–Protein Interaction Networks and Functional Associations
PPI analysis shows known or predicted functional associations among differential proteins and can highlight groups of connected proteins. Network edges may represent different types of evidence and should not automatically be interpreted as direct physical interactions in the analyzed serum samples. Highly connected proteins are also not necessarily key regulators. Their relevance should be judged from the measured abundance changes and whether the network pattern is consistent with GO or pathway results.
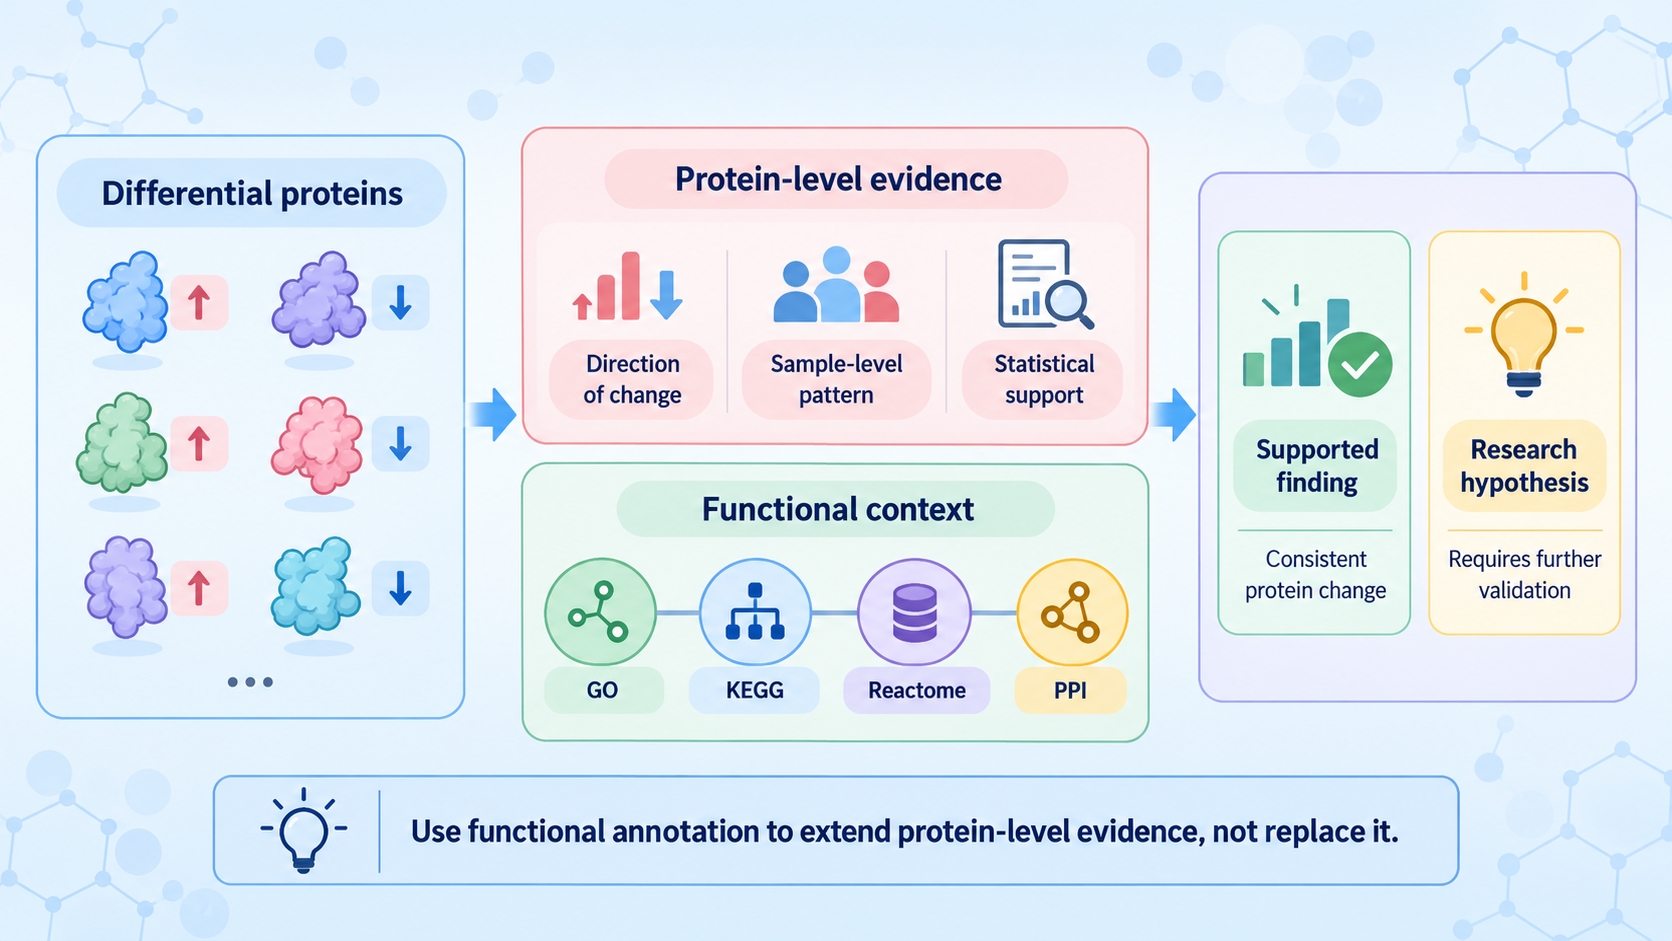
Figure 3. From differential proteins to supported findings and research hypotheses.
Integrated Interpretation of Proteomics Results
1. Connecting Protein Changes to the Research Question
Integrated interpretation starts with the protein-level evidence. First confirm that the protein is supported by reliable identification and quantitative data. Then determine whether the abundance change is consistent across samples and supported by the differential analysis. Functional annotations can then be used to ask whether several altered proteins converge on a biological process relevant to the original research question.
A pathway-level interpretation is stronger when several proteins within the same biological process show compatible abundance patterns than when the conclusion depends on a single annotated protein. Functional analysis adds context to the protein-level evidence.
2. Distinguishing Supported Findings from Research Hypotheses
The final interpretation should distinguish what is directly supported by the dataset from what remains a biological hypothesis. A reproducible abundance difference can support the conclusion that a protein is associated with the comparison being studied. GO or pathway enrichment can support a functional association, but it does not establish pathway activation or a causal mechanism.
Findings supported by consistent protein-level measurements, statistical evidence, and related functional results can form the main conclusions of the study. Isolated protein changes, conflicting sample-level patterns, or conclusions based mainly on database annotation should be described more cautiously and may require independent validation.
For studies specifically aimed at biomarker discovery, see Serum Proteomics for Biomarker Discovery: From Differential Proteins to Candidate Selection.
Frequently Asked Questions
1. Can protein identification counts be compared directly across studies?
Only compare protein identification counts across studies when acquisition methods, search databases, filtering criteria, and sample characteristics are sufficiently similar. Otherwise, differences in reported counts may reflect analytical and reporting choices rather than biological differences.
2. How should missing quantitative values be handled before differential analysis?
The approach depends on the pattern and extent of missingness and on the statistical workflow. Check whether missing values cluster in particular samples, groups, or low-abundance proteins, and use a consistent documented strategy. Missing values should not automatically be treated as zero.
3. Does a significant adjusted P-value establish biological importance?
No. The adjusted P-value provides statistical evidence after accounting for multiple comparisons. Assess it together with fold change, consistency across samples, and relevance to the research question.
4. Why can enrichment results differ between analyses?
Comparisons require consistent annotation sources, background protein sets, and analysis settings. Differences in databases or enrichment backgrounds can change which terms reach significance, so review the analytical context alongside the reported terms.
Conclusion
Serum proteomics results form a connected evidence chain, from protein identification and relative quantification to data quality assessment, differential analysis, and functional interpretation. Reliable conclusions bring together consistent quantitative evidence, statistical results, and relevant functional associations in the context of the original research question.
For a broader overview of serum proteomics workflows and data interpretation, see Serum Proteomics: Sample Preparation, Workflow Analysis, and Research Applications. For projects with defined samples and research objectives, MtoZ Biolabs provides Serum Proteomics Service covering protein identification, relative quantification, differential analysis, and related bioinformatics according to the agreed project scope.
How to order?