






How Does Serum Sample Quality Affect Proteomics Results?
Serum proteomics uses LC-MS/MS to identify circulating proteins and compare their relative abundance across samples. However, the measured profile reflects both biology and sample condition. Hemolysis, lipemia, icterus, residual fibrin, delayed separation, storage differences, and repeated freeze-thaw exposure can change the protein mixture entering analysis or affect protein recovery. The practical question is whether a quality issue could influence protein identification, relative quantification, or comparisons between study groups.
Serum Sample Quality Assessment
A useful quality assessment should establish what issue is present, how severe it appears, and which samples are affected. Visual inspection can flag hemolysis, lipemia, icterus, fibrin, or clots, but it cannot reveal every problem or quantify its analytical impact. Processing records are therefore important: two samples that look similar may have different separation delays, storage histories, or freeze-thaw exposure.
1. Visual Indicators of Serum Quality
Record the appearance and severity of each sample. Common visual indicators include:
- Pink or red serum: may indicate hemolysis. Color intensity alone does not quantify the proteomic impact.
- Marked turbidity or a visible lipid layer: may indicate lipemia. Slight turbidity is not equivalent to milky serum with a thick lipid layer.
- Deep yellow or yellow-brown serum: may indicate icterus. Color alone cannot quantify analytical interference.
- Fibrin strands, clots, or obvious precipitates: may indicate incomplete serum separation.
Visual inspection is a screening step; processing records help explain the finding.
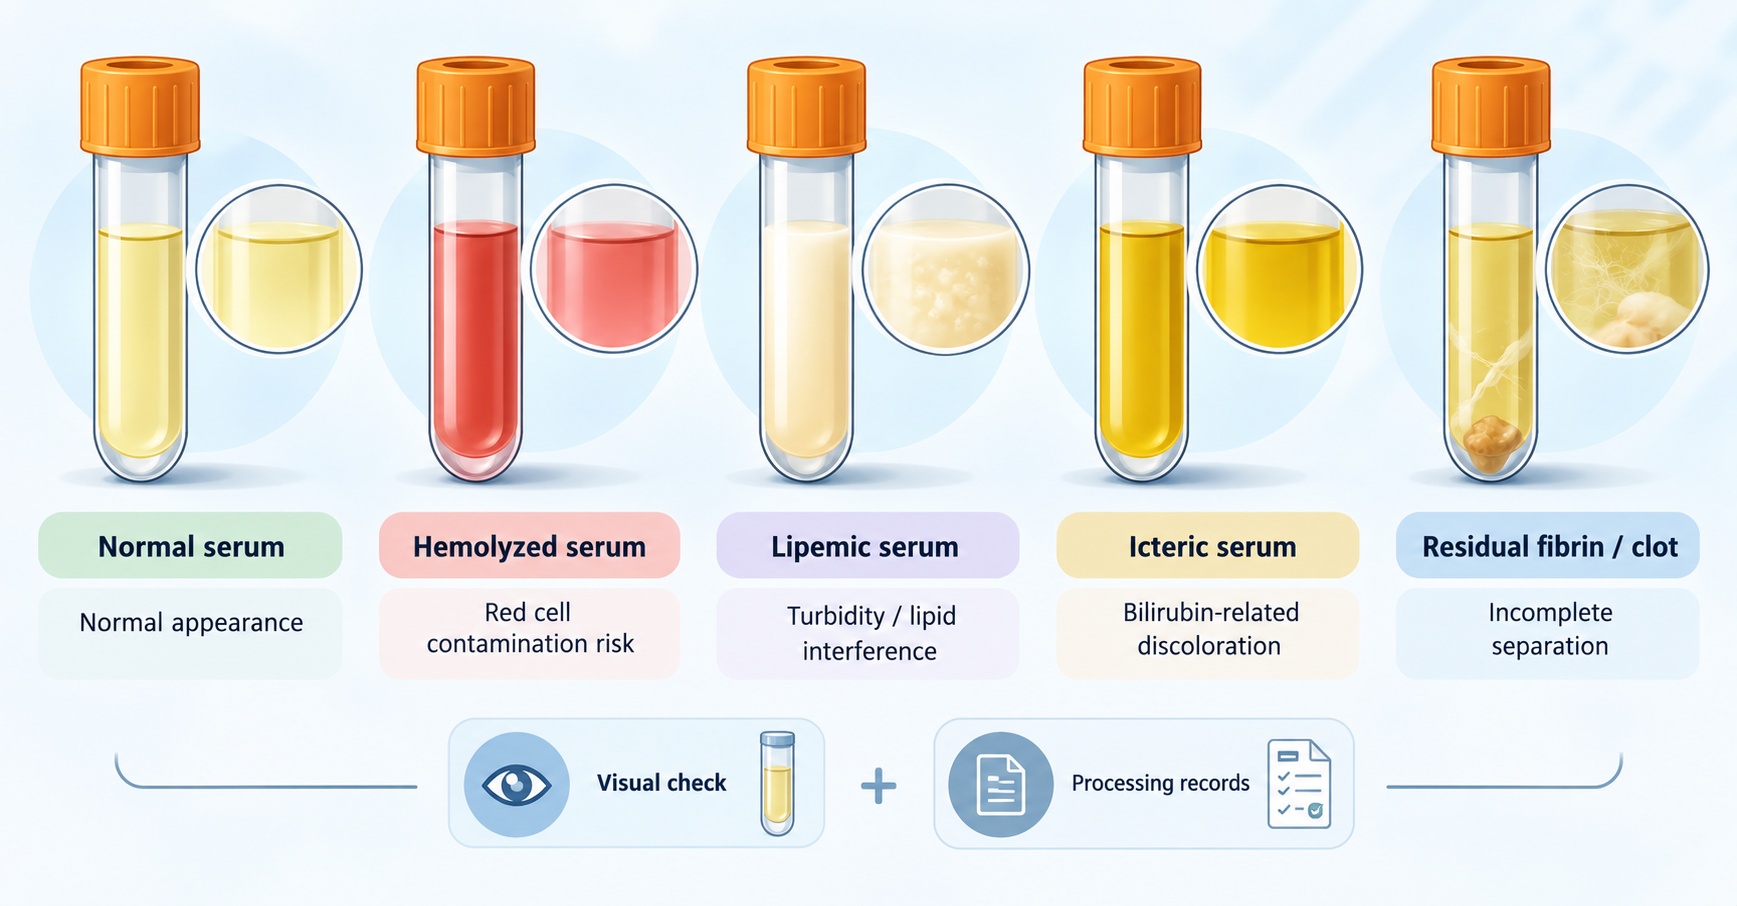
Figure 1. Visual indicators of common serum sample quality issues.
2. Reviewing Preanalytical Records
Review the following preanalytical records when available:
- Collection and separation: collection date and the time between collection and serum separation.
- Storage: documented storage temperature, duration, and any known changes in conditions.
- Freeze-thaw history: the known number of cycles and whether exposure differs among samples.
Link the records to sample IDs and study groups. Missing details should remain unknown rather than be estimated. The key question is whether an abnormality or handling difference is concentrated in particular samples or groups. For collection, separation, storage, and shipping procedures, see Serum Sample Preparation, Storage, and Handling for Proteomics.
Hemolysis and Blood Cell Contamination
Hemolysis releases hemoglobin and other erythrocyte proteins into serum, adding cell-derived proteins to a profile intended to represent circulating serum proteins. These additional proteins can become prominent in identification results and alter the relative signal pattern. The magnitude of the effect depends on the severity of hemolysis and the proteins being measured; visible color alone does not provide a quantitative estimate.
Lipemia, Icterus, and Residual Fibrin
1. Lipemia
Pronounced lipemia can alter the serum matrix and may affect protein recovery or measurement consistency. A lower protein identification count or a changed abundance profile should therefore be interpreted alongside sample appearance and handling records rather than attributed to biology immediately. In studies comparing high-lipid and normal samples, lipemia may also represent the phenotype under investigation. Interpretation should distinguish a study-relevant biological feature from a preanalytical difference that is unevenly distributed across samples.
2. Icterus
Icteric serum is often deep yellow or yellow-brown because of elevated bilirubin. Color is a qualitative indicator and cannot quantify any effect on LC-MS/MS results. In liver or biliary studies, icterus may reflect the biological condition under investigation; interpretation should consider the study question and whether icteric samples are distributed unevenly between groups.
3. Residual Fibrin and Clots
Visible fibrin, clots, or obvious precipitates may indicate incomplete serum separation and introduce differences in sample handling. These findings do not, by themselves, demonstrate protein degradation. Centrifugation may clarify material containing fibrin or small clots. If visible material persists, document the finding and consider whether the affected samples differ from the rest of the cohort, because uneven sample processing can complicate relative-abundance comparisons.
Processing Delays and Freeze-Thaw Effects
1. Delayed Serum Separation
When serum remains in contact with blood cells or the clot for longer than other samples, cellular release and proteolytic activity may change the recovered protein profile. Some protein signals may increase while others become less measurable, so the direction of change cannot be assumed in advance. If separation delays differ between study groups, processing history becomes a potential alternative explanation for apparent differential proteins.
2. Storage Conditions
Differences in storage temperature or duration may affect susceptible proteins through degradation, aggregation, or altered solubility. A lower peptide signal can therefore reflect reduced protein integrity or recovery rather than lower original abundance. Keep storage conditions as consistent as practical and use the recorded history to interpret differences; do not assume that every protein responds to storage in the same way.
3. Repeated Freeze-Thaw Exposure
Repeated cycles may affect the solubility or stability of some serum proteins. Document the freeze-thaw history and, where possible, keep exposure to 2-3 cycles or fewer. When cycle counts are unknown or differ across samples, treat this as a source of uncertainty and assess whether the difference is associated with study group or observed protein patterns.
Effects on Differential Protein Analysis
A quality issue is most likely to confound differential analysis when its type or severity differs systematically between study groups. For example, if visibly hemolyzed samples are concentrated in one group, erythrocyte-derived proteins may appear as differential proteins partly because of sample handling. Similar concerns arise when one group has longer separation delays, more freeze-thaw cycles, or more pronounced lipemia than the other.
Interpreting Differential Proteins with Quality Records
For each candidate protein change, review three lines of evidence:
- Protein pattern: a coordinated increase in several erythrocyte-associated proteins in hemolyzed samples supports a possible contribution from cell-derived material; a change in one protein alone is less conclusive.
- Sample distribution: check whether the affected proteins occur mainly in samples with the same quality concern or in one study group.
- Biological context: the study condition may itself alter circulating proteins, so a quality concern should not automatically be used to dismiss a biological result.
- Increased within-group variability: isolated poor-quality samples can make a real biological difference harder to detect.
- Group-specific bias: if the quality problem is concentrated in one group, the resulting shift may resemble a biological effect.
Statistical significance does not resolve this issue by itself; the sample-quality pattern must be considered before assigning a biological explanation. For study-planning approaches to reduce group-level handling differences, see Comparative Serum Proteomics: Study Design for Differential Protein Analysis.
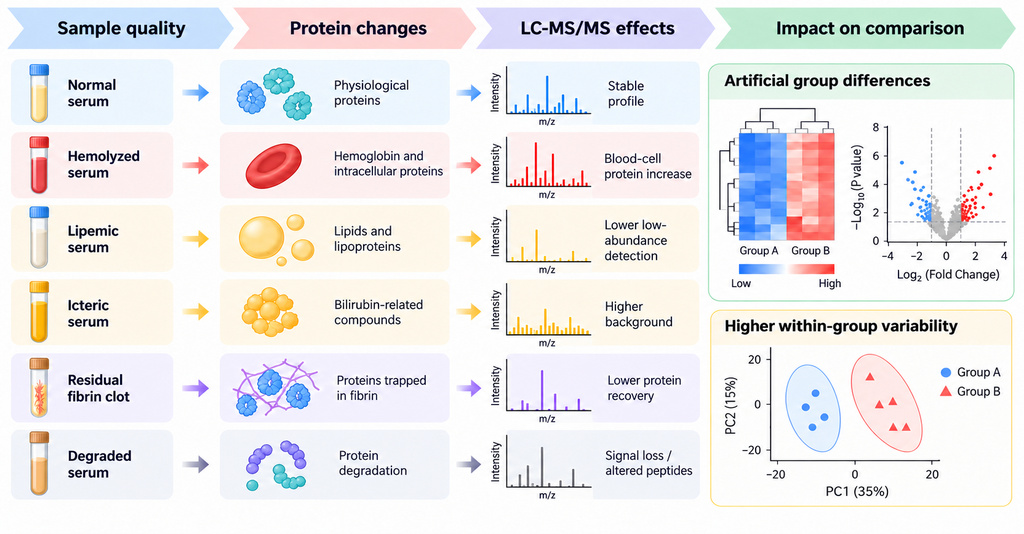
Figure 2. How serum quality differences can affect protein measurements and group comparisons.
Evaluating Serum Sample Suitability
Protein identification and reliable relative quantification are separate outcomes. A sample may produce identifiable proteins while preanalytical differences reduce confidence in relative abundance or group comparisons. Assessing suitability therefore requires considering the observed abnormality, its severity, the study objective, and how the concern is distributed across samples.
|
Sample condition |
Recommended assessment |
|
Mild hemolysis |
Slightly pink serum with free hemoglobin within the normal range (for example, <300 mg/L if measured) is generally acceptable. |
|
Marked hemolysis |
Clearly red or dark-red serum requires prior evaluation before analysis. Recollection may be recommended based on the severity of hemolysis and the study requirements. |
|
Mild lipemia |
Slight turbidity may be accepted. |
|
Marked lipemia |
Severe lipemia requires prior evaluation. Recollection is preferred; analysis may be considered after the risks to protein detection and sample comparability have been explained. Comparisons between high-lipid and normal samples may be considered when lipemia is part of the research question. |
|
Icterus |
Mild yellow coloration may be acceptable. Deep yellow or yellow-brown serum requires prior evaluation; recollection or analysis with acknowledged limitations may be recommended. |
|
Residual fibrin, clots, or obvious precipitates |
Centrifugation may be used to clarify the sample. Persistent visible material requires review before analysis. |
|
Suspected degradation or prolonged room-temperature exposure |
Protein detection and sample comparability may be reduced. Analysis should proceed only after the risk is explained and the client still requests testing. |
The table summarizes practical considerations for common sample conditions. In comparative studies, an individual sample's status does not establish that the full cohort is comparable; the distribution of quality concerns across study groups remains important when interpreting differential proteins.
Frequently Asked Questions
1. Does sample quality affect protein identification and relative quantification in the same way?
Not necessarily. Hemolysis can add erythrocyte proteins that are readily identified, while also changing the relative-abundance profile and complicating comparisons between groups. The two outcomes should be assessed separately rather than assuming that successful identification guarantees reliable quantification.
2. Can normal-looking serum still show preanalytical effects?
Yes. Normal appearance cannot rule out delayed serum separation, storage differences, repeated freeze-thaw exposure, or early degradation. Visual inspection should therefore be interpreted alongside available preanalytical records.
3. Does a quality flag automatically mean that a result is invalid?
A quality flag identifies a potential source of variation; it does not automatically prove that a result is invalid. Consider whether the concern is supported by handling records, whether related proteins show a consistent pattern, and whether the affected samples are concentrated in one group.
4. Does statistical significance rule out a preanalytical explanation?
No. Statistical significance does not identify the source of a protein difference or exclude confounding by sample handling. Review the quality history and the distribution of affected samples before assigning a biological explanation to a significant result.
5. How should sample-quality concerns be documented in a proteomics study?
For transparent reporting, document the following information when available:
- Sample ID, species, and visible appearance.
- Collection and serum-separation records, storage conditions, and known freeze-thaw history.
- Suspected degradation or contamination.
- For comparative studies, the study group for each sample.
Reporting these details allows readers to judge the potential contribution of preanalytical variation to the findings.
Conclusion
How to order?