






How to Interpret Plasma Proteomics Results
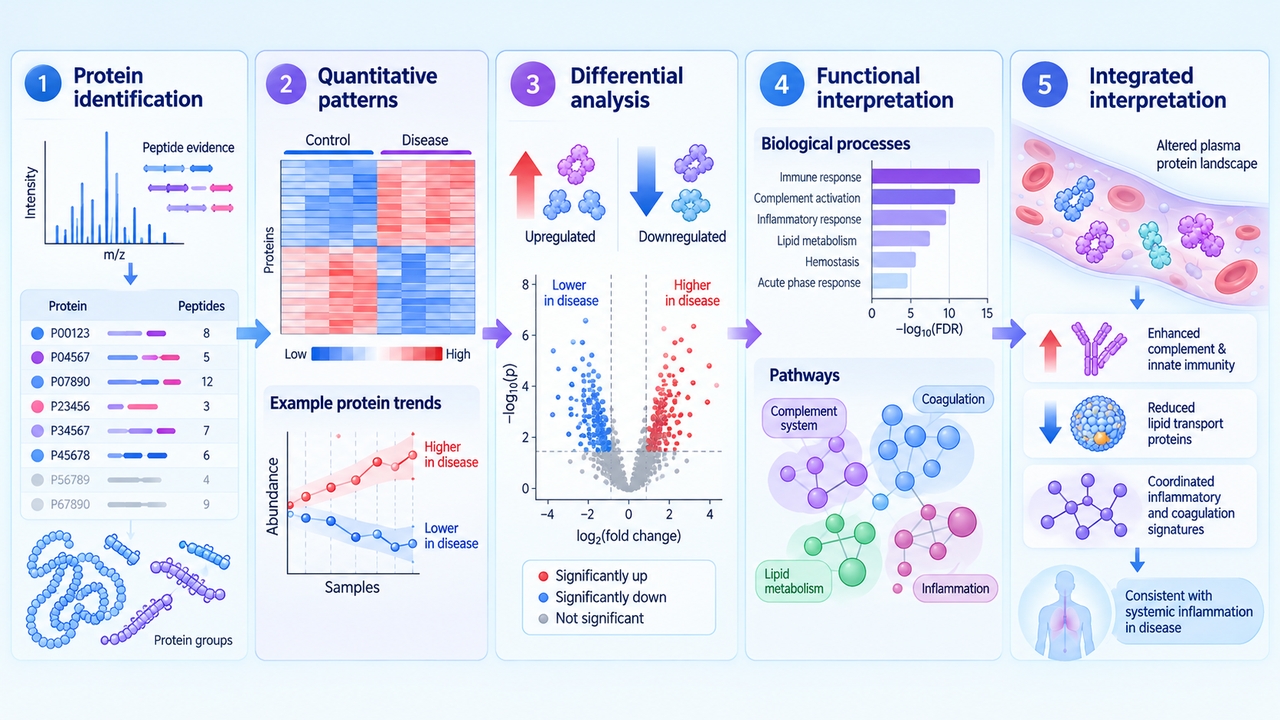
Plasma proteomics analysis generates several types of results, including protein identification, quantitative information, differential protein analysis, and functional annotation. Each result type answers different questions about the detected plasma proteome: protein identification shows which proteins are detected, quantitative analysis describes abundance patterns across samples, and differential analysis highlights proteins with different abundance between experimental groups.
Interpretation is most useful when these layers are read in sequence. Start with the detected proteins and quantitative matrix, review whether abundance patterns are consistent within groups, examine differential proteins for a specific comparison, and then place the changed proteins into functional and network context.
Plasma Proteomics Data Outputs and Result Overview
The main outputs of a plasma proteomics project answer different questions. Reviewing the purpose of each output before interpretation helps avoid treating one result as a complete summary of the study.
| Output type | Main information | Purpose |
| Protein identification results | Detected proteins and annotation information | Describe detected protein composition and provide annotation information for subsequent quantitative and functional analysis |
| Quantitative matrix | Relative abundance values of detected proteins across samples | Evaluate protein abundance patterns and compare changes between samples or experimental groups |
| Differential protein results | Proteins showing significant abundance differences between defined groups | Identify proteins associated with specific experimental comparisons |
| Functional analysis results | Functional enrichment and protein relationship information | Summarize biological categories and functional patterns associated with detected or differential proteins |
| Quality control information | Data quality-related metrics | Provide basic metrics related to the quality assessment of generated proteomics data |
| Raw data files | Original mass spectrometry data | Preserve original measurement information for reference or further analysis |
| Analysis report | Integrated summary of identification, quantification, statistical analysis, and interpretation results | Organize major analysis outputs for result review and interpretation |
The generation and interpretation of plasma proteomics results are closely related to the analytical workflow. More information about sample processing, quality control, and LC-MS/MS analysis can be found in Plasma Proteomics Workflow: Sample Processing and LC-MS/MS Analysis.
Protein Quantification and Expression Profile Interpretation
Protein quantification results describe the relative abundance of detected proteins across plasma samples. The quantitative matrix records abundance values for each identified protein in individual samples or experimental groups and provides the basis for evaluating protein expression profiles.
| Quantitative information | Interpretation |
| Protein abundance value | Reflects the relative abundance level of a detected protein within the plasma proteomics dataset |
| Expression trend across samples | Shows whether protein abundance remains consistent, varies among individual samples, or follows a specific change pattern |
| Comparison between experimental groups | Evaluates differences in relative protein abundance between groups, such as control and treatment groups or different biological conditions |
By comparing abundance values across samples, the quantitative matrix can show whether individual proteins remain relatively stable or display different abundance patterns among samples and experimental groups. For proteins showing different abundance trends, quantitative results can indicate whether the changes are consistent within a group or vary across individual samples.
Plasma proteomics quantification mainly reflects relative abundance differences within the analyzed dataset rather than absolute protein concentration. Quantitative comparison provides the foundation for identifying proteins with different abundance patterns and supports subsequent differential protein analysis.
Differential Protein Analysis and Comparison Results
1. Differential Proteins
Differential proteins are proteins showing significant relative abundance differences between predefined experimental groups. Based on the quantitative matrix, protein abundance values from different groups are compared to identify proteins with increased or decreased abundance patterns under specific experimental conditions. The differential protein results typically include protein identifiers, abundance changes, and comparison information, allowing researchers to review which proteins contribute to differences observed between groups. Differential protein results are commonly used as the input for functional annotation and pathway analysis.
2. Statistical Comparison
Statistical comparison evaluates whether observed protein abundance differences between experimental groups represent consistent changes within the analyzed dataset. The comparison results are commonly presented with statistical information and visualization outputs, such as volcano plots and heatmaps, which help illustrate the distribution of differential proteins and their abundance patterns across samples. Interpretation of statistical comparison results should be based on the experimental design and comparison groups, as statistical differences describe changes in protein abundance rather than directly demonstrating biological mechanisms.
Factors affecting plasma proteomics results, including aspects influencing data consistency and result interpretation, are discussed in Factors Affecting Plasma Proteomics Results.
Functional Annotation and Pathway Analysis of Plasma Proteomics Results
1. Functional Annotation
Functional annotation links identified proteins with known biological information and summarizes their functional characteristics. GO annotation commonly classifies proteins according to biological process, molecular function, and cellular component, allowing researchers to evaluate the functional distribution of identified or differential protein sets. In plasma proteomics analysis, functional annotation helps organize protein-level results into broader functional categories, making it easier to identify which biological functions are represented among detected proteins or proteins showing abundance changes.
2. Functional Enrichment and Pathway Analysis
Functional enrichment analysis evaluates whether specific functional categories are represented more frequently within a selected protein set compared with the expected background distribution. KEGG pathway analysis further groups proteins according to known pathway information and helps identify pathways associated with detected or differential proteins. In plasma proteomics interpretation, enrichment and pathway analysis are commonly combined with protein abundance changes and differential protein results to summarize functional patterns associated with experimental comparisons. These analyses indicate statistical associations between protein groups and functional categories, while biological mechanisms require additional experimental evidence.
Integrated Interpretation of Plasma Proteomics Data
1. Protein Changes
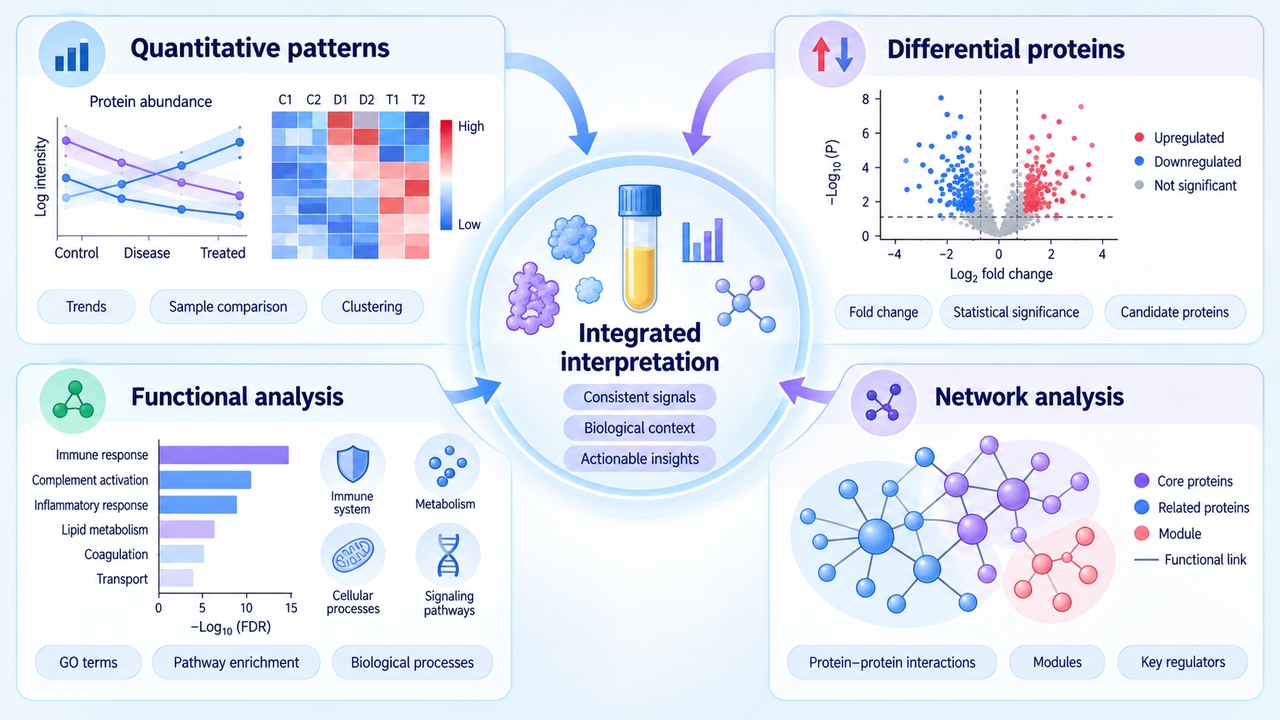
Protein changes describe differences in relative abundance observed among detected proteins between experimental groups or sample conditions. Differential protein results show which proteins have increased or decreased abundance and whether multiple proteins exhibit similar or opposite change trends across groups. During result interpretation, protein abundance changes are usually evaluated together with quantitative profiles to determine whether observed changes represent consistent patterns among related proteins or individual variation within the dataset.
2. Functional Analysis
Functional analysis connects protein-level changes with biological categories by analyzing groups of identified or differential proteins. GO annotation summarizes proteins according to biological process, molecular function, and cellular component, while pathway analysis groups related proteins based on known pathway information. When differential proteins are enriched in specific functional categories or pathways, functional analysis can help identify the major biological themes represented by the changed protein set.
The interpretation of plasma proteomics findings can be further connected with different research applications, including comparative studies and biological response analysis, as discussed in Research Applications of Plasma Proteomics.
3. Network Analysis
Network analysis evaluates relationships among identified or differential proteins based on available protein interaction information. Protein networks can group proteins according to reported interaction relationships and show whether multiple differential proteins are connected within the same network module. Combined with differential protein and functional analysis results, network analysis helps researchers examine relationships among changed proteins and prioritize protein groups for further investigation.
Frequently Asked Questions
1. Can protein identification numbers be directly compared between different plasma proteomics projects?
Direct comparison requires caution because identification depth depends on sample preparation, acquisition strategy, instrument performance, database settings, and data-processing criteria. Identification numbers are most meaningful within projects that use comparable analytical conditions.
2. Why can the same protein show different quantitative results in different comparisons?
Each comparison uses a different set of groups or conditions. A protein may change in one contrast but remain stable in another, especially when biological background, treatment condition, or comparison baseline differs.
3. Should all identified proteins be included in downstream functional analysis?
The protein set should match the analytical question. Functional annotation may use the full identified set, whereas enrichment or pathway analysis often focuses on a defined subset such as differential proteins or proteins meeting study-specific criteria.
4. How should proteins with inconsistent trends among biological replicates be reviewed?
Review the individual abundance values, sample grouping, and quality-control information before assigning biological importance. Large within-group variation can weaken the interpretation of a group-level difference and may indicate the need for additional review.
5. What information should be prioritized when selecting proteins for follow-up validation?
Selection usually considers change magnitude, statistical support, consistency across samples, functional relevance, pathway or network context, and the original research objective. The final priority depends on the purpose of the follow-up study.
Conclusion
Plasma proteomics interpretation moves from detected proteins and relative abundance profiles to comparison-specific differential evidence and functional context. Reading the quantitative matrix, differential results, functional analysis, and network information together provides a clearer view of the protein changes represented in the study.
For a broader understanding of plasma proteomics study design and analysis framework, explore Plasma Proteomics: Workflow, Sample Requirements, and Research Applications and related topic pages covering sample characteristics, analytical workflow, and research applications. MtoZ Biolabs provides plasma proteomics analysis services for researchers who need further evaluation of project requirements, data interpretation, or analysis strategies. Specific project planning can be discussed through the Plasma Proteomics Analysis Service or Contact Us.
How to order?




