


Resources
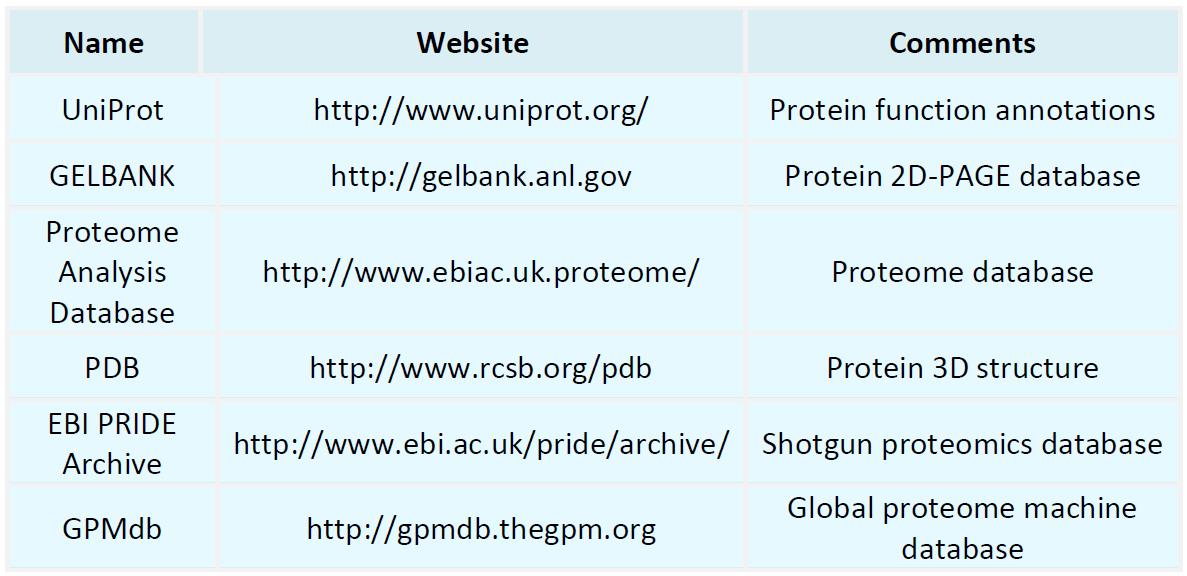
Proteomics Databases
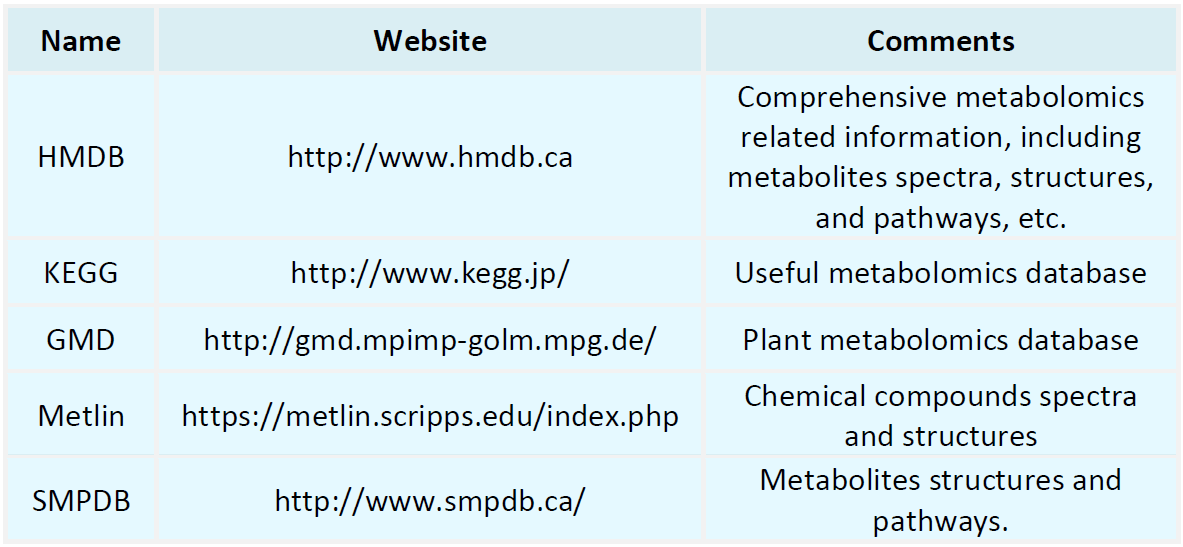
Metabolomics Databases
-
• Protein Analysis Using Liquid/Gas Chromatography-Mass Spectrometry
Mass spectrometry is a powerful analytical technique used to determine the mass, chemical structure, and purity of a sample. In biological research, it is widely employed for the identification of proteins and other macromolecules. By providing detailed structural and compositional information, mass spectrometry plays a crucial role in advancing our understanding of these complex biomolecules.
-
• Naming of Gene Knockout Cell Lines
In molecular biology, gene knockout is an experimental technique used to disable the function of a specific gene in an organism through genetic engineering. This method is valuable for investigating the roles of particular genes and their potential links to diseases. In cell culture, gene knockout cell lines are created by genetically engineering cells to inactivate specific genes. These cell lines serve as powerful tools for studying disease mechanisms, drug screening, and understanding gene functions.
-
• Immunoprecipitation Mass Spectrometry Protocol
Immunoprecipitation Mass Spectrometry (IP-MS) is a widely used technique for identifying protein-protein interactions, integrating immunoprecipitation with mass spectrometry-based proteomic analysis. 1. Sample Preparation: Protein extraction is performed from cells or tissues by lysing the samples with an appropriate lysis buffer, such as radioimmunoprecipitation assay (RIPA) buffer, followed by centrifugation to remove cell debris and isolate soluble proteins.
-
• Protein Extraction for TMT/iTRAQ
In biomedical research, proteomics is a critical field that focuses on the large-scale study of proteins. Among the widely used protein quantification techniques, Tandem Mass Tag (TMT) and Isobaric Tags for Relative and Absolute Quantitation (iTRAQ) allow for precise protein quantification and large-scale protein sample analysis. Principles of TMT and iTRAQ: Both TMT and iTRAQ are isotope-labeling techniques for protein quantification. These methods involve the attachment of isotope tags to peptides........
-
ADC (Antibody-Drug Conjugate) is an innovative targeted therapeutic agent that selectively eliminates tumor cells through the specific binding of antibodies and the potent cytotoxic effect of the conjugated drug. The pharmacokinetic (PK) analysis of ADC is crucial for elucidating its distribution, metabolism, and excretion within the body, thereby informing and optimizing its clinical application.
-
• Shotgun Quantitative Proteomics
Proteomics, the large-scale study of proteins, examines protein expression, modifications, interactions, and functions through specific experimental designs and techniques. With advances in mass spectrometry, quantitative proteomics has become a pivotal research area. Specifically, shotgun quantitative proteomics—a novel biochemical analysis method—offers new perspectives on the complexities of biological systems due to its high efficiency, precision, and comprehensive nature.
-
• The Ellipticity Value of the Circular Dichroism Spectrum Is Less Than 1
Ellipticity in Circular Dichroism (CD Ellipticity) quantifies the differential absorption of left- and right-handed circularly polarized light by optically active molecules. This parameter is widely used in the study of secondary structures in proteins and nucleic acids. Definition of Ellipticity: The ellipticity (θ) is expressed in degrees and represents the extent of circular dichroism in an optically active sample. If a substance absorbs left- and right-handed circularly polarized light equally, then....
-
• Hydrogen Deuterium Exchange Mass Spectrometry Results Analysis
Hydrogen Deuterium Exchange Mass Spectrometry (HDX-MS) is a valuable technique for identifying key dynamic regions within biomolecules. By measuring the rate of hydrogen-deuterium exchange, HDX-MS provides insights into whether specific regions are exposed or interact with other molecular domains. Principle: The underlying principle of HDX-MS is the exchange reaction between hydrogen and deuterium, where a hydrogen atom in a biomolecule is substituted by a deuterium atom. This substitution is detectable....
-
• How to Master Protein Identification for Precise Biomarker Discovery
Protein identification technologies are essential for the discovery, validation, and application of biomarkers. Biomarkers are biomolecules that indicate biological process states, disease progression, or drug responses. Among them, proteins, due to their essential roles in biological processes, represent a biomarker class with significant potential for clinical translation. Precise biomarker analysis relies on efficient and accurate protein identification techniques to ensure that identified proteins......
-
• Protein Identification: 12 Common Mistakes to Avoid
Protein identification is a crucial step in proteomics research. By precisely analyzing and identifying proteins within a sample, scientists can elucidate the fundamental roles of proteins in cellular function, disease mechanisms, and drug development, among other areas of biological research. However, due to the technical complexity and sample variability, protein identification often presents significant challenges. In this article, we summarize 12 common mistakes encountered during protein .......
How to order?

