


How to Analyze PhIP-Seq Data: From Peptide Enrichment to Antibody Signature Interpretation
- Peptide Array-Based Epitope Mapping Service
- Antibody-Antigen Interactions Characterization Service | HDX-MS
- Antibody-Antigen Complexes Structure Characterization Service
PhIP-Seq count data is easiest to trust when it is handled as staged evidence: check sequencing and library quality, normalize for sequencing depth and input library abundance, subtract background with mock-IP or negative controls, call enriched peptides with stated thresholds, map peptides to antigens, and then interpret antibody signatures at the sample or cohort level. The strongest findings are rarely the peptides with the biggest raw read counts. They are the signals that survive background correction, fit the antigen annotation, recur in the right samples, and are realistic candidates for orthogonal validation.
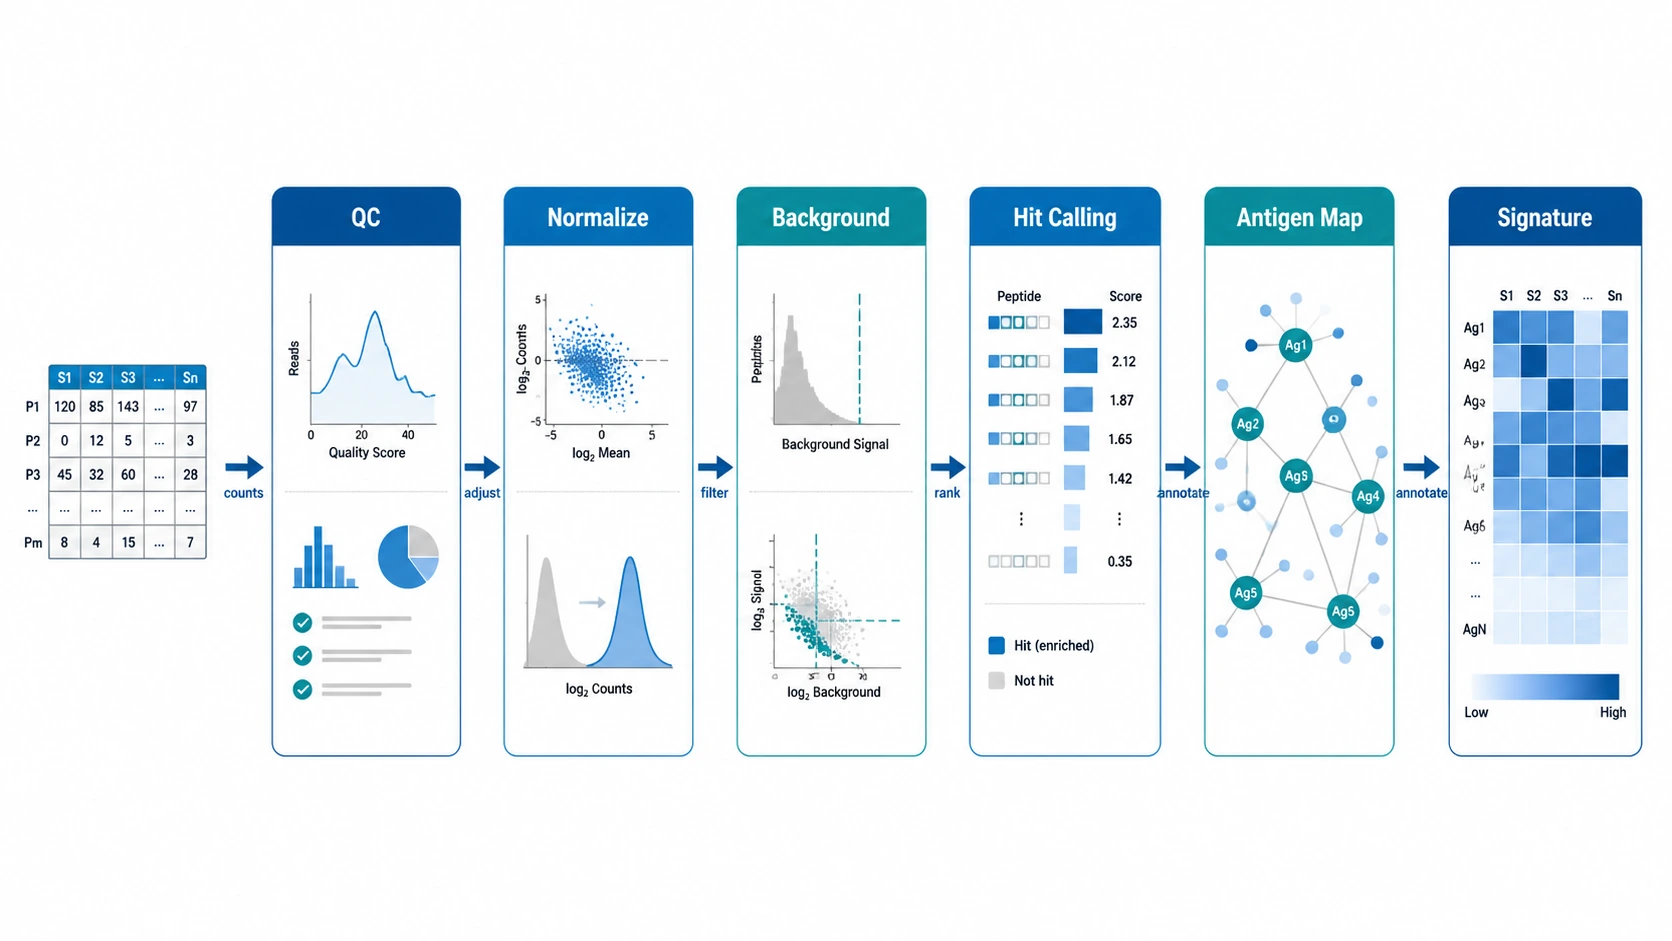
A practical PhIP-Seq analysis workflow links technical enrichment, biological mapping, and study-context interpretation. A peptide with high reads may be common in the input library, recurrent in beads-only controls, or a one-off event in an unrelated sample. Multiple adjacent or overlapping peptides that map to the same antigen region, agree across replicates, and separate case-control groups carry more weight.
The Practical Pain Point: Enriched Peptide Lists Are Not Self-Interpreting
Phage immunoprecipitation sequencing, or PhIP-Seq, combines a phage-displayed peptide library, antibody binding, immunoprecipitation, and next-generation sequencing. After sequencing, teams usually receive a count matrix for thousands to millions of peptides across serum or plasma samples. The dataset may include IP samples, an input library, mock-IP controls, negative controls, and technical or biological replicates.
Processed tables may report fold enrichment, log2 enrichment, z-score, p-value, false discovery rate, and preliminary hit calls. Interpretation is the hard part. A team may have a long peptide list, clustered heatmaps, and volcano plots, yet still need to decide which peptides reflect antibody binding, which antigens deserve attention, and which findings are ready for validation planning.
The pressure is different for each reader. Bioinformatics scientists need thresholds they can defend. Immunology teams need antigen-level meaning, not just peptide IDs. Translational leads need ranked follow-up candidates. Service buyers need to know whether a report supports an internal decision or more experimental design.
Why PhIP-Seq Results Become Difficult to Interpret
Input Library Abundance Can Distort Raw Counts
Sequencing read counts reflect peptide-encoding phage abundance after selection, but they also carry the starting abundance of each clone in the library. A high-count peptide may simply have started high. Input-adjusted normalization should happen before biological interpretation.
Background Binding Can Create Recurrent Artifacts
Sticky peptides, bead-associated enrichment, phage propagation bias, and nonspecific IP can look like real hits. Mock-IP samples, beads-only controls, negative control sera, and baseline sample distributions help expose that behavior. They will not remove every artifact, but they reduce the risk of calling nonspecific binders antigen-specific.
Library Representation and Peptide Dropout Limit Coverage
No peptide library gives equal usable coverage for every sequence. Some peptides have low input abundance, unstable representation, or dropout. Treat hits from weakly represented regions cautiously. Also, missing signal in one region does not prove absence of antibody binding.
Peptide-Level Hits Need Biological Context
An enriched peptide becomes more interpretable once antigen annotation and peptide-to-protein mapping connect it to a protein, pathogen antigen, autoantigen, allergen, tumor-associated antigen, or custom library target. A single isolated peptide is weaker than a cluster of adjacent or overlapping peptides pointing to a plausible linear epitope region.
Cohort Signals Require Pattern-Level Evidence
An antibody signature is not a top-peptide list. It is a reproducible pattern across samples, time points, or study groups. In case-control work, review hit prevalence, effect size, group separation, replicate concordance, and batch behavior before presenting a peptide or antigen as a cohort-level signature.
Related Services
Main Service
Supporting Services
Validation Services
A Workflow-Optimization Guide for PhIP-Seq Data Analysis
Step 1: Define the Interpretation Bottleneck
Start with the decision that is stuck. Too many peptide hits? Weak case-control separation? Replicates that disagree? Poor antigen annotation? Unclear validation candidates? The answer tells you where the workflow needs work.
Inputs should include the count matrix, sample metadata, library design file, input library counts, control labels, batch information, and intended comparison. This step is done when the team can name the required output: enriched peptide ranking, antigen-level aggregation, antibody repertoire comparison, cohort signature analysis, or validation candidate selection.
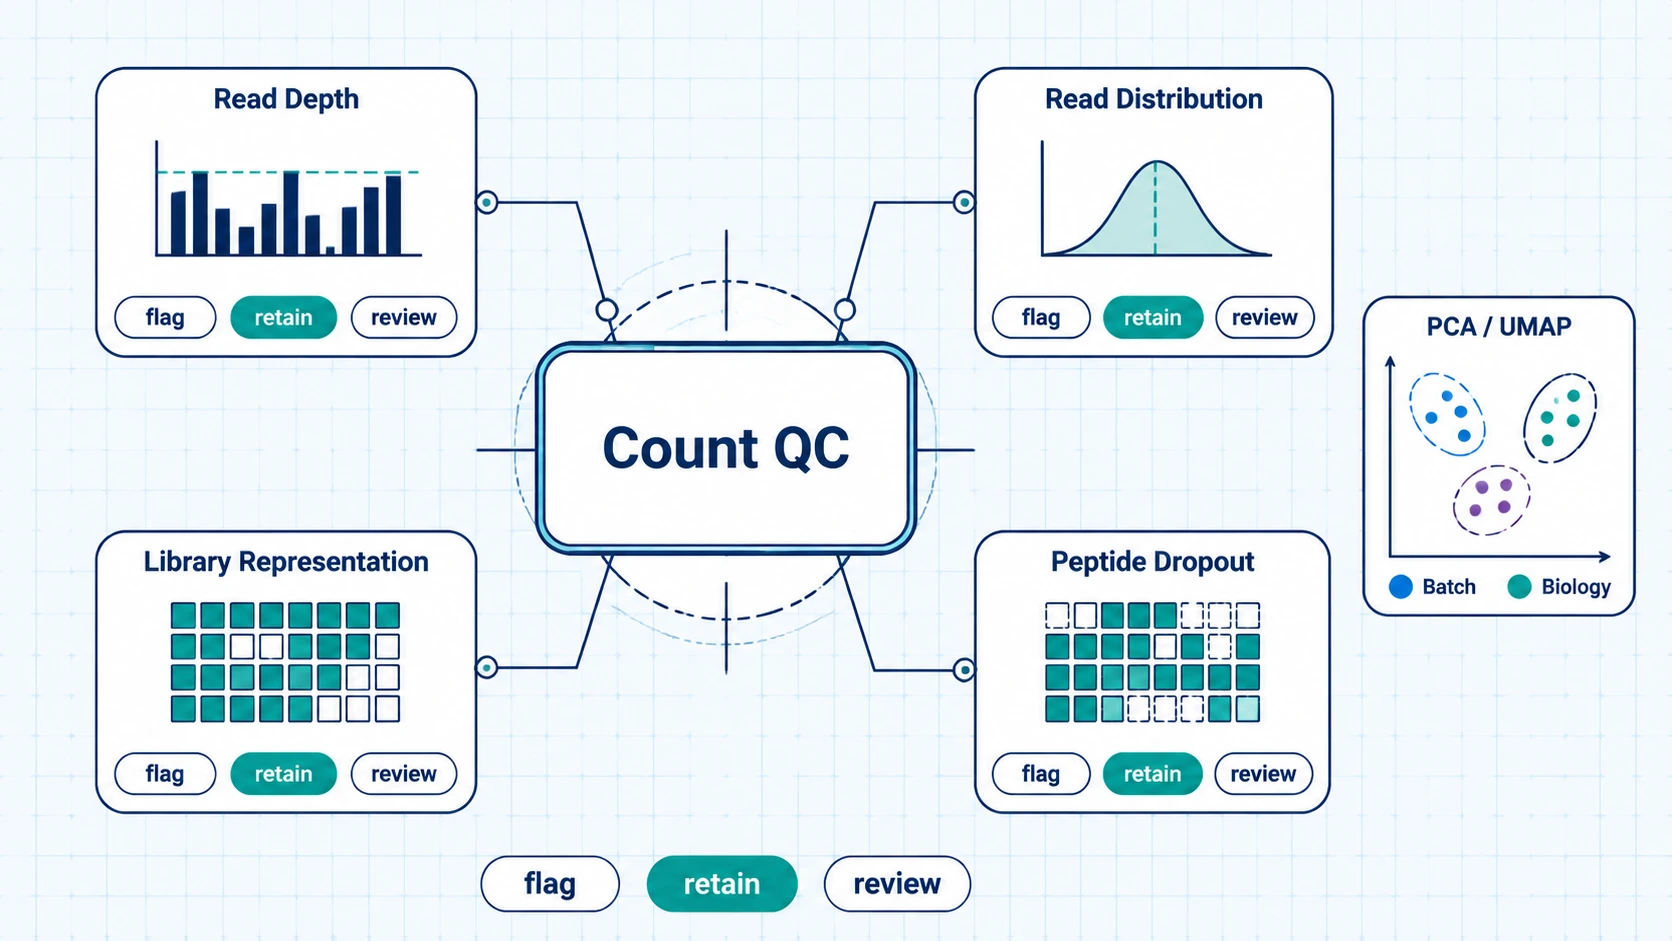
Step 2: Review Count-Level QC and Library Behavior
Before enrichment scoring, inspect total reads per sample, sample-level read distribution, library representation, and peptide dropout. Low-depth samples, abnormal count composition, or broad dropout can distort normalization and hit calling. PCA, UMAP, or clustering can show whether samples group by biology, sequencing run, plate position, or processing batch.
Input library abundance needs a close look. Peptides with insufficient input representation may need filtering or confidence labels in the report. This step is complete when low-confidence samples and peptides are flagged and the retained data can support the intended comparison.
Step 3: Normalize Against Sequencing Depth and Input Library Behavior
Normalization should address total read differences between samples and starting peptide abundance in the input library. Outputs may include normalized counts, fold enrichment, log2 enrichment, or model-derived enrichment scores. The goal is not to make samples artificially similar. It is to make enrichment estimates comparable enough for statistical review.
Document whether normalization uses total count scaling, input-adjusted ratios, control-based baselines, or model-based methods. A normalized result is ready for hit calling when high-input peptides no longer dominate simply because they started high in the library.
Step 4: Correct Background Before Calling Antibody-Binding Hits
Use mock-IP controls, negative controls, beads-only controls, or control group distributions to estimate background. Background correction should down-weight peptides that recur across unrelated samples, controls, or technical artifacts. For large libraries, statistical testing also needs p-value adjustment or false discovery rate control.
Peptide enrichment may be summarized with fold enrichment, log2 enrichment, z-score, robust z-score, p-value, or false discovery rate. No single threshold fits every PhIP-Seq design, so the report should state the threshold logic and show control behavior. This step is complete when credible enriched peptides are separated from recurrent background signals.
Step 5: Map Enriched Peptides to Antigens and Epitope-Like Regions
After hit calling, connect peptide IDs to biological targets through antigen annotation and peptide-to-protein mapping. Check whether peptides map uniquely or ambiguously, whether they overlap known protein regions, and whether adjacent or overlapping peptides support a linear epitope interpretation.
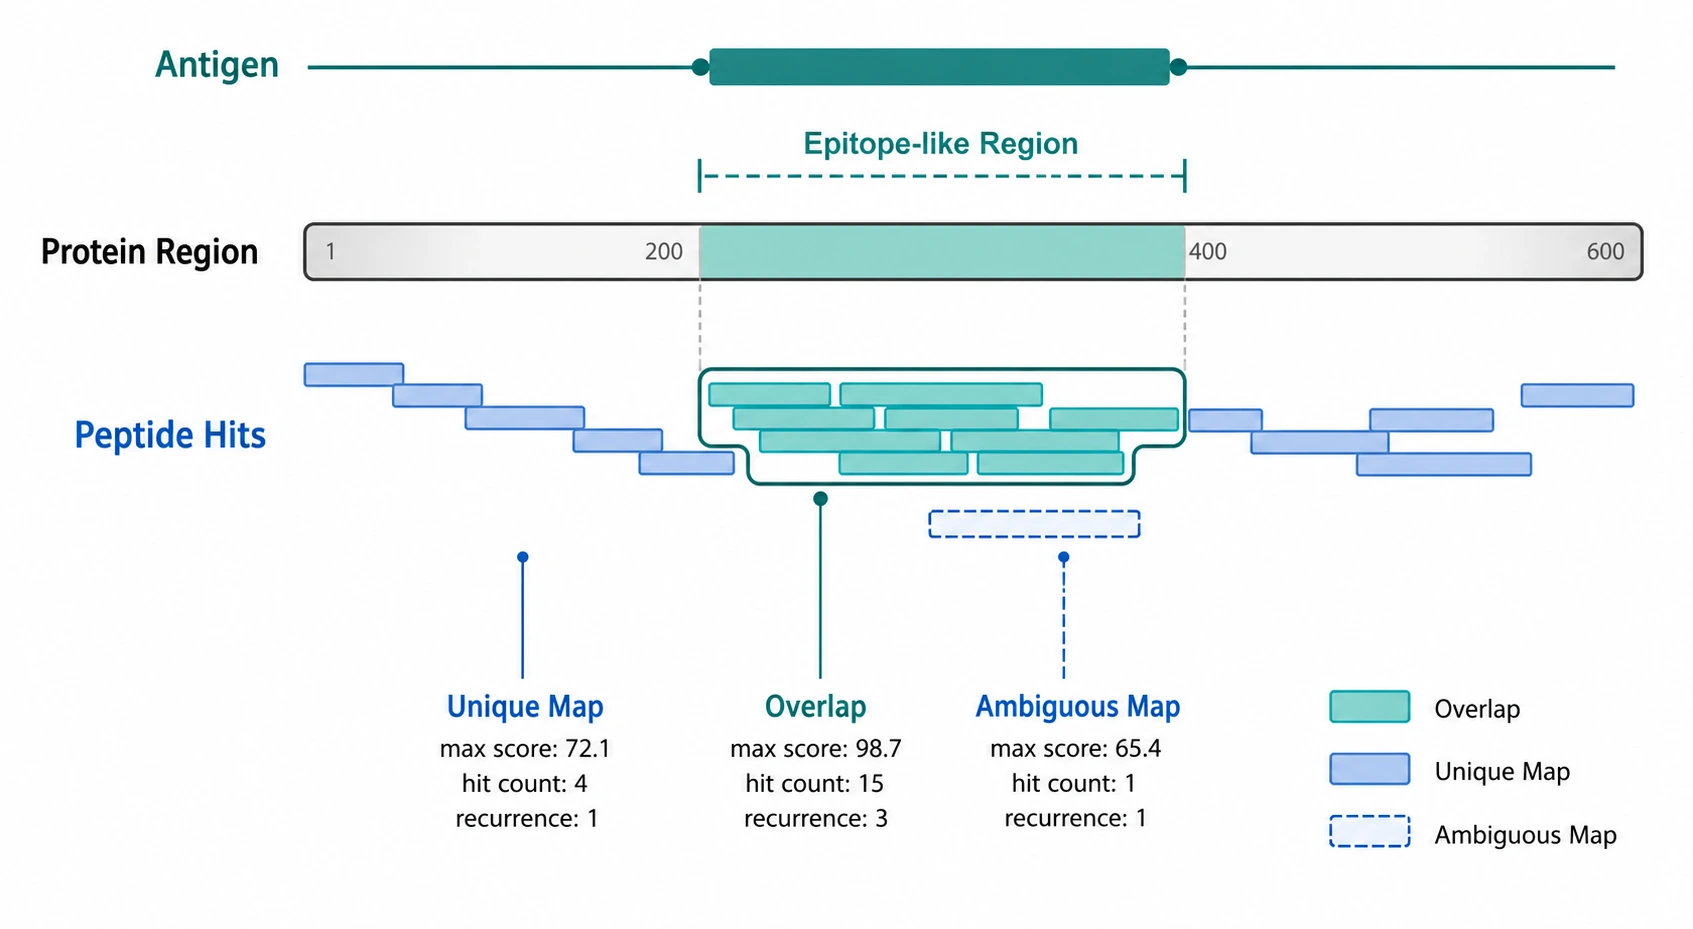
Antigen-level aggregation can combine multiple peptide signals linked to the same protein or target. Useful summaries include enriched peptide count per antigen, maximum enrichment score, median log2 enrichment, recurrence across samples, and consistency across adjacent peptide windows. If your team needs count matrix processing, annotated peptide enrichment tables, or ranked antigen reports, contact MtoZ Biolabs to submit your requirements and evaluate your project with a PhIP-Seq analysis team.
Step 6: Convert Peptide Hits Into Antibody Signature Patterns
For cohort comparison, ask whether enriched peptides or antigen-level scores recur in the biologically relevant group. Review case-control enrichment frequency, hit prevalence, effect size, sample clustering, and signature score behavior. Heatmaps show recurring patterns. Volcano plots summarize differential enrichment. Clustered peptide matrices can reveal sample similarity, or sometimes a batch problem hiding in plain sight.
A candidate antibody signature needs more than statistical visibility. It should show reproducibility, biological plausibility, and a path to validation. Longitudinal or treatment-response studies also need time-point-aware interpretation, since transient antibody-binding patterns may not behave like stable exposure-associated signatures.
Step 7: Build Validation-Oriented Reports
Final reports should separate technical QC, peptide-level enrichment, antigen-level aggregation, cohort patterns, and validation priorities. Candidate ranking should weigh effect size, recurrence, antigen relevance, mapping confidence, control behavior, and assay feasibility.
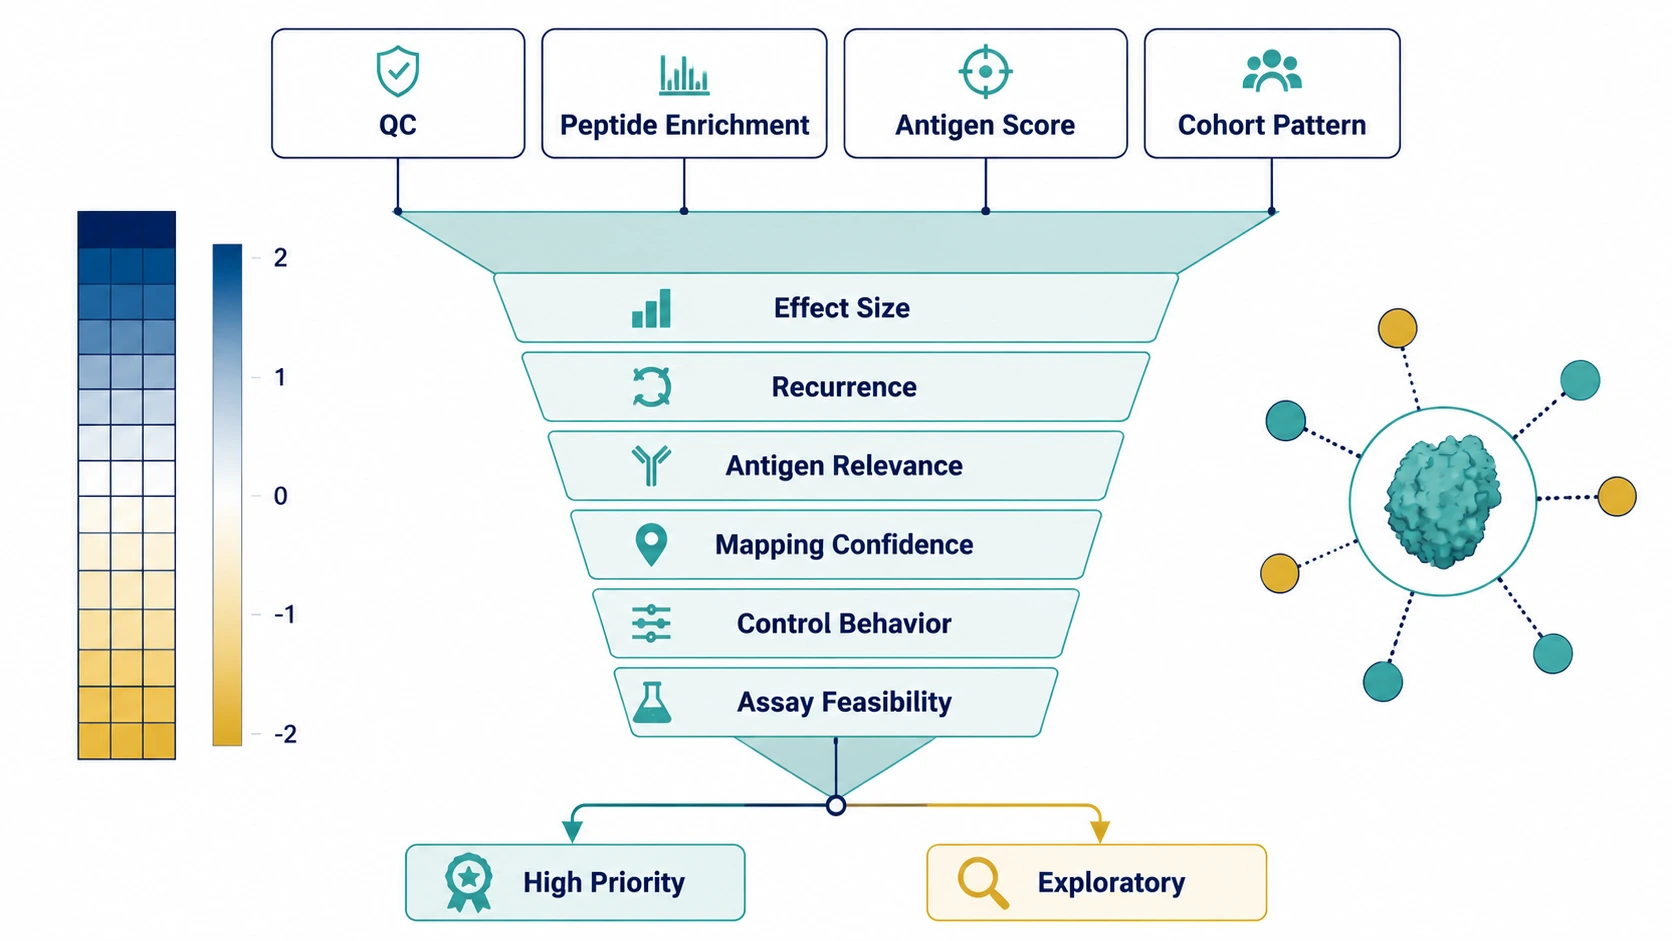
Orthogonal validation may use ELISA, peptide array, western blot, bead-based immunoassay, targeted antibody assays, HDX-MS, or structural characterization. The right follow-up depends on whether the question involves linear peptide recognition, protein-level binding, conformational epitopes, or interaction sites. This step is complete when readers can tell which findings are ready for follow-up and which remain exploratory.
Expected Results and How to Verify Them
A structured PhIP-Seq analysis workflow should reduce misleading peptide hits and improve confidence in the candidates that remain. Near-term gains include clearer QC flags, fewer control-associated artifacts, cleaner separation between input-driven abundance and antibody-mediated enrichment, and more transparent hit calling.
Use concrete checks. Sample-level read distributions should be consistent enough for comparison after failed samples are removed. Replicate concordance should improve once background-driven peptides are filtered. Heatmap clustering should align more with known sample groups than batch labels when true group structure exists. Case-control analysis should show whether enriched peptides recur within the target group rather than appearing as isolated high-score events.
Biological validation needs separate evidence. Antigen-level aggregation scores should be compared with known biology, adjacent peptide support, and feasible follow-up assays. Orthogonal validation can test whether selected targets show antibody binding in another format, although it may not reproduce every PhIP-Seq signal because assay format, peptide length, protein folding, and antibody accessibility differ.
Key Cautions Before Final Interpretation
Sample condition and volume affect PhIP-Seq results. Hemolysis, low immunoglobulin content, freeze-thaw history, or limited serum volume can change IP behavior and may restrict repeat testing.
Control and replicate design shape interpretation. Input library controls support abundance correction. Mock-IP and negative control samples support background correction. Biological replicates strengthen cohort claims, but they add cost, sequencing load, and sample consumption.
Batch effects can mimic biology. Processing date, library batch, sequencing run, and plate layout should be reviewed before clustering or case-control separation is described as an antibody signature.
PhIP-Seq supports broad peptide-level antibody profiling, especially for linear epitope discovery. It may miss conformational epitopes that require native protein structure. Enrichment also does not equal absolute antibody concentration unless a quantitative assay is calibrated for that purpose.
Method switching makes sense when the research question changes. Protein arrays may fit folded protein recognition questions better, while peptide arrays may suit targeted epitope validation. Structural or interaction-site assays are better matched to binding geometry, conformational recognition, or antigen-antibody interface questions.
Conclusion
PhIP-Seq data analysis works best when peptide enrichment is treated as an evidence-building process, not a ranked list of raw counts. Review library representation and sequencing depth, normalize against input library behavior, correct background with controls, call enriched peptides with documented thresholds, map peptides to antigens, and interpret antibody signatures only when the patterns are reproducible and biologically plausible.
This workflow fits antibody profiling studies that compare serum or plasma samples across exposure, infection, vaccine, autoimmune, allergy, oncology, or custom antigen-library contexts. If your project requires count matrix processing, peptide enrichment review, antigen annotation, cohort-level interpretation, or validation planning, contact MtoZ Biolabs to discuss which PhIP-Seq analysis outputs would support your next decision.
FAQ
What files are usually needed for PhIP-Seq analysis?
Core files include the peptide count matrix, sample metadata, peptide library annotation, input library counts, control sample labels, and batch information. Replicate labels, batch maps, and prior antigen annotations make interpretation more defensible.
Can I analyze PhIP-Seq results by ranking peptides by raw read count?
No. Raw read counts can reflect input library abundance, sequencing depth, or nonspecific enrichment. Rank candidates after normalization, background correction, and control review.
Is a single enriched peptide enough to define an antigen hit?
A single enriched peptide can be a candidate, but it is weaker than multiple adjacent or overlapping enriched peptides mapping to the same antigen region. Mapping confidence and background behavior should guide interpretation.
Which visualization is most useful for reviewing antibody signatures?
Heatmaps are useful for recurring peptide or antigen patterns across samples. Volcano plots, PCA, UMAP, clustering, and antigen-level summary plots add context for cohort comparison and batch review.
When should PhIP-Seq findings move to orthogonal validation?
Prioritize findings with strong enrichment, recurrence across relevant samples, low control background, plausible antigen annotation, and feasible assay design. Validation choice depends on whether the target is a peptide, protein, epitope region, or antibody-antigen interface.
Can PhIP-Seq replace ELISA or protein-based antibody assays?
No. PhIP-Seq is a discovery and profiling method for peptide-level antibody binding patterns. ELISA, peptide arrays, protein arrays, western blot, or other assays may be needed to confirm selected findings in a targeted format.
How to order?

