


Antibody-Antigen Interactions Characterization Service | HDX-MS
Monoclonal antibodies (mAbs) are powerful therapeutic tools. These glycoproteins, belonging to the immunoglobulin (Ig) family, are utilized by the immune system to identify and neutralize foreign organisms or antigens. Ig’s are classified in five groups, IgA, IgD, IgE, IgG, and IgM (as α, δ, ε, γ, and μ), based on the structure of their constant regions. Among these, IgG subtypes—predominantly used in approved therapeutic mAbs—are distinguished by their "Y" shaped structure, comprising two identical heavy and light chains linked by disulfide bonds. Each heavy chain contains one variable region (VH) and three constant regions (CH1, CH2, and CH3), while each light chain contains one variable region (VL) and one constant region (CL). IgGs can be further classified into four groups, IgG1, 2, 3, and IgG4 (as γ-1, γ-2, γ-3, and γ-4) on the basis of different patterns of inter-chain disulfide bonds and heavy-chain sequences. IgG1, 2, and 4 are widely used in therapeutics, whereas IgG3, which has a shorter serum half-life, is rarely used. Unlike small-molecule drugs (150-600 Da) that have rigid structures, mAbs (~150 kDa) are engineered proteins that undergo complicated folding and can exist in many low-energy structures, posing a challenge for traditional methods in structural biology.
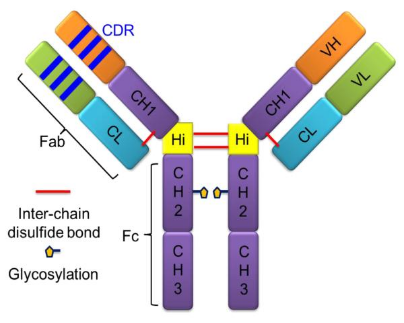
Figure 1. mAbs Structure [4]
Exploring the conformation of antibodies, particularly those with therapeutic value, is profoundly insightful. Many conventional techniques for probing protein conformation encounter challenges when applied to antibodies, due to their unique properties or the limitations of the methods themselves. Recently, HDX-MS has become a favored approach for aAb conformation. HDX-MS studies have shown that different regions of an IgG1 monoclonal antibody undergo significant conformational dynamics in response to physicochemical changes, different solvent conditions, or environmental stresses. Tracking these local dynamics offers a crucial analytical tool, useful not only for monitoring stability changes but also for designing improved, more stable therapeutic mAb formulations.
In addition to the conformation of antibodies themselves, characterizing the interactions between antibodies and antigens is also a research focus. Despite the successes of computational structural prediction, it often fails to accurately predict the interactions at the residue level within large protein complexes or even the correct orientation of protein partners. Integrating experimental data from structural biology can significantly enhance the performance of computational docking. A rapid method to probe protein-protein interactions is HDX-MS, which has been increasingly used in recent years for epitope mapping of antibodies against their respective antigens.
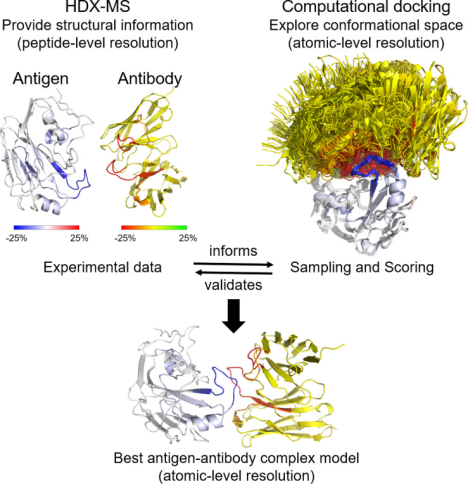
Figure 2. HDX-MS Characterization of Antigen-Antibody Interaction [5]
1. Characterization of Antibody Monomer Structure
HDX-MS experiments are typically conducted to compare conditions that can alter the local conformational dynamics of mAbs, such as physicochemical modifications, addition of perturbants, changes in solution conditions, or protein-protein/ligand interactions. The protein amide-hydrogen exchange reactions are usually performed under neutral or near-neutral pH conditions, continuing over various durations in continuous labeling schemes or for single intervals in pulse labeling experiments. In both cases, the protein solution in H2O is rapidly diluted with an excess of D2O solution to initiate the exchange. After a predetermined period of exchange, the reaction is quenched by dropping the pH to around 2.5 and lowering the temperature to about 0 °C, conditions under which the intrinsic exchange rate is minimal and the half-life of exchange is approximately 5000 times slower than under labeling conditions (pH 6.5 at 22 °C).
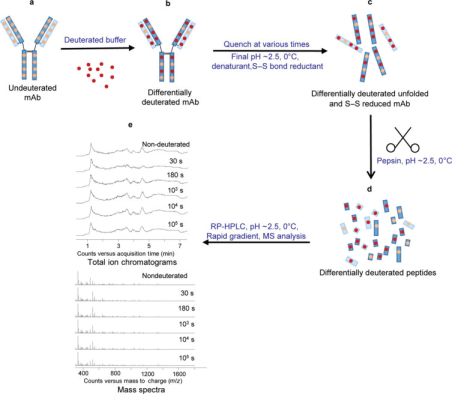
Figure 3. Typical IgG mAb HDX-MS Experimental Workflow [6]
In continuous labeling experiments, the incorporation of deuterium into proteins over time is tracked by measuring the intervals of deuterium uptake. In rapid pulse scenarios, such as in protein refolding experiments, two or more distinct protein populations might be detected—folded, unfolded, or partially folded in response to perturbative agents. Continuous labeling is more commonly used than pulse labeling because the most distinct states of protein conformation are difficult to predict in advance. Therefore, longer labeling intervals (usually between 101 and 105 seconds, more than about one day) are employed to maximize the probability of detecting differences between two protein states. Pulse labeling is typically used when experimental parameters like ligand or perturbant concentrations are varied.
The first step in analyzing HDX-MS data involves processing the raw LC-MS data to map mAb peptides, ideally achieving high sequence coverage for all regions. Peptides produced by pepsin digestion are typically identified using precise mass measurements and tandem mass spectrometry (MS/MS) based on peptide fragments. Medium and high-resolution mass spectrometers, such as time-of-flight, quadrupole-time-of-flight, ion cyclotron resonance, or orbitrap mass spectrometers, are advantageous for HDX-MS measurements because they can resolve isotopic structures of highly charged ions with high mass accuracy. Notably, peptides with nearly identical elution times and m/z values may partially or completely overlap in their spectra after deuteration. Another advantage of high-resolution mass analyzers is their ability to resolve partially overlapping isotopic spectra. Due to ion suppression, some peptides might lose MS signal intensity. If the spectral quality is poor, these peptides are excluded from further steps of HDX-MS data processing. Therefore, having a considerable number of redundant peptides (e.g., over 200 peptides for a mAb) is beneficial when constructing the initial peptide map.
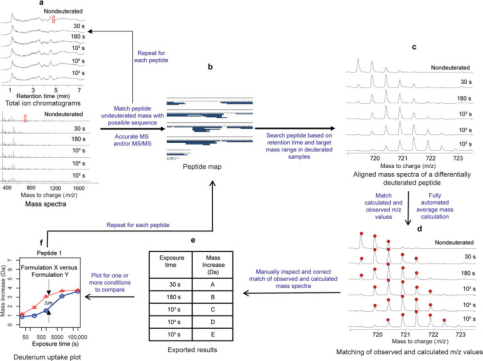
Figure 4. Typical IgG mAb HDX-MS Data Analysis [6]
The second step involves identifying deuterated peptides based on the retention time of the un-deuterated peptide and range of possible m/z values. As exposure to deuterium increases, the overlay of individual peptide spectra shows EX2 kinetics, gradually shifting to higher m/z values. In the third step, peaks are picked within the anticipated m/z range and retention time windows, and the average mass of deuterated peptide segments is calculated. The second and third steps are generally completed using software specifically designed for HDX-MS analysis, such as HDExaminer (Sierra Analytics, Modesto, CA) and DynamX (Waters, Milford, MA), along with free or open-source software like HDX-Analyzer, HX-Express, Hydra, and HDX WorkBench. Typically, the information required to process HDX-MS data includes a list of peptides, retention times, and the protein sequence. The results obtained must be scrutinized and curated by experts, generally involving alignment of peptide retention times to better match computed and observed mass spectra and to exclude peptides with overlapping spectra or poor spectral quality. Many peptides excluded during manual data curation can reliably be re-detected in un-deuterated samples. Finally, the mass increase for each peptide segment is plotted according to predefined deuterium exposure times, or a heatmap of deuterium incorporation percentage is displayed using the protein sequence.
Statistical analysis of HDX-MS data is performed to determine significant changes in the local dynamics of the mAb. The first step involves calculating the difference in deuterium uptake at each exchange time point (Δm) for each peptide segment and representing these differences in a bar chart. By aggregating the variance values of all deuterium uptake measurements and propagating the error between two measurements, the 99% confidence interval for significant differences is calculated. These significant differences are then displayed as colored regions on the mAb homology map.
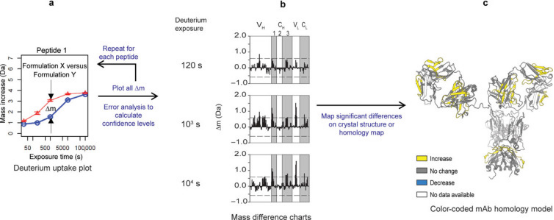
Figure 5. Statistical Analysis of HDX-MS Data for a Typical IgG mAb [6]
2. Antibody and Antigen Binding Site Analysis
Epitope mapping with HDX-MS starts by analyzing the antigen alone before examining its complex with an antibody. The samples are exposed to different labeling durations in D2O buffer under equilibrium. Antibody binding reduces the solvent exposure at the interface, decreasing deuterium uptake in affected peptides. Comparing HDX-MS spectra with and without the antibody identifies potential epitope peptides. Additionally, a separate run might map the antibody's binding sites (paratopes). After labeling, the reaction is quenched by dropping pH and temperature to minimize reverse exchange, often adding denaturants and reducing agents like tris (2-carboxyethyl) phosphine (TCEP) to reduce disulfide bonds, simplifying MS data interpretation. After pepsin digest (typically on-column), proteolytic peptides are desalted, separated on an ultra-high-performance liquid chromatography (UHPLC) column, and ionized by electrospray ionization (ESI). Comparing the masses in bound and unbound states pinpoints peptides at the antibody-antigen interface. Overall, the output of a conventional HDX-MS experiment is the level of deuterium uptake of each individual peptide at each labeling time point, accumulated by amide groups constituting that peptide. In most epitope mapping studies, the exchange rate of each peptide is averaged over all its amide groups, compared between the complex state and free state, and mapped onto the antibody/antigen structure if available. These peptide-resolution HDX-MS data preclude quantitative analysis and identification of residue interactions between antibody and antigen.
When integrated with structural techniques like cross-linking mass spectrometry (XL-MS), cryo-electron microscopy (cryo-EM), or X-ray crystallography, HDX-MS offers comprehensive insights into the intricate antibody-antigen interactions. XL-MS delivers information about the proximity of nearby protein sites and the distances between specific residues due to the identified inter-molecular cross-links. When combined with HDX-MS, XL-MS increases the chance of identifying a protein-protein binding site, pinpoints the exact interacting residues, and contributes explicit distance restraints for complex modeling. Their integration allows for the generation of more precise, high-confidence models of protein interfaces.
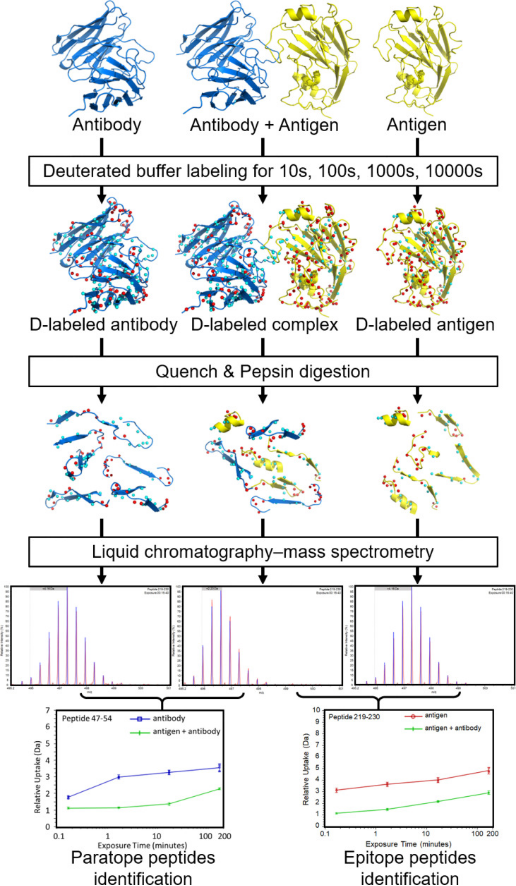
Figure 6. Workflow Diagram for HDX-MS in Ag-Ab Interaction Analysis [5]
HDX-MS signals combined with protein modeling software, such as MOE, PatchDock, ZDOCK, and RosettaDock, have effectively elucidated structures of antibody-antigen complexes in various epitope mapping studies. The ideal components for docking simulations are typically the unbound crystal structures of the antigen and the antibody, presented as Fab fragments or variable fragment (Fv) structures. In the absence of experimentally determined antibody structures, homology modeling of antibodies is often employed, representing a common scenario for antibody-antibody docking. One study utilized HDX-predicted antibody peptide models, sampling structures ranging from 50,000 to 100,000 to achieve reliable predictions.
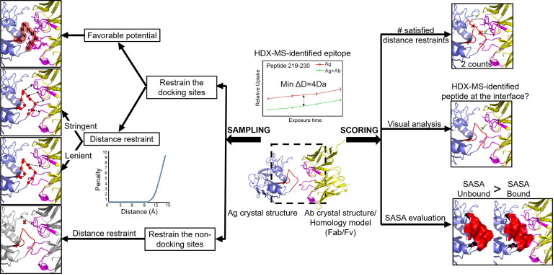
Figure 7. Integrating Protein Modeling with HDX-MS Data [5]
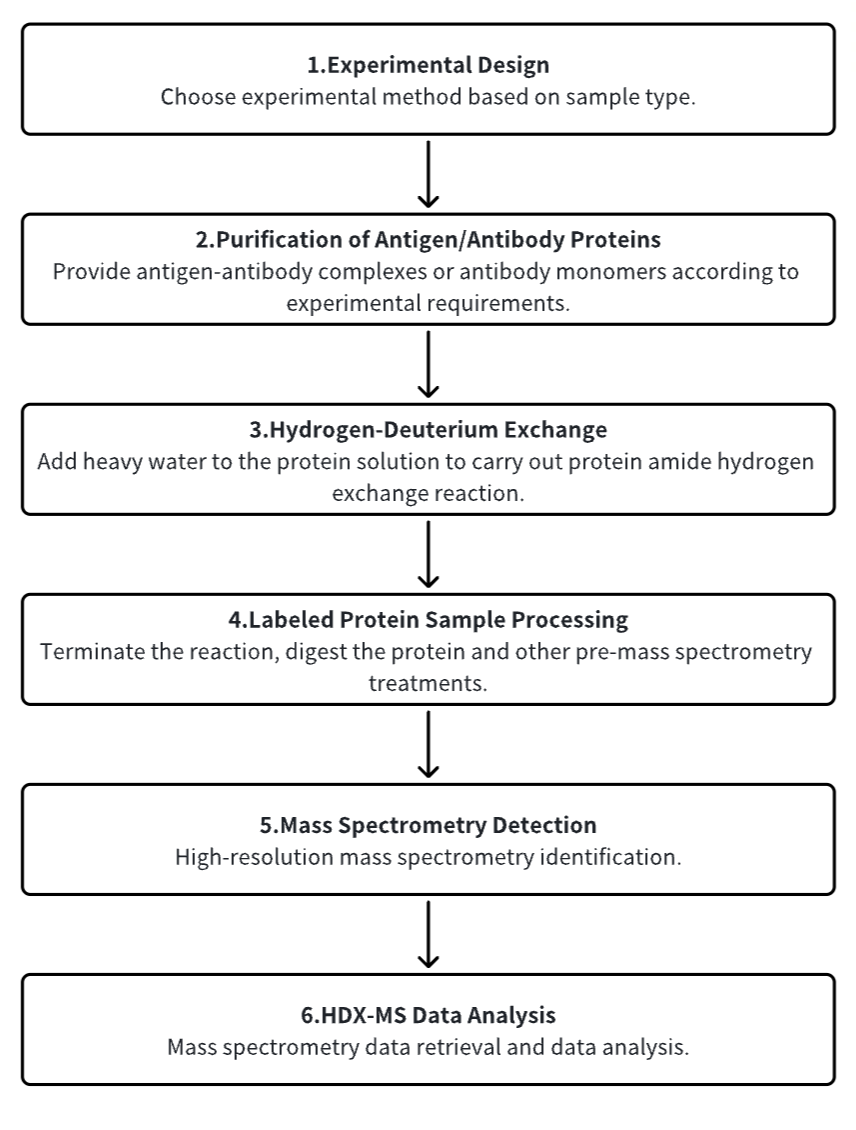
Analysis Workflow
1. Establish the Experimental Workflow Based on Specific Research Needs (Top-Down or Bottom-Up)
2. Purify Antigen and Antibody Proteins
3. Hydrogen-Deuterium Exchange
4. Terminate Labeling and Process Protein Samples
5. Mass Spectrometry Detection
6. HDX-MS Data Analysis
Service Advantages
1. Experimental Methods Tailored to Specific Research Requirements
2. Automated Sample Handling Platform for Precise Control of Hydrogen-Deuterium Exchange Conditions
3. High-Resolution and Reliable Mass Spectrometry Analysis
4. Diverse Data Analysis Methods
Sample Results
1. HDX-MS Epitope Mapping Clarifies the Surface Coverage of Antigens Related to High-Blocking Efficiency with Birch Pollen Allergen Antibodies
Using solution-phase amide backbone HDX combined with high-resolution Q-TOF or Orbitrap MS, the epitopes of natural pollen allergen protein, brich Bet v1 with four noncompetitive anti-Bet v1 antibodies were identified individually or in combination. HDX results showed that four anti-Bet v1 antibodies protected specific regions of Bet v1, explaining the differences in each antibody's blocking efficiency of Bet v1 binding in polyclonal IgE from Bet v1 allergic patients. An in-house HDX-MS system was further developed to explore the surface protection of Bet v1 in the presence of all four antibodies, achieving 100% sequence coverage and high redundancy. Data indicated that the four anti-Bet v1 antibodies could simultaneously bind with Bet v1 in solution, providing the most effective blocking in vitro antibody-blocking assays for 10 out of 9 tested IgE donors. This study was the first to use HDX to clarify the therapeutic advantages of combined antibodies over single antibodies in treating Bet v1 induced allergies.
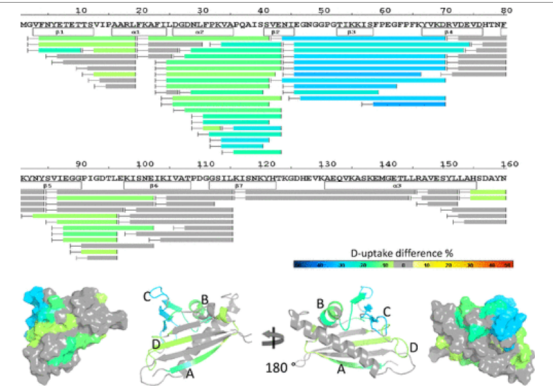
Figure 8. Heat Map of HDX-MS Epitope Mapping Results of Bet v1 in the Presence of Four mAb Combinations [7]
2. HDX-MS for Epitope Characterization of Therapeutic Candidate Antibodies on Calcium-Binding Membrane Protein A1
Annexin A1 (ANXA1) belongs to a family of highly homologous Ca2+-dependent phospholipid-binding proteins. ANXA1 is involved in several processes including cell proliferation, apoptosis, migration, and inflammatory responses. Thus, developing antibodies that block selected regions on ANXA1 holds great potential for developing novel therapies for inflammatory and cancer diseases. The study reported interaction sites between an ANXA1-specific antibody known to inhibit T-cell activation without adverse cytotoxic effects and ANXA1 using amide HDX-MS. For epitope determination, the study applied two bottom-up HDX-MS methods, digesting the proteins in solution and immobilized on magnetic beads. Both methods revealed interaction regions within Domain III of ANXA1 in a Ca2+ bound conformation. The antibody binding region was related to a hydrophobic binding pocket formed with the N-terminal domain in the absence of calcium. This study showed that even hidden and flexible binding regions could be studied with HDX-MS, quickly and effectively identifying antibody binding sites, which helps determine the mode of action of antibodies in therapy.

Figure 9. Dynamics of Deuterium in ANXA1 [8]
3. HDX-MS Study on Garadacimab Binding to Activated FXII Reveals Potential Binding Interfaces through Differential Solvent Exposure
Factor XII (FXII) is a crucial component of the intrinsic coagulation cascade and a therapeutic target for prophylactic treatment of hereditary angioedema (HAE). CSL312 (garadacimab) is a novel high-affinity human antibody that blocks the activity of activated FXII and is currently undergoing phase 3 clinical trials for HAE. Structural studies conducted using HDX-MS revealed evidence of antibody interaction with the FXII S1 specific pocket surroundings, including the 99-loop, 140-loop, 180-loop, and adjacent areas. It is considered that the complementarity-determining regions (CDR) in heavy chain CDR2 and CDR3 are potential paratopes for garadacimab, while the 99-loop, 140-loop, 180-loop, and 220-loop are the binding sites on the β-chain of activated FXII (β-FXIIa).
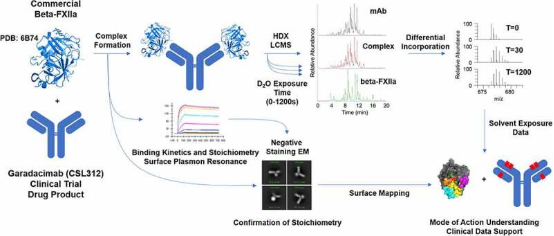
Figure 10. HDX-MS Experimental Workflow [9]
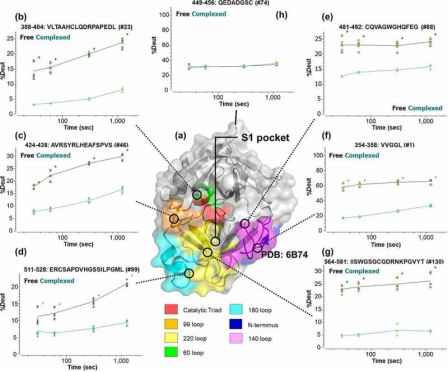
Figure 11. Dynamics of β-FXIIa when Bound with Garadacimab [9]
4. HDX-MS and MD Simulations Provide Evidence for Stabilization of IgG1—FcγRIa (CD64a) Immune Complexes through Intermolecular Glycoprotein Bonds
Previous reports have proposed various stabilization models for Fc-FcγRI immune complexes. While there is consensus on the importance of L235 and some hydrophobic contacts in complex stability within IgG1, there is disagreement regarding the existence of stabilizing glycoprotein contacts between the IgG1 glycan and the conserved FG-loop (171MGKHRY176) of FcγRIa. Complexes formed from the FcγRIa receptor and IgG1s containing biantennary glycans with N-acetylglucosamine, galactose, and α2,6-N-acetylneuraminic terminations were measured by HDX-MS, classified for dissimilarity with Welch’s ANOVA and Games-Howell post hoc procedures, and modeled with molecular dynamics (MD) simulations. For each glycoform of the IgG1—FcγRIa complex peptic peptides of Fab, Fc, and FcγRIa report distinct H/D exchange rates. MD simulations corroborate the differences in the peptide deuterium content through calculation of the percent of time that transient glycan-peptide bonds exist. These results suggest that the stability of the IgG1-FcγRIa complex is associated with intermolecular glycoprotein interactions between the IgG1 glycan and the 173KHR175 motif within the FcγRIa FG loop. The results also indicated that intramolecular glycan-protein bonds stabilized the Fc region in both isolated and complexed IgG1. Additionally, HDX-MS data suggested that the Fab domain in the IgG1-FcγRI complex had glycan-binding contacts.
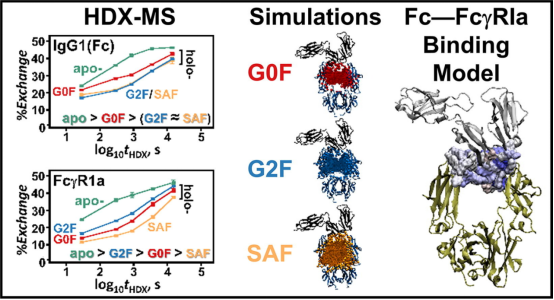
Figure 12. HDX-MS Analysis of the IgG1—FcγRIa (CD64a) Immune Complex [10]
Sample Submission Requirements
1. Comprehensive Experimental Steps
2. Specifications of Relevant Instrumentation
3. Compilation of Original Experimental Data
4. Data Analysis Report (Protein Spatial Epitope, Conformation, etc. Analysis Results)
Applications
1. Epitope Mapping Polyclonal Antibodies by HDX-MS
Epitope mapping of antibodies is crucial for understanding adaptive immunity and studying the mechanisms of therapeutic antibodies and vaccines. Especially insights into the binding of the entire polyclonal antibody population (pAb) raised upon vaccination would be of unique value to vaccine development. However, few epitope mapping techniques can tolerate the complexity of pAb samples.
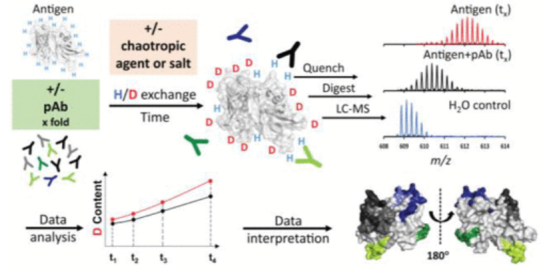
Figure 13. HDX-MS Analysis of Polyclonal Antibodies Epitopes [11]
2. Development of an Automated Protein HDX-MS Platform
Standard procedures for studying protein conformation and dynamics involve proteolytic digestion and subsequent MS following HDX. Recent advancements have seen the development of an automated HDX-MS platform that minimizes errors by integrating corrective calibrations into HDX data analysis. The platform employs internal standards with rapid and slow intrinsic HDX rates to adjust for variations in back-exchange and intrinsic protein conformation under different experimental conditions. The complete HDX data processing workflow is automated within the MassAnalyzer software, delivering comprehensive, unsupervised analysis from ion detection to HDX result output within a day.
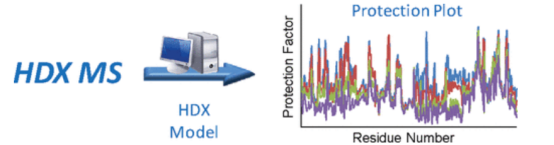
Figure 14. Development of HDX-MS Analysis Platform [12]
3. Combining AI with HDX-MS
Three-dimensional structures and dynamics are crucial for protein function. The development of HDX technology has enabled us to detect dynamic information about proteins in physiologically relevant conditions. HDX coupled with MS (HDX-MS) has been widely used in pharmaceutical industries. However, obtaining dynamic information at the resolution of the single amino acid is challenging and time-consuming. A study showcased the first deep learning based model, artificial intelligence-based HDX (AI-HDX), which can predict the intrinsic dynamics of proteins based on their sequence. It combines deep learning, experimental HDX, sequence alignment, and protein structure prediction to reveal protein structural dynamics. AI-HDX can be broadly applied in drug discovery, protein engineering, and biomedical research. As a demonstration, it elucidated receptor-binding domain structural dynamics as a potential mechanism of anti-severe acute respiratory syndrome coronavirus 2 (SARS-CoV-2) antibody efficacy and immune escape. AI-HDX fundamentally differs from current AI tools used for protein analysis and may transform protein design across various applications.
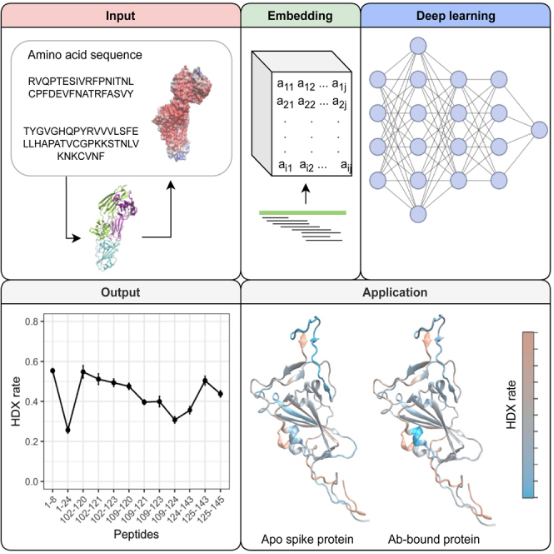
Figure 15. Development of HDX-MS Analysis Platform [13]
FAQ
Q1: What factors can influence HDX-MS results?
(1) pH Value: The rate of amide exchange is sensitive to pH, a critical factor in retaining deuterium through MS analysis. Proteins are typically labeled near neutral pH or close to physiological conditions (pH 5-10), where the exchange rates (kch) are relatively fast, allowing the detection of various protein motions within a reasonable time frame.
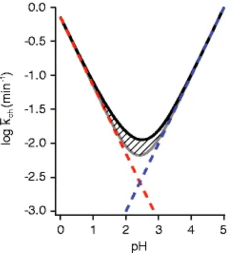
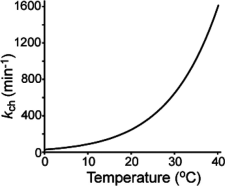
Figure 17. Functional Relationship between Exchange Rate of Unstructured Amide and Temperature [1]
(3) Other factors include atmospheric pressure, ionic strength, organic solvents, isotopic effects, etc.
References
[1] James EI, Murphree TA, Vorauer C, Engen JR, Guttman M. Advances in Hydrogen/Deuterium Exchange Mass Spectrometry and the Pursuit of Challenging Biological Systems. Chem Rev. 2022 Apr 27;122(8):7562-7623. doi: 10.1021/acs.chemrev.1c00279. Epub 2021 Sep 7. PMID: 34493042; PMCID: PMC9053315.
[2] Masson GR, Jenkins ML, Burke JE. An overview of hydrogen deuterium exchange mass spectrometry (HDX-MS) in drug discovery. Expert Opin Drug Discov. 2017 Oct;12(10):981-994. doi: 10.1080/17460441.2017.1363734. Epub 2017 Aug 17. PMID: 28770632.
[3] Damont A, Legrand A, Cao C, Fenaille F, Tabet JC. Hydrogen/deuterium exchange mass spectrometry in the world of small molecules. Mass Spectrom Rev. 2023 Jul-Aug;42(4):1300-1331. doi: 10.1002/mas.21765. Epub 2021 Dec 2. PMID: 34859466.
[4] Zhang H, Cui W, Gross ML. Mass spectrometry for the biophysical characterization of therapeutic monoclonal antibodies. FEBS Lett. 2014 Jan 21;588(2):308-17. doi: 10.1016/j.febslet.2013.11.027. Epub 2013 Nov 26. PMID: 24291257; PMCID: PMC3917544.
[5] Tran MH, Schoeder CT, Schey KL, Meiler J. Computational Structure Prediction for Antibody-Antigen Complexes From Hydrogen-Deuterium Exchange Mass Spectrometry: Challenges and Outlook. Front Immunol. 2022 May 26;13:859964. doi: 10.3389/fimmu.2022.859964. PMID: 35720345; PMCID: PMC9204306.
[6] Majumdar R, Middaugh CR, Weis DD, Volkin DB. Hydrogen-deuterium exchange mass spectrometry as an emerging analytical tool for stabilization and formulation development of therapeutic monoclonal antibodies. J Pharm Sci. 2015 Feb;104(2):327-45. doi: 10.1002/jps.24224. Epub 2014 Oct 29. PMID: 25354868.
[7] Zhang Q, Yang J, Bautista J, Badithe A, Olson W, Liu Y. Epitope Mapping by HDX-MS Elucidates the Surface Coverage of Antigens Associated with High Blocking Efficiency of Antibodies to Birch Pollen Allergen. Anal Chem. 2018 Oct 2;90(19):11315-11323. doi: 10.1021/acs.analchem.8b01864. Epub 2018 Sep 14. PMID: 30170487.
[8] Gramlich M, Hays HCW, Crichton S, Kaiser PD, Heine A, Schneiderhan-Marra N, Rothbauer U, Stoll D, Maier S, Zeck A. HDX-MS for Epitope Characterization of a Therapeutic ANTIBODY Candidate on the Calcium-Binding Protein Annexin-A1. Antibodies (Basel). 2021 Mar 19;10(1):11. doi: 10.3390/antib10010011. PMID: 33808657; PMCID: PMC8006148.
[9] Ow SY, Kapp EA, Tomasetig V, Zalewski A, Simmonds J, Panousis C, Wilson MJ, Nash AD, Pelzing M. HDX-MS study on garadacimab binding to activated FXII reveals potential binding interfaces through differential solvent exposure. MAbs. 2023 Jan-Dec;15(1):2163459. doi: 10.1080/19420862.2022.2163459. PMID: 36628468; PMCID: PMC9839371.
[10] Anderson KW, Bergonzo C, Scott K, Karageorgos IL, Gallagher ES, Tayi VS, Butler M, Hudgens JW. HDX-MS and MD Simulations Provide Evidence for Stabilization of the IgG1-FcγRIa (CD64a) Immune Complex Through Intermolecular Glycoprotein Bonds. J Mol Biol. 2022 Jan 30;434(2):167391. doi: 10.1016/j.jmb.2021.167391. Epub 2021 Dec 8. PMID: 34890647.
[11] Ständer S, R Grauslund L, Scarselli M, Norais N, Rand K. Epitope Mapping of Polyclonal Antibodies by Hydrogen-Deuterium Exchange Mass Spectrometry (HDX-MS). Anal Chem. 2021 Aug 31;93(34):11669-11678. doi: 10.1021/acs.analchem.1c00696. Epub 2021 Jul 24. PMID: 34308633.
[12] Zhang Z, Zhang A, Xiao G. Improved protein hydrogen/deuterium exchange mass spectrometry platform with fully automated data processing. Anal Chem. 2012 Jun 5;84(11):4942-9. doi: 10.1021/ac300535r. Epub 2012 May 15. PMID: 22571272.
[13] Yu J, Uzuner U, Long B, Wang Z, Yuan JS, Dai SY. Artificial intelligence-based HDX (AI-HDX) prediction reveals fundamental characteristics to protein dynamics: Mechanisms on SARS-CoV-2 immune escape. iScience. 2023 Apr 21;26(4):106282. doi: 10.1016/j.isci.2023.106282. Epub 2023 Feb 27. PMID: 36910327; PMCID: PMC9968663.
MtoZ Biolabs, an integrated chromatography and mass spectrometry (MS) services provider.
Related Services
Antibody Epitope Mapping Service
Antibody Sequencing Service: Advanced NGS and MS Techniques
Protein-Protein Interactions Characterization Service | HDX-MS
How to order?

