SILAC (Stable Isotope Labeling by Amino Acids in Cell Culture)-Based Quantitative Service
MtoZ Biolabs provides SILAC-based quantitative proteomics analysis services for pre-labeled cell samples, combining LC-MS/MS detection and bioinformatics analysis to quantify protein abundance changes between different experimental conditions.
By integrating stable isotope-based quantification, high-resolution mass spectrometry, and comprehensive data analysis, our SILAC proteomics service supports cell-based studies including drug response, genetic regulation, and protein expression profiling.
- >6,000 Protein Identification in Routine Cell Samples
- <5 ppm Mass Accuracy with High-Resolution Orbitrap MS
- Reliable SILAC-Based Relative Protein Quantification
What Is SILAC Quantitative Proteomics?
SILAC is a metabolic labeling-based quantitative proteomics method for relative protein abundance analysis. During cell culture, stable isotope-labeled amino acids are incorporated into cellular proteins, generating distinguishable Light and Heavy isotope signals between different experimental conditions. After labeled samples are mixed at defined ratios, LC-MS/MS analysis is performed, and protein abundance changes are quantified based on differences in corresponding peptide signals.
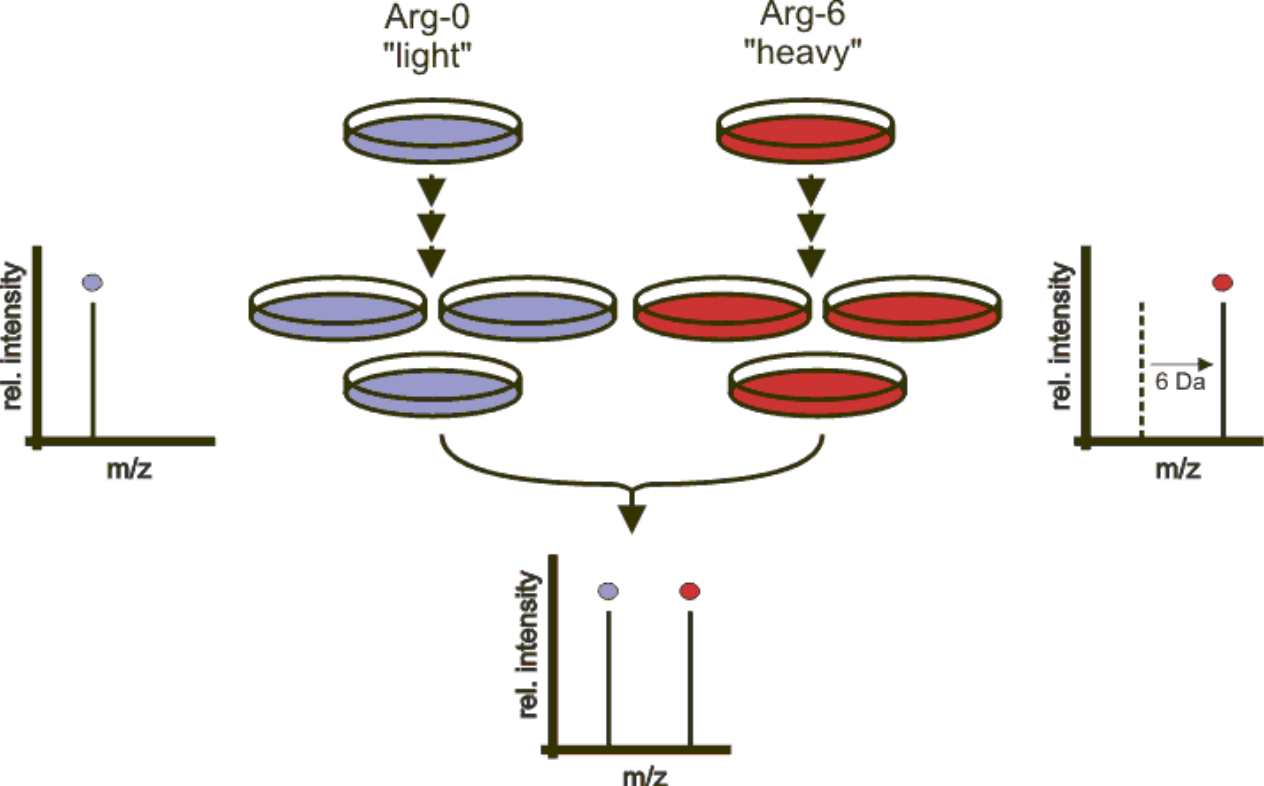
Figure 1. The Principle of SILAC
SILAC quantitative proteomics is primarily applied to cultured cell models for comparative protein expression analysis, supporting studies of treatment responses, genetic regulation, and cellular state changes.
When This Service Is a Good Fit
|
How SILAC Could Help |
Suitable Scenario |
|
Identify Differentially Abundant Proteins |
Compare protein abundance changes between different experimental conditions, such as control versus treatment groups, different cellular states, or different culture conditions. |
|
Analyze Drug Response and Molecular Mechanisms |
Analyze proteome changes induced by drug treatment, compound stimulation, or other cellular perturbations to identify affected proteins and biological pathways. |
|
Study Genetic Regulation Effects |
Investigate protein expression changes caused by gene knockout, knockdown, overexpression, or other genetic modifications. |
|
Track Protein Complex Dynamics |
Analyze changes in protein complex composition or associated protein abundance under different experimental conditions to study cellular regulation. |
For research objects that cannot undergo SILAC metabolic labeling, such as tissues, blood, biofluids, or other non-cultured cell samples, TMT-based peptide-level chemical labeling strategies may be considered. MtoZ Biolabs also provides TMT quantitative proteomics services to support protein abundance comparison across diverse biological samples and large-scale quantitative proteomics studies.
Analysis Workflow
1. Sample Preparation and Quality Assessment
MtoZ Biolabs receives pre-labeled SILAC cell pellets, protein lysates, or gel samples and performs sample quality assessment before proteomics analysis.
2. Protein Extraction and Digestion
Protein extraction, reduction and alkylation, enzymatic digestion, and C18 desalting are performed to generate peptide samples suitable for LC-MS/MS analysis.
3. LC-MS/MS Data Acquisition
High-resolution mass spectrometry is used for DDA-based data acquisition to obtain peptide fragmentation information.
4. Database Searching and Quantification
MaxQuant or Proteome Discoverer is used for database searching, and SILAC isotope parameters are applied for protein identification and relative quantification.
5. Bioinformatics Analysis
Differential protein analysis, functional enrichment analysis, and protein-protein interaction analysis are performed to interpret protein expression changes.
Why Choose MtoZ Biolabs?
1. Accurate SILAC-Based Quantification
Stable isotope labeling enables Light/Heavy peptide comparison for reliable relative protein abundance analysis between experimental conditions.
2. Deep Proteome Profiling with High-Resolution MS
Orbitrap mass spectrometry supports deep protein identification, with routine cell samples enabling identification of thousands of proteins and mass accuracy below 5 ppm.
3. Standardized Proteomics Workflow
Integrated sample processing, LC-MS/MS analysis, quantitative analysis, and bioinformatics interpretation ensure reliable SILAC proteomics results.
4. Comprehensive Data Analysis Support
Provides protein identification, differential analysis, functional enrichment, PPI analysis, and customized bioinformatics solutions for biological interpretation.
Applications
1. Differential Protein Expression Analysis
Compare protein abundance changes between different cellular conditions, including control versus treatment groups, to identify differentially expressed proteins.
2. Drug Response and Mechanism Studies
Analyze proteome changes induced by drug treatment or cellular stimulation to identify affected proteins and biological pathways.
3. Protein Complex and Dynamic Proteomics Studies
Monitor changes in protein abundance within cellular complexes or under different cellular conditions to study dynamic regulation.
4. Protein Turnover Studies
Track protein synthesis and degradation dynamics using stable isotope labeling strategies in cultured cell models.
Sample Submission Requirements
|
Item |
Requirement |
|
Supported Sample Types |
Pre-labeled SILAC cell pellets, SILAC-labeled cell lysates, labeled protein samples, or gel samples. |
|
Labeling Requirements |
Samples must have completed stable isotope labeling and be mixed according to the experimental design before submission. |
|
Cell Types |
Common cultured cell models, including adherent and suspension cells, are supported. Sample compatibility should be confirmed in advance. |
|
Protein Sample Requirements |
For solution samples, at least 20 μg total protein is recommended, with a protein concentration above 0.5 μg/μL. |
|
Gel Sample Requirements |
Gel bands should be visible by eye, and relevant experimental information should be provided. |
|
Database Requirements |
Species information and reference databases are required. UniProt and customer-provided FASTA databases are supported. |
|
Shipping Requirements |
Cell pellets and protein solutions should be stored appropriately and shipped on dry ice. Gel samples can be shipped according to sample conditions. |
Deliverables
1. Protein and Peptide Identification Results
2. SILAC Quantification Results
3. Quality Control Results
4. Differential Protein Analysis
5. Functional Annotation and Enrichment Analysis
6. Protein-Protein Interaction (PPI) Analysis
7. Raw Mass Spectrometry Data Files
8. Final Analysis Report
FAQs
Q1. Does the SILAC service include cell culture and isotope labeling?
MtoZ Biolabs does not provide SILAC labeling during cell culture. Customers should complete cell culture, stable isotope labeling, and sample mixing before submitting samples for downstream proteomics analysis.
Q2. Can SILAC be used for protein interaction studies?
SILAC can be used to analyze changes in protein complex composition. However, the results reflect changes in protein abundance or complex composition and cannot independently prove direct in vivo protein interactions.
Q3. How long does a SILAC quantitative proteomics project usually take?
A typical SILAC quantitative proteomics project takes approximately 3–4 weeks. The actual timeline may vary depending on sample quality, sample preparation complexity, instrument scheduling, and customized bioinformatics requirements.
Start Your SILAC Quantitative Proteomics Project
Planning a SILAC quantitative proteomics study? Provide your cell type, labeling strategy, experimental design, sample information, and research objectives. Our technical team can evaluate sample compatibility, analysis workflow, and downstream bioinformatics options before project initiation.
MtoZ Biolabs, an integrated chromatography and mass spectrometry (MS) services provider.
Related Services
SILAC/Dimethyl Quantitative Proteomics Service
Label-Based Protein Quantitative Service—iTRAQ, TMT, SILAC
Demo for SILAC (Stable Isotope Labeling by Amino Acids in Cell Culture)-Based Quantitative Service
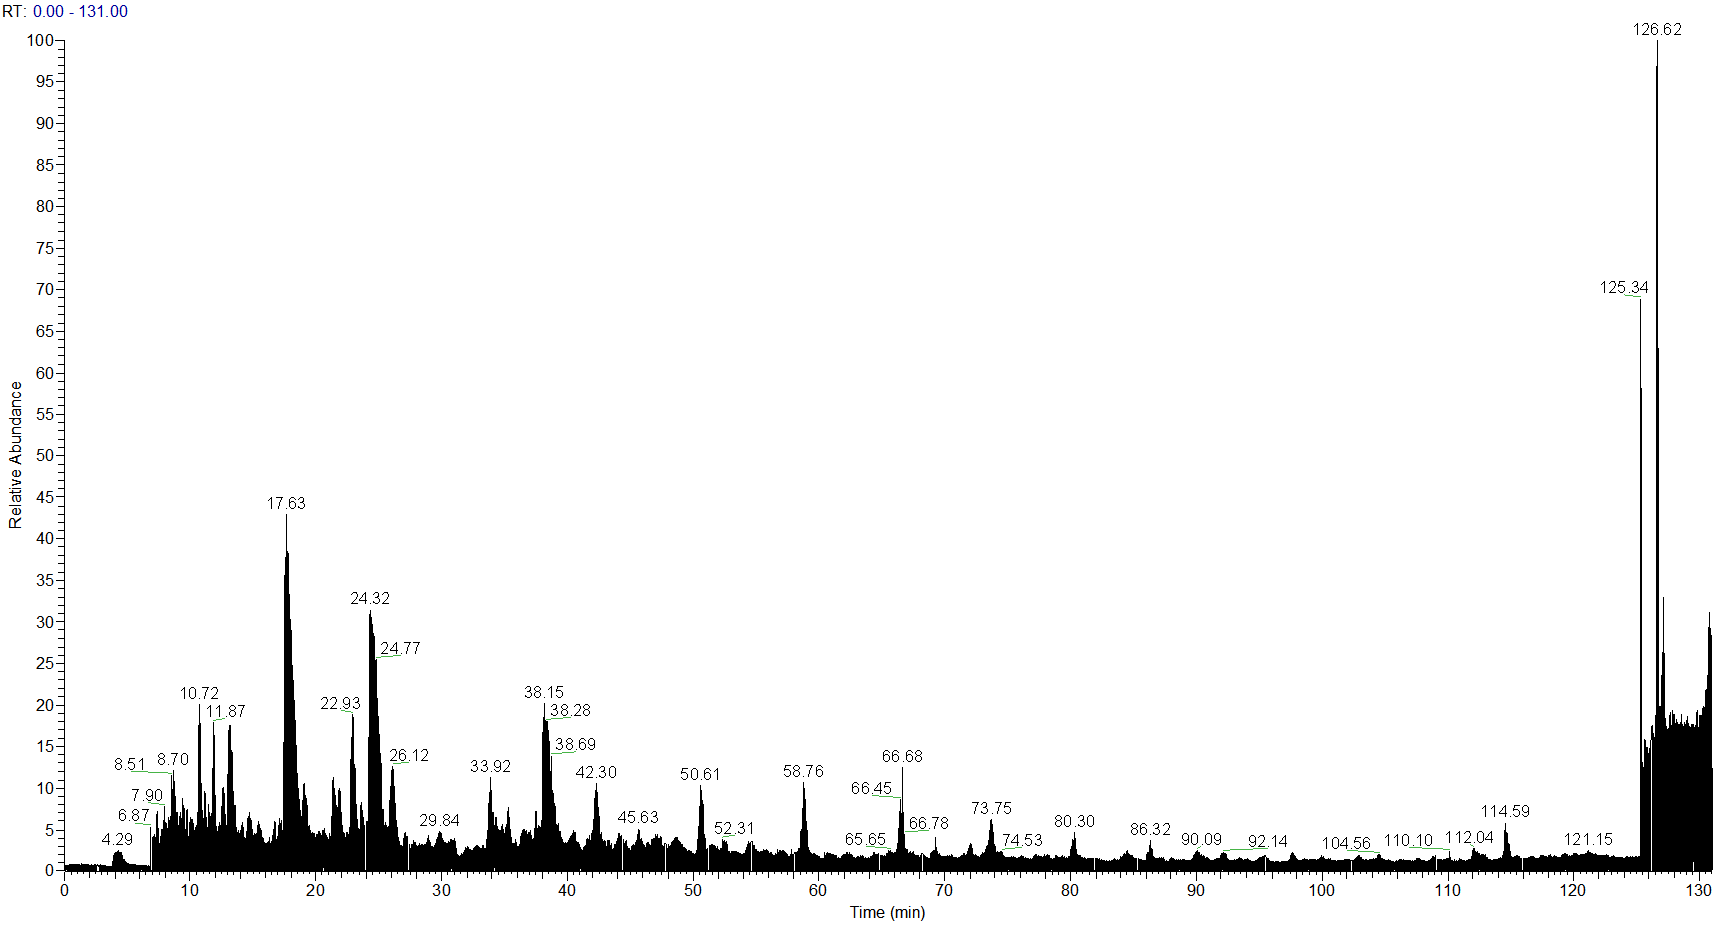
Total Ion Chromatogram
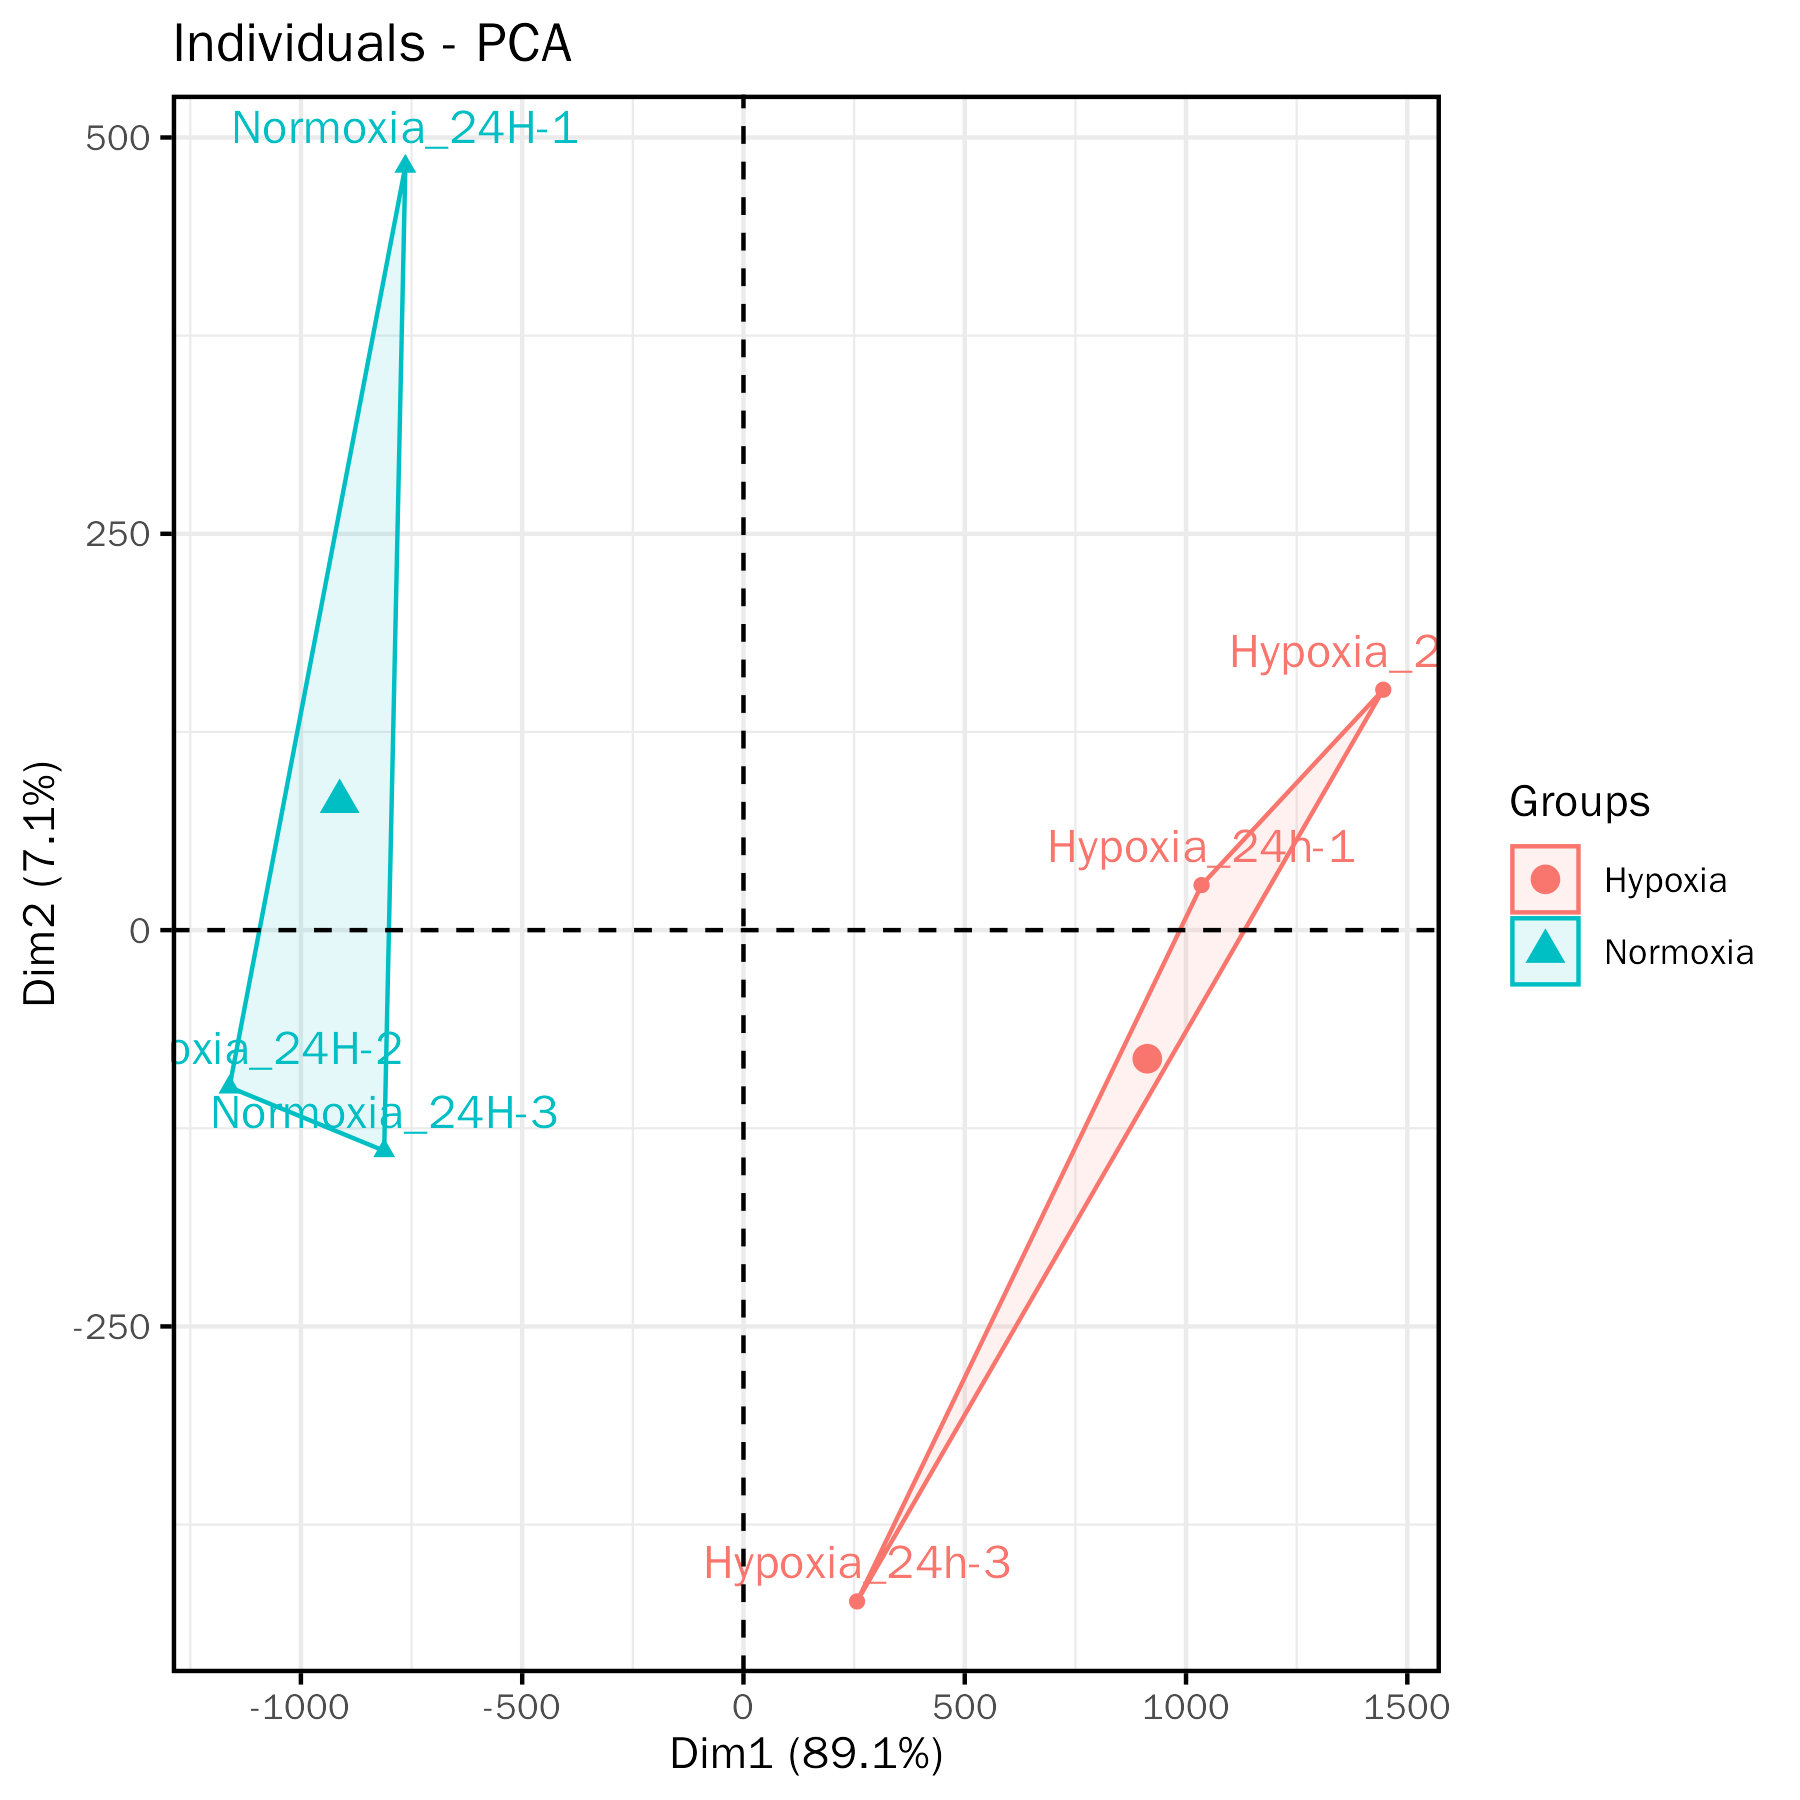
PCA Plot of Sample Grouping
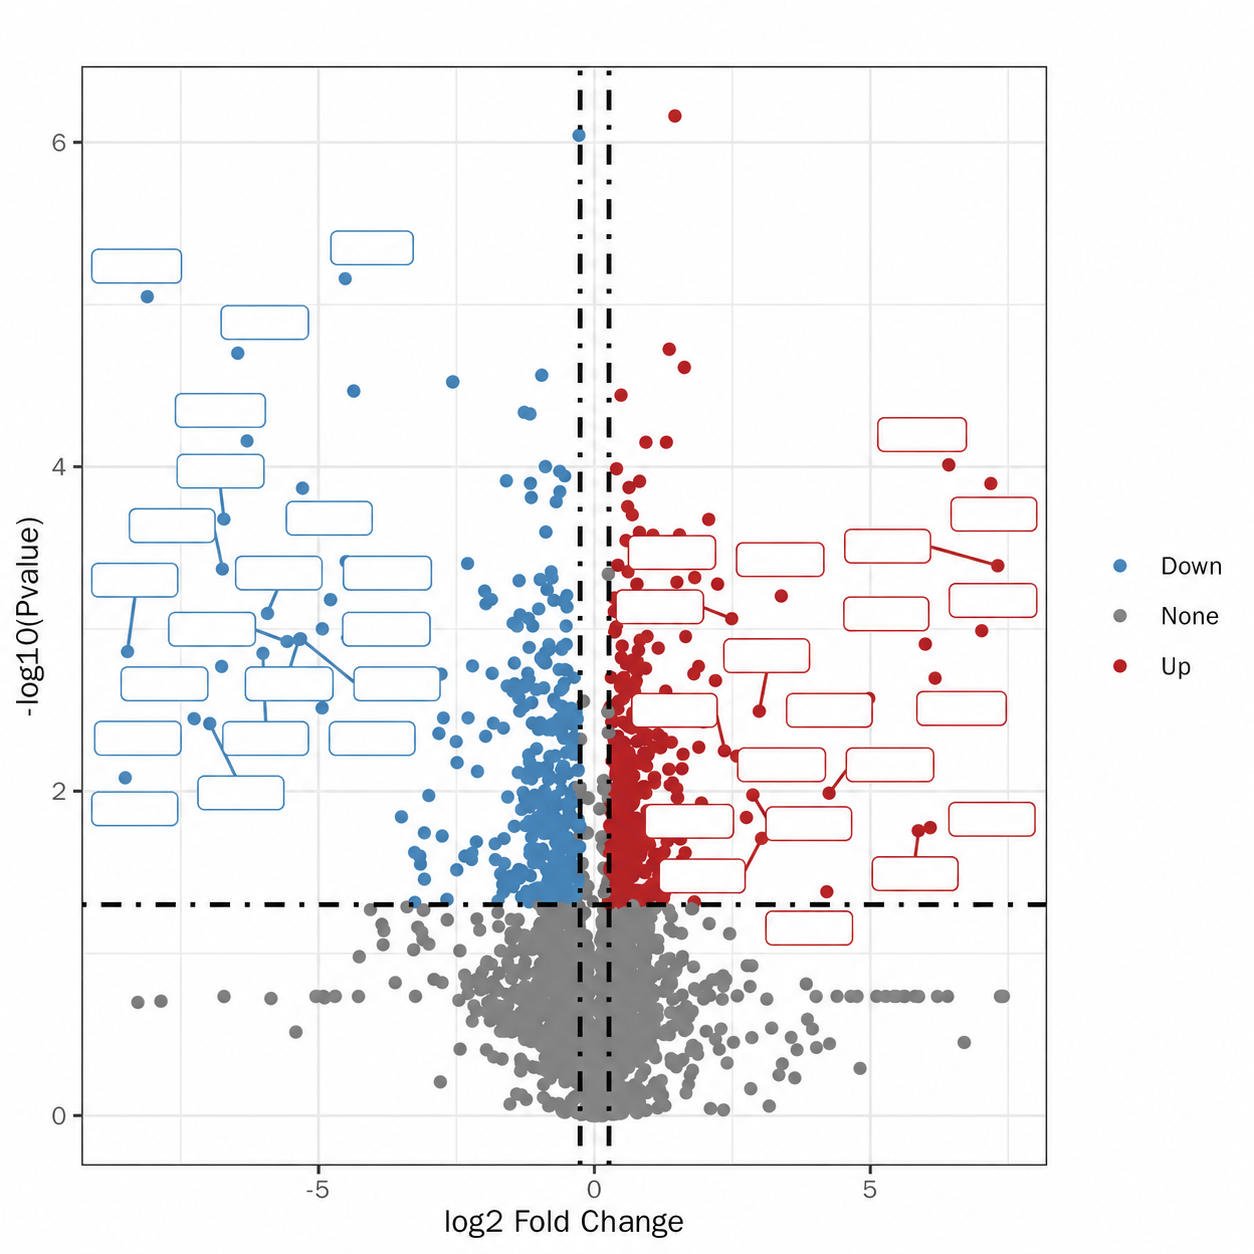
Volcano Plot of Differential Proteins