


Proteomics Data Quality Assessment Workflow: QC Metrics, Filtering, and Validation
-
Proteomics QC should start before statistics, because poor spectra, unstable chromatography, and sample drift can create false biological patterns.
-
Preprocessing removes technical noise, aligns features, normalizes intensity values, and prepares data for comparison.
-
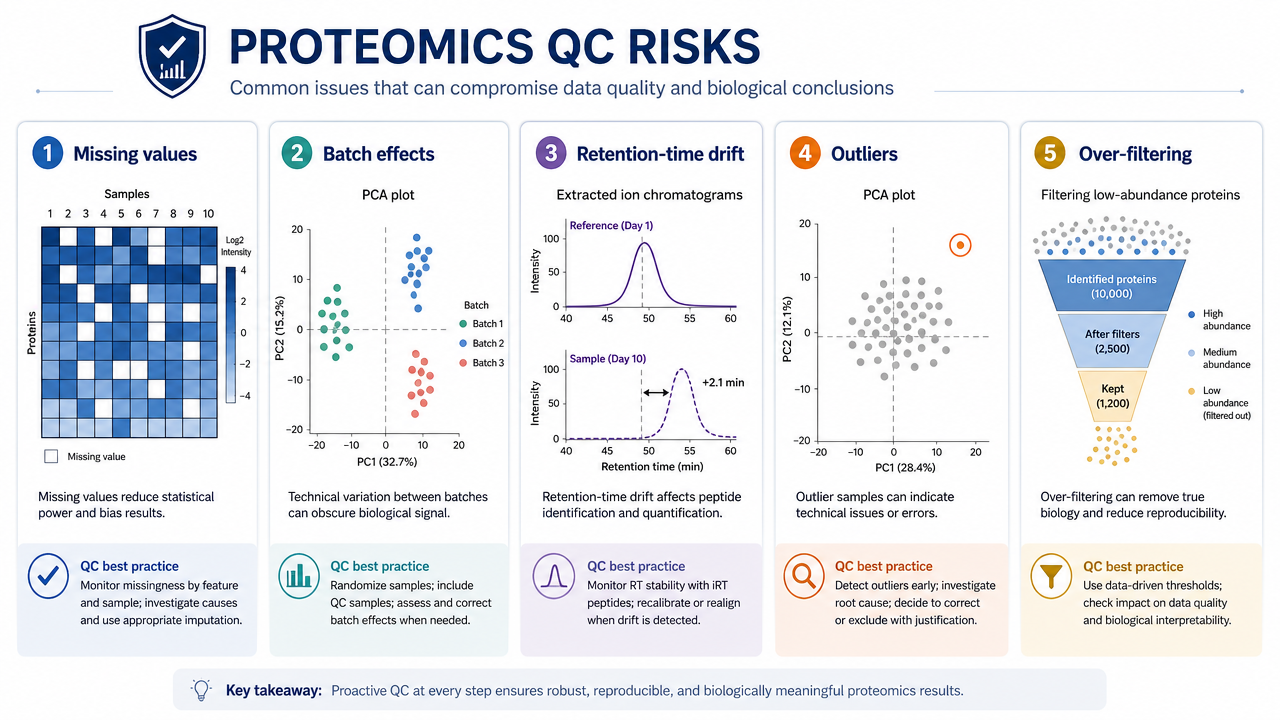
Filtering should balance confidence and biological coverage. Over-filtering can erase low-abundance proteins that matter.
-
Statistical QC should examine replicate consistency, coefficient of variation, PCA clustering, missingness, and batch structure.
-
Validation by targeted MS, immunoblotting, ELISA, or orthogonal omics improves confidence in high-priority proteins.
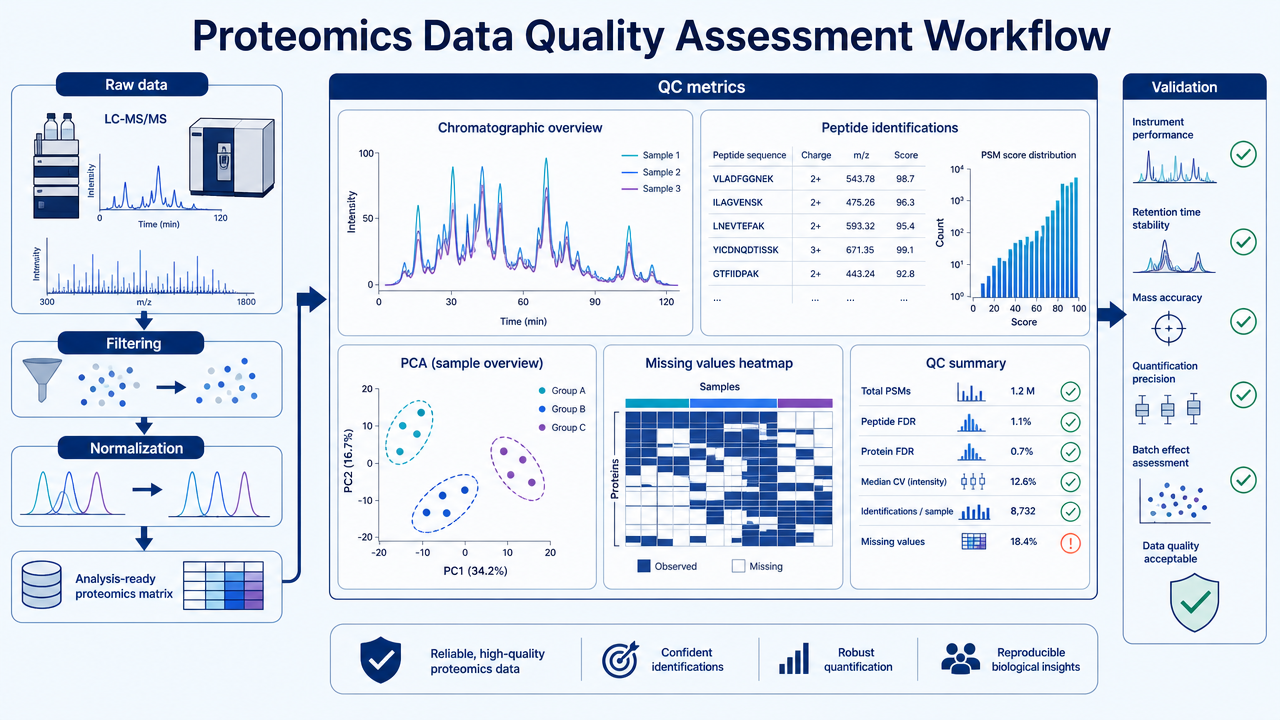
Proteomics data quality assessment is the process of checking whether LC-MS/MS data are reliable enough for biological interpretation. A good QC workflow does more than remove obvious bad files. It checks raw signal quality, identification confidence, quantitative reproducibility, missing values, batch effects, statistical outliers, and whether key findings can be validated by independent evidence.
Key Takeaways
What Does Proteomics Data Quality Assessment Check?
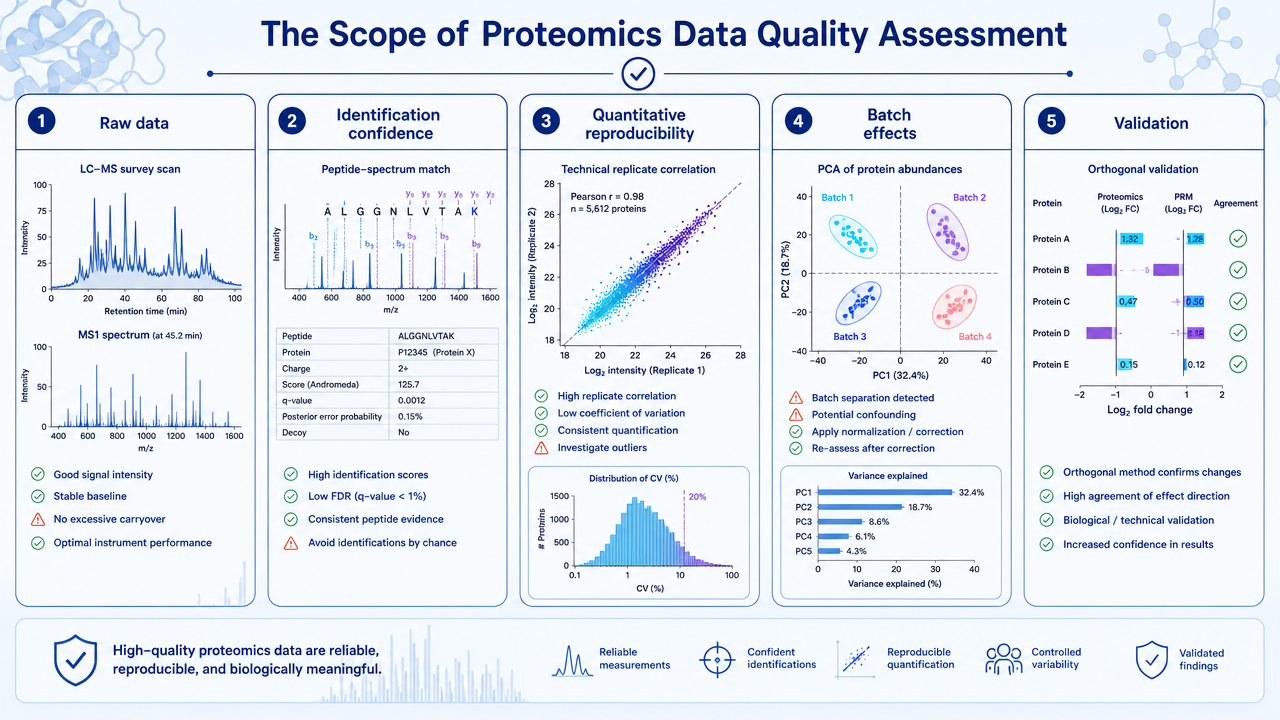
Proteomics data quality assessment checks whether the measured peptide and protein signals are technically stable, correctly identified, quantitatively reproducible, and biologically plausible. It applies to DDA, DIA, label-free, TMT, iTRAQ, PRM, PTM proteomics, and other LC-MS/MS workflows, although the exact metrics differ by acquisition strategy.
Related Services
Proteomics Bioinformatics Analysis Service
Bioinformatics Customized Service
Glycoproteomics Data Analysis Service
Phosphoproteomics Data Analysis Service
Step 1: Raw Data and Preprocessing Checks
The first step is to inspect raw LC-MS/MS performance. Useful checks include total ion chromatogram stability, retention time drift, peak shape, mass accuracy, MS/MS acquisition depth, signal-to-noise ratio, and the number of identified peptides or proteins per run.
Preprocessing then removes or corrects technical artifacts. Depending on the platform, this may include baseline correction, feature detection, deisotoping, retention-time alignment, peak area extraction, normalization, and removal of low-quality spectra or background signals.
Step 2: Identification Confidence Filtering
Protein identification should not be treated as a simple name list. Peptide-spectrum matches, peptides, and proteins should pass defined confidence criteria. Common filters include false discovery rate, peptide score, protein-level confidence, unique peptide count, and decoy database performance.
Strict filtering reduces false positives. But filtering that is too aggressive can remove real low-abundance proteins, especially in plasma, single-cell, PTM, or membrane proteomics projects.
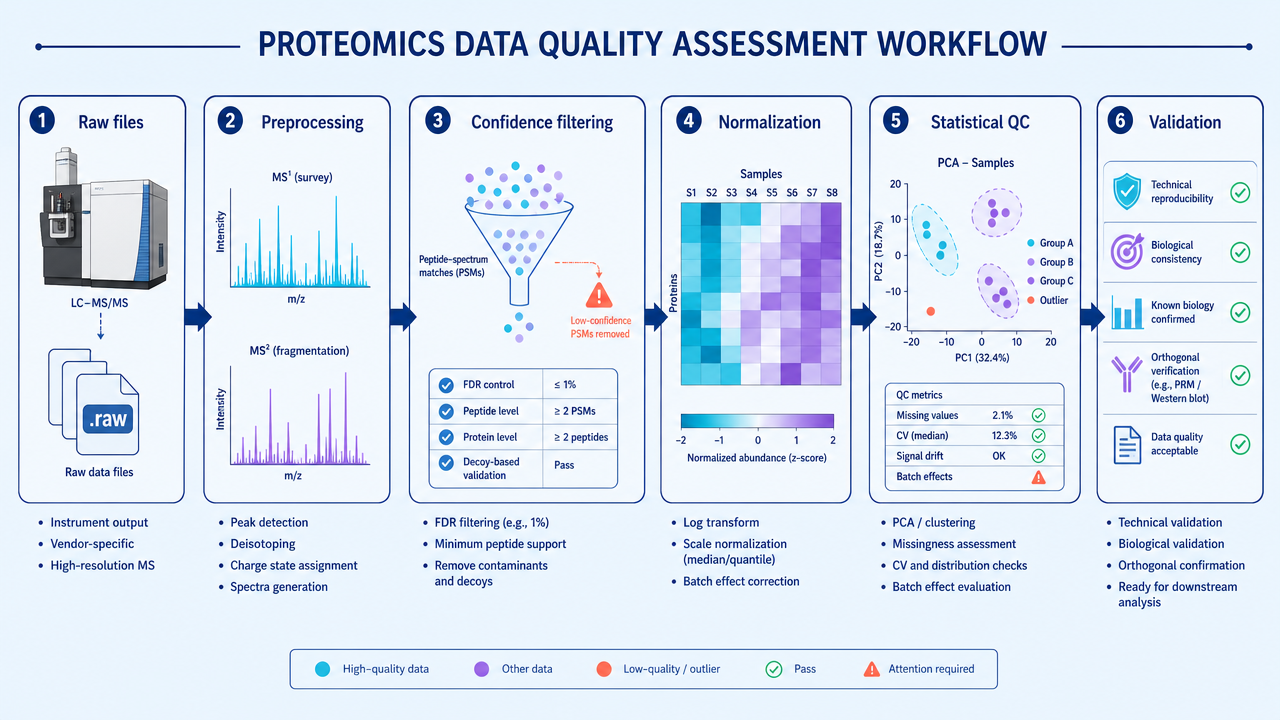
Step 3: Quantitative Quality Control
Quantitative QC asks whether abundance values are comparable across samples. For label-free data, this includes feature alignment, missing values, intensity distributions, normalization performance, and run-order effects. For TMT or iTRAQ data, it includes reporter ion quality, channel balance, ratio compression, and batch design.
Replicate consistency is central. Researchers often examine Pearson or Spearman correlation, coefficient of variation, PCA or UMAP clustering, sample outliers, and whether technical replicates cluster more tightly than biological groups.
Step 4: Missing Values and Vatch Effects
Missing values are common in proteomics. Some are random, but many are abundance-dependent: low-abundance peptides are more likely to be missing. Treating all missing values the same can distort downstream statistics.
Batch effects may come from sample preparation date, LC column aging, instrument maintenance, run order, labeling batch, or data processing version. Pooled QC samples, randomized injection order, batch-aware normalization, and metadata review help separate biology from technical structure.
Step 5: Statistical Analysis and Validation
After preprocessing and QC, statistical analysis can test differential abundance, pathway enrichment, sample clustering, and association with phenotypes. Good statistical analysis reports thresholds, multiple-testing correction, effect sizes, replicate numbers, missing-value handling, and outlier decisions.
Important findings should be validated. Options include PRM or SRM targeted proteomics, immunoblotting, ELISA, enzyme assays, or independent cohorts.
How to Choose QC Thresholds
| QC Decision | Common Metric | Practical Use | Main Caution |
|---|---|---|---|
| Identification confidence | PSM, peptide, and protein FDR | Controls false positives | Protein inference can still be ambiguous |
| Quantitative reproducibility | CV, correlation, replicate clustering | Finds unstable samples or runs | Biology can also create variation |
| Missing values | Missingness per protein and per sample | Flags low-quality features or samples | Imputation can create artificial signals |
| Batch structure | PCA, UMAP, metadata overlay | Detects run-order or batch effects | Correction can remove real biology if misused |
| Validation priority | Effect size, consistency, biological relevance | Selects candidates for follow-up | Do not validate only the largest fold changes |
FAQ
1. What is proteomics data quality assessment?
Proteomics data quality assessment is the evaluation of LC-MS/MS data reliability before biological interpretation. It checks raw signal quality, identification confidence, quantification stability, batch effects, missing values, and validation needs.
2. Why is QC important in proteomics?
QC is important because noise, low-confidence identifications, missing values, and batch effects can produce false biological conclusions if they are not detected before statistical analysis.
3. Which QC metrics are commonly used?
Common metrics include peptide and protein FDR, identified peptide count, protein count, signal-to-noise ratio, retention-time stability, mass accuracy, replicate correlation, coefficient of variation, missingness, and PCA clustering.
4. Can filtering remove useful proteins?
Yes. Over-filtering can remove low-abundance but biologically important proteins. Filtering thresholds should reflect the experiment type, sample complexity, and the need for discovery versus high-confidence reporting.
5. How should proteomics findings be validated?
High-priority findings can be validated with targeted MS, immunoblotting, ELISA, enzyme assays, orthogonal omics data, or an independent sample cohort.
Conclusion
Proteomics data quality assessment is not a cleanup step at the end of analysis. It is a workflow that starts with raw data checks and continues through filtering, normalization, statistical review, and validation. The strongest proteomics studies make QC decisions explicit so that downstream biological conclusions can be trusted.
How to order?

