






How Mitochondrial Proteomics Reveals Oxidative Phosphorylation Changes in Cancer Cells
Mitochondrial proteomics reveals oxidative phosphorylation changes in cancer cells by measuring the abundance of the proteins that build the electron transport chain and ATP synthase, then comparing those levels across defined study arms such as tumor versus control or treated versus untreated.
It shows which OXPHOS subunits and assembly-related proteins increase or decrease at the protein level. It does not measure respiration rate, oxygen consumption, or membrane potential. Those are functional readouts that sit outside this proteomics scope. Read proteomic results as a protein-level map of the OXPHOS machinery, and pair them with functional assays when activity itself must be shown.
What OXPHOS Proteomics Can and Cannot Show
Oxidative phosphorylation depends on five membrane complexes, Complex I through Complex V, together with assembly factors and supporting proteins. Mitochondrial proteomics quantifies these proteins and compares them between conditions.
What it can show:
- Abundance changes in Complex I to Complex V subunits between arms
- Coordinated shifts across a complex or across the chain
- Changes in assembly-related and supporting proteins
- A ranked list of OXPHOS candidates for follow-up
What it cannot show on its own:
- Oxygen consumption rate or respiratory capacity
- Membrane potential or proton-motive force
- Enzyme activity of the respiratory complexes
- Direct proof that ATP output changed
This boundary matters in cancer work, where a shift in OXPHOS protein abundance is often part of the story but is not the same as a measured change in respiration. Keeping the two separate avoids overstating what a protein map can prove.
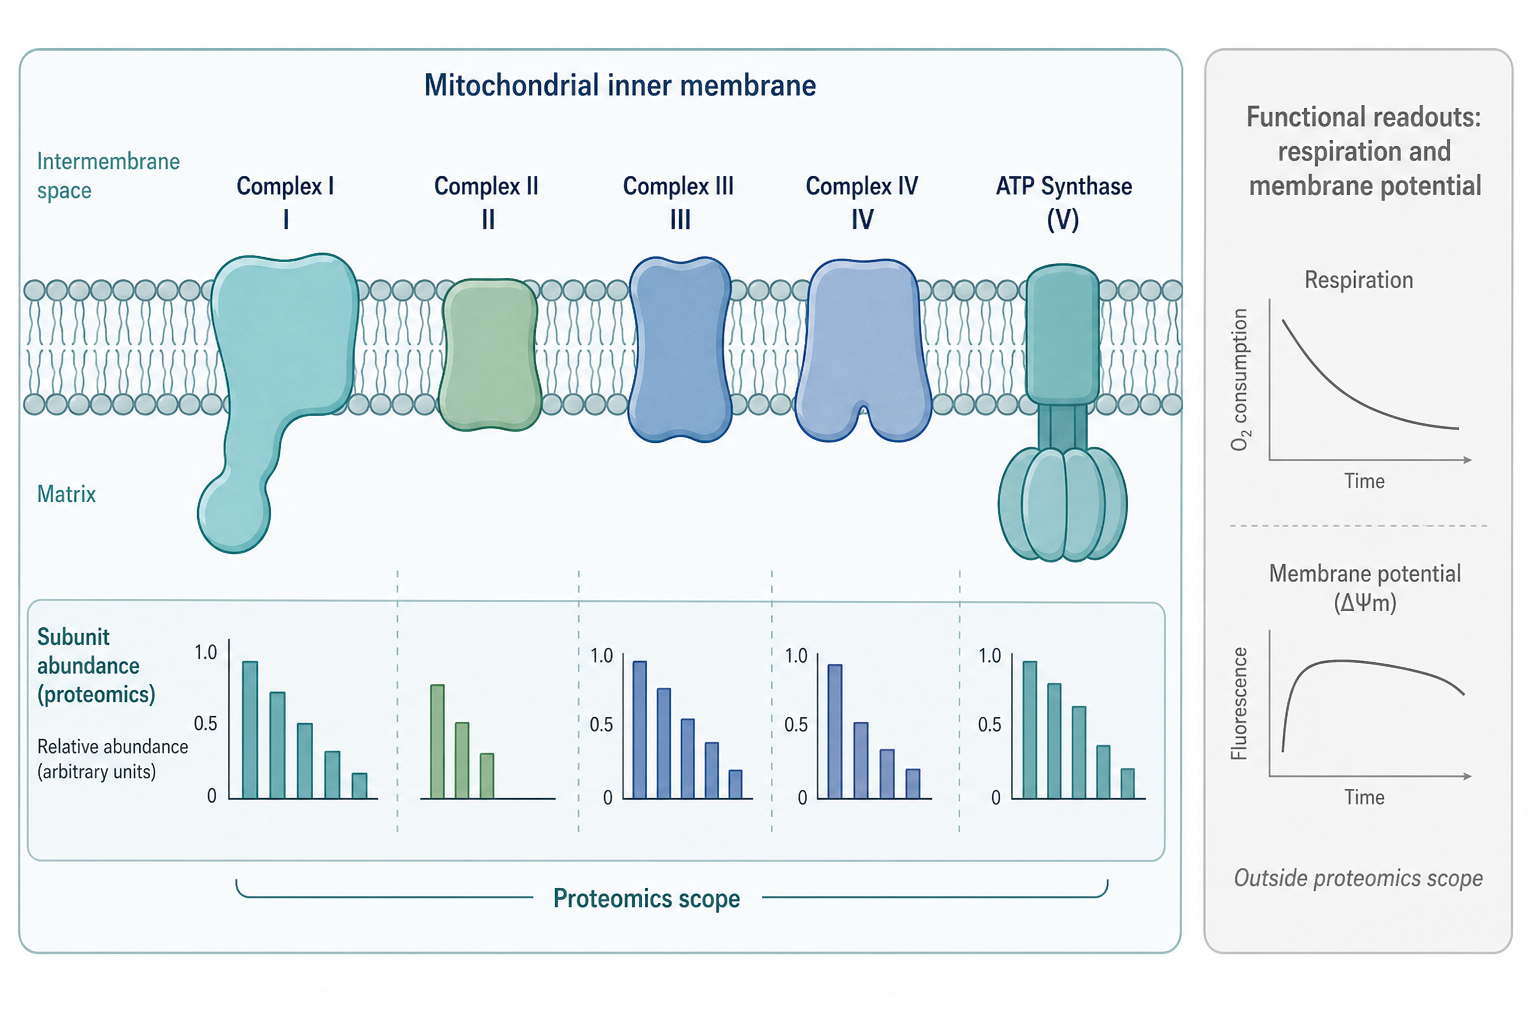
Figure 1. Proteomics quantifies subunits across Complex I to Complex V; respiration and membrane potential remain separate functional readouts.
When This Fits a Cancer OXPHOS Study
|
Research aim |
Fit for mitochondrial proteomics |
Design note |
|---|---|---|
|
Map OXPHOS subunit abundance in tumor versus control |
High |
Prefer enrichment for organelle claims |
|
Compare OXPHOS proteins after drug treatment |
High |
Match handling across arms |
|
Rank OXPHOS candidates for follow-up |
High |
Quantitative route required |
|
Measure oxygen consumption or respiration |
Low |
Needs a functional respiration assay |
|
Confirm membrane potential change |
Low |
Plan a phenotype module separately |
|
Prove ATP output change from one screen |
Low |
Keep claims at protein-abundance level |
How the Analysis Reveals OXPHOS Changes
Quantifying subunits complex by complex
Mitochondrial proteomics groups detected proteins by their OXPHOS complex, so abundance can be read at the level of Complex I, II, III, IV, and V.
What this route contributes:
- Shows whether change is confined to one complex or spread across the chain
- Distinguishes broad OXPHOS remodeling from a narrow subunit shift
- Supports descriptive pathway-level grouping of the results
Keep in mind: grouping subunits by complex describes abundance patterns. It does not confirm that the assembled complex is more or less active.
Comparing across defined arms
Quantitative comparison across arms is what turns a protein list into an OXPHOS change map.
What this route contributes:
- Compares subunit abundance between tumor and control or treated and untreated
- Highlights coordinated up or down patterns across a complex
- Produces ranked candidates linked to the study condition
Keep in mind: abundance differences can come from mitochondrial content changes as well as from per-mitochondrion remodeling. Matched handling and, where relevant, a mitochondrial reference marker help separate these possibilities at a descriptive level. Reporting a broad increase across every complex, for example, often points to more mitochondrial mass rather than selective OXPHOS remodeling, and this distinction should be stated when the pattern appears.
Applications in Cancer Cell Research
Comparing tumor and control OXPHOS profiles
Use mitochondrial-enriched material to map OXPHOS subunit abundance in tumor versus matched control. This fits questions about whether tumor cells raise or lower specific complexes at the protein level.
Tracking OXPHOS proteins under drug treatment
Use treated versus untreated arms to see how OXPHOS subunit abundance shifts after exposure. This fits therapy-adaptation questions where the protein-level response is the target of the screen.
Comparing resistant and sensitive lines
Use resistant versus sensitive comparisons to rank OXPHOS proteins that track with the response phenotype. Treat the output as candidates, not as mechanism.
A common cancer-metabolism pattern is a shift between glycolytic and OXPHOS-leaning states. Proteomics can describe the OXPHOS side of that shift by showing whether respiratory-chain subunits rise or fall across arms, but the glycolytic side and the actual energy balance need their own measurements. Presenting only the protein side keeps the claim within what the data supports.
Functional endpoints such as oxidative phosphorylation activity, membrane potential, ROS, respiratory-chain enzyme activity, calcium flux, permeability transition, autophagy, toxicity scoring, and imaging-based morphology are not part of this proteomics service. When a cancer OXPHOS story needs functional proof, plan those assays as separate experiments and keep them distinct from the protein-abundance claim.
Study Design Notes
Before locking a route, state the OXPHOS claim in plain terms. If the claim is organelle-specific, plan mitochondrial enrichment. If the claim is about abundance differences across arms, plan quantitative mitochondrial proteomics rather than identification alone.
Points worth locking early:
- Define arms clearly: tumor versus control, treated versus untreated, or resistant versus sensitive
- Match enrichment, protein amount, freeze history, and buffer across arms
- Decide whether Phase 1 is a pilot comparison and Phase 2 is a broader cohort
- Separate protein screening from respiration or membrane-potential follow-up
Consistent handling is especially important for OXPHOS work because membrane complexes are sensitive to sample processing. Uneven lysis or freeze history across arms can shift recovery and complicate the comparison.
Sample planning amounts for mitochondrial enrichment work:
- Cells: about 5 x 10^7 cells per sample
- Animal tissue: about 200 mg per sample
- Isolated mitochondrial protein: at least 50 ug, with 80 to 100 ug preferred when possible
- Isolated mitochondrial protein concentration: at least 0.5 ug/uL, with 1 ug/uL or higher preferred when possible
Acquisition mode follows cohort structure after quantification is chosen. DDA suits smaller pilots, with software direction commonly including MaxQuant or Proteome Discoverer. DIA suits broader matched cohorts, with software direction commonly including Spectronaut or DIA-NN. TMT suits predefined multiplexed group maps. Platform discussion can include Orbitrap Exploris 480, timsTOF Pro, and Orbitrap Astral once the route is set.
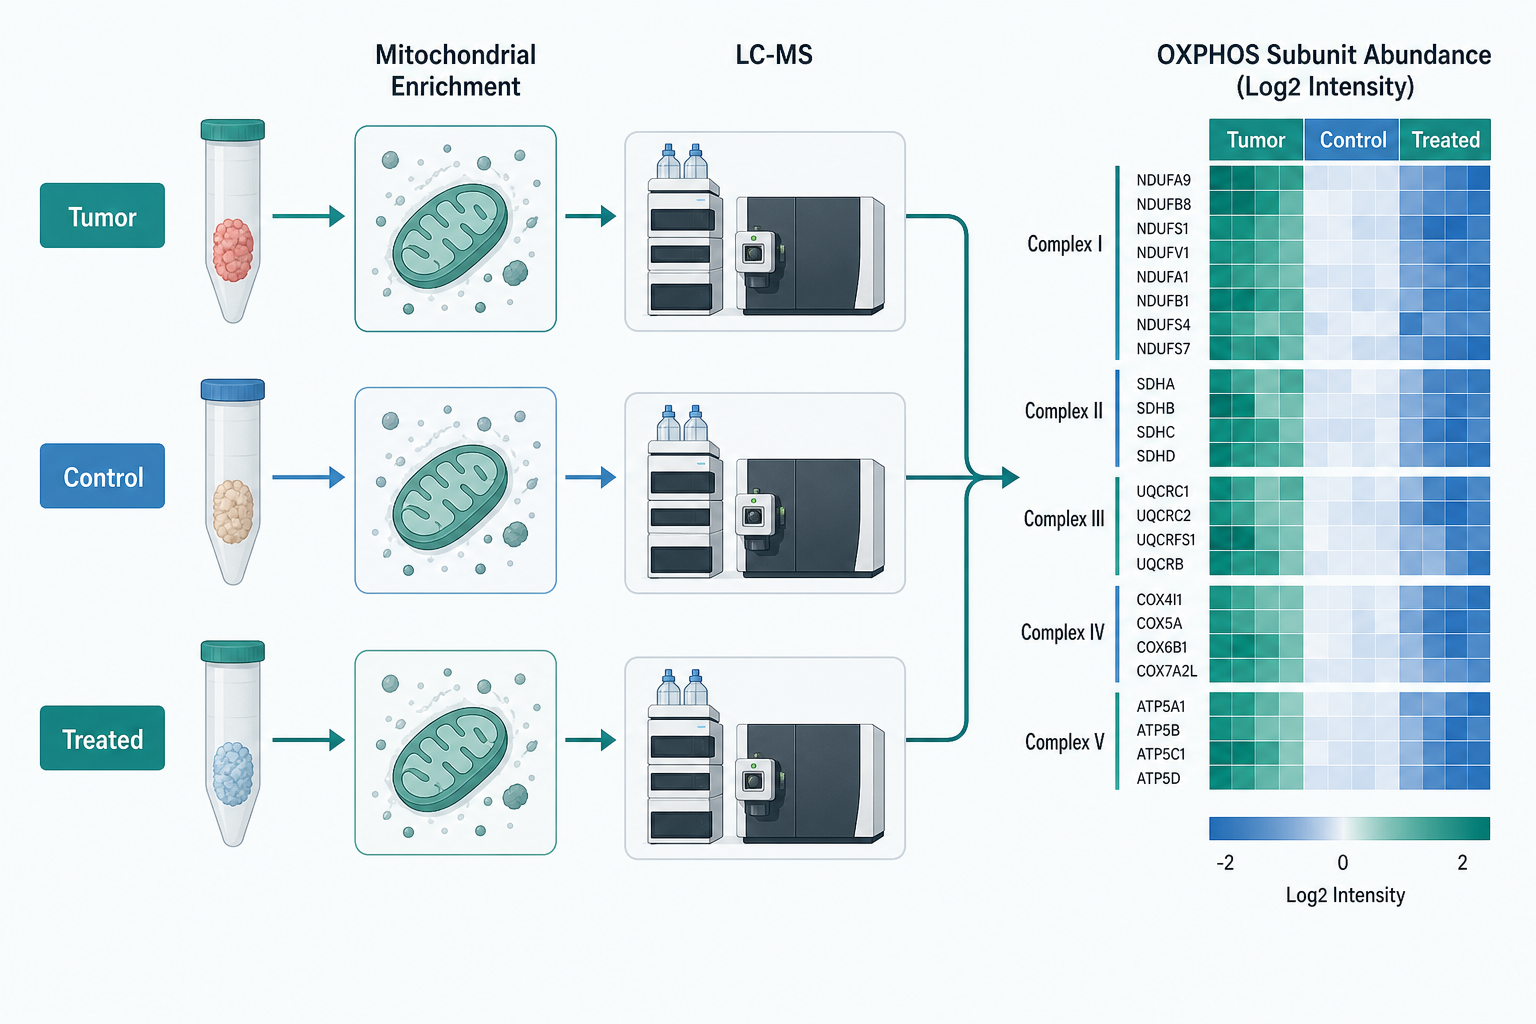
Figure 2. Matched tumor, control, and treated arms produce a comparative OXPHOS subunit map after enrichment.
Reading Results Without Overclaiming
A useful OXPHOS proteomics report answers three practical questions.
Which OXPHOS subunits changed between arms.
Which complexes those subunits belong to at a descriptive level.
Which candidates deserve functional or orthogonal follow-up.
It does not answer whether respiration changed, whether membrane potential shifted, or whether ATP production rose or fell. Those conclusions need functional assays and independent evidence. Stating this boundary in the report protects the strength of the protein-level findings and sets up a clear rationale for any follow-up module.
A practical way to read the report:
- Report OXPHOS results as subunit abundance patterns, not as activity
- Keep organelle claims tied to enrichment quality and matched handling
- Consider mitochondrial content when interpreting broad abundance shifts
- Plan respiration or membrane-potential assays separately when function must be shown
MtoZ Biolabs can review the cancer model, study arms, and expected OXPHOS claim before the analytical route is locked.
Decision Checklist
Confirm the question is about OXPHOS protein abundance, not respiration activity.
Choose enrichment when the claim is organelle-specific.
Choose quantitative mitochondrial proteomics when arms will be compared.
Match sample amounts and handling across every arm.
Group results by complex for descriptive interpretation.
Plan functional respiration or membrane-potential assays separately when activity must be shown.
If the current goal is only to test whether mitochondrial proteomics fits an OXPHOS question in cancer cells, start with a two-arm comparison and a ranked subunit list rather than an open catalog.
Related Services
Mitochondrial Proteomics Service
Mitochondrial Isolation and Mitochondrial Protein Purification Service
Frequently Asked Questions
1. Can mitochondrial proteomics show OXPHOS changes in cancer cells?
Yes, at the protein level. It quantifies OXPHOS subunit abundance and compares it across arms, but it does not measure respiration or activity.
2. Does it measure oxygen consumption?
No. Oxygen consumption and respiratory capacity are functional readouts that need a separate respiration assay.
3. How are results organized?
Detected proteins can be grouped by Complex I to Complex V, so abundance changes are read complex by complex at a descriptive level.
4. Does higher subunit abundance mean higher activity?
Not necessarily. Abundance and activity are different measurements. Activity claims need functional assays.
5. What sample amounts should be planned?
Plan about 5 x 10^7 cells, about 200 mg animal tissue, or isolated mitochondrial protein of at least 50 ug, with 80 to 100 ug preferred when possible.
6. When should functional assays be added?
Add respiration, membrane-potential, or enzyme-activity assays when the study must show OXPHOS function directly, not only protein abundance.
Conclusion
Mitochondrial proteomics reveals oxidative phosphorylation changes in cancer cells as protein-abundance patterns across Complex I to Complex V. Enrichment supports organelle-specific claims, and quantification supports comparison across tumor, control, and treatment arms.
Report these results as subunit abundance rather than activity, keep functional endpoints as separate modules, and read differential proteins as ranked candidates. For project-specific review of a cancer OXPHOS design, contact MtoZ Biolabs with model type, study arms, and the expected analytical claim.
How to order?




