






Disease Biomarker Discovery Antibody Analysis Troubleshooting: Causes, Checks, and Fixes for Research Workflows
Quick Answer
A practical approach to disease biomarker discovery antibody analysis troubleshooting is to isolate the failure source in a defined order: confirm the observed symptom, check antibody specificity and lot behavior, review sample quality and matrix effect, verify the assay window and control strategy, and then reassess normalization and batch effect before using more samples. This sequence helps separate true biological signal from technical noise. If signal appears in only one assay format, disappears after dilution, shifts with an antibody lot change, or fails orthogonal validation, targeted re-optimization is usually more defensible than immediate scale-up.
Why antibody analysis breaks down in disease biomarker discovery workflows
Antibody-based biomarker workflows rarely fail for a single reason. A weak candidate signal may start with low target abundance, but the visible problem is often amplified by limited epitope accessibility, matrix-driven background signal, suboptimal blocking, or normalization choices that make technical variation look biological.
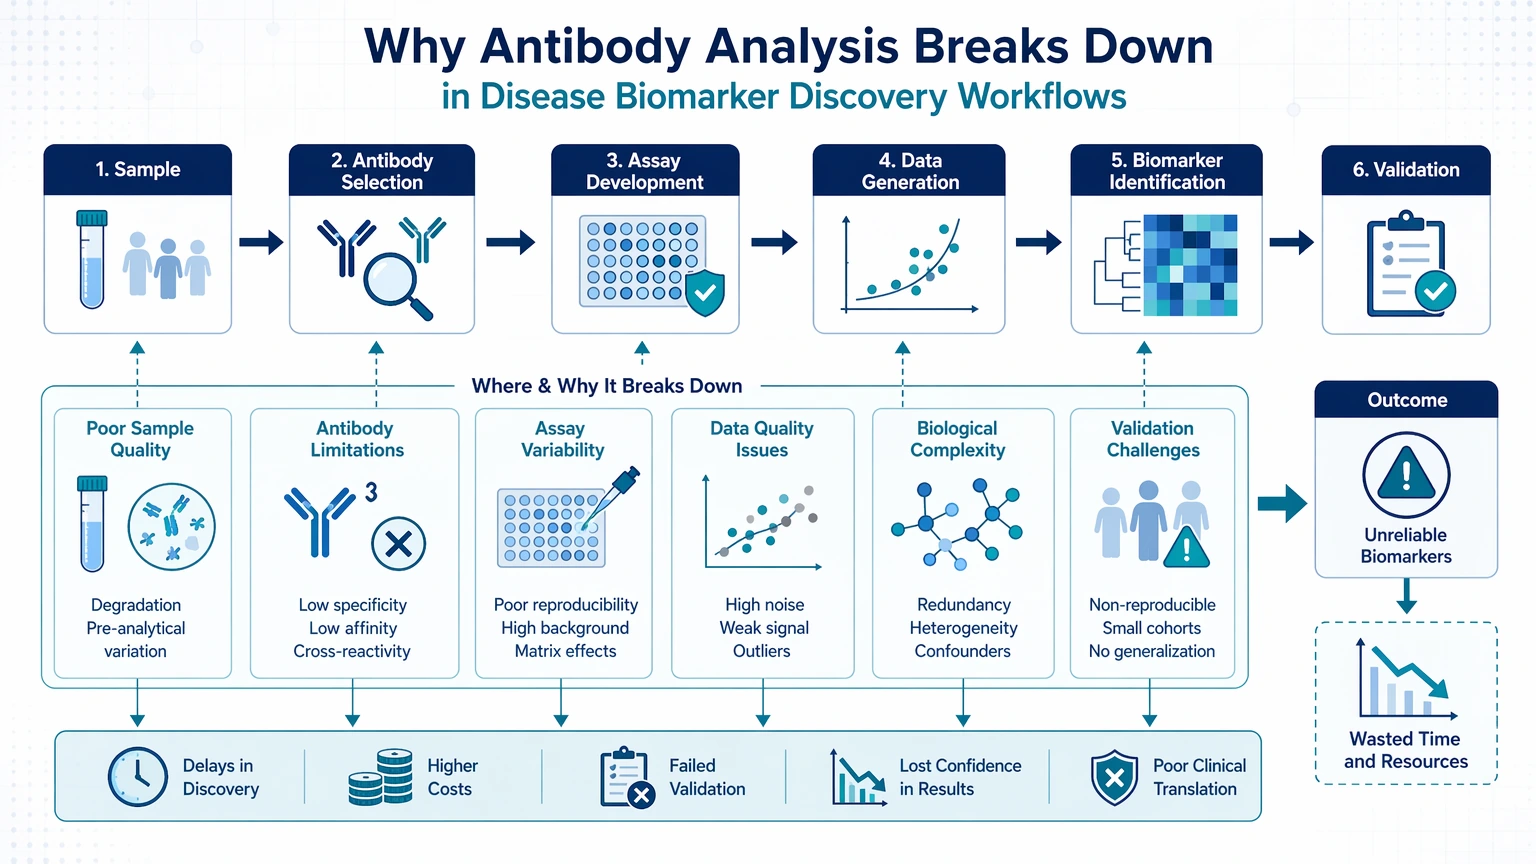
In biomarker discovery, the cost of a misleading result is not limited to one failed run. It can redirect candidate selection, consume scarce patient or preclinical samples, and create avoidable conflict between screening data and follow-up verification. That is why disease biomarker discovery antibody analysis troubleshooting works best when each symptom is tied to a workflow checkpoint rather than treated as an isolated assay problem.
One rule helps prevent unnecessary reruns: do not change several variables at once. If a team adjusts antibody concentration, sample input, wash conditions, thresholds, and normalization in the same repeat experiment, the root cause usually remains unclear.
Common failure symptoms and what they usually indicate
The fastest way to narrow the problem is to start with what the team actually observes.
The table below summarizes the main planning implications for the method choice.
| Observed symptom | What it often indicates | First check |
|---|---|---|
| High background or poor separation | Non-specific binding, matrix effect, excess antibody, insufficient wash stringency | Negative controls, blank wells, dilution series |
| Weak or missing signal | Low target abundance, degradation, epitope masking, narrow assay window | Sample integrity, positive control recovery, detection settings |
| Poor reproducibility | Lot variation, preparation inconsistency, batch effect, instrument drift | Replicate patterns, run logs, lot records |
| Unexpected positives | Cross-reactivity, contamination, threshold error, off-target recognition | Secondary-only control, unrelated sample panel, carryover review |
| Discovery-to-validation mismatch | Platform-dependent epitope behavior, normalization mismatch, weak biological effect | Orthogonal validation plan, cross-platform comparison |
Use these differences to align the analytical method with the biological question and validation plan.
A symptom-first framework keeps troubleshooting anchored to evidence. It also reduces the chance of discarding a usable antibody when the actual failure sits in sample handling, assay setup, or data interpretation.
Antibody-related causes: specificity, affinity, lot consistency, and epitope fit
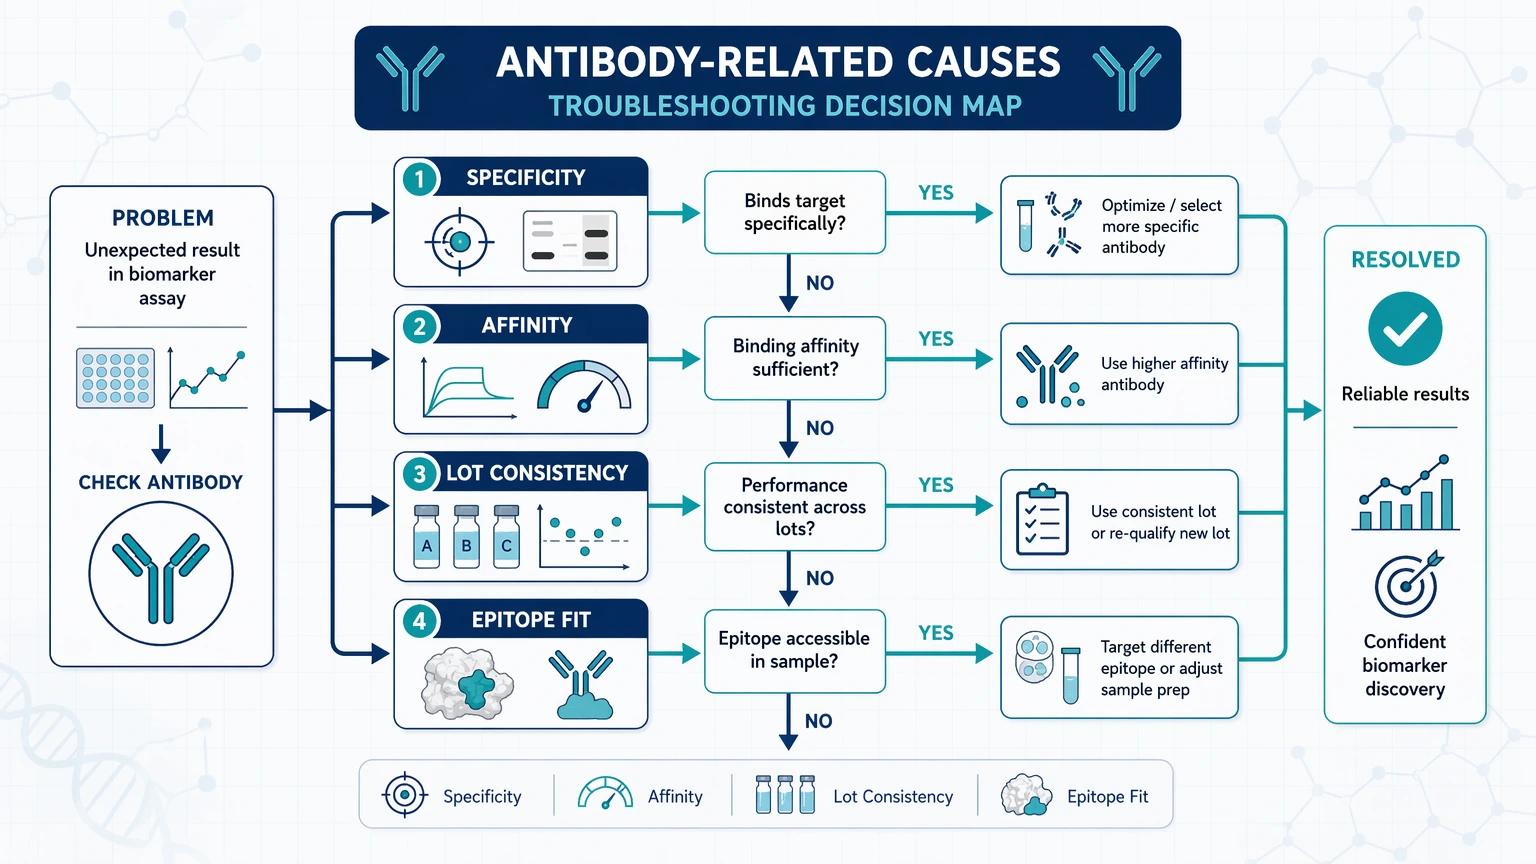
When controls behave unexpectedly or unrelated samples test positive, antibody performance should move to the top of the list. In biomarker discovery, a signal is only useful if the antibody is recognizing the intended target rather than a homolog, fragment, modified form, or matrix component.
Specificity and cross-reactivity
Cross-reactivity often appears as signal in negative samples, inconsistent banding or binding patterns, or positivity in tissues or fluids that do not fit the underlying biology. Start by checking:
- performance in known positive and negative materials
- vendor or internal characterization records
- signal behavior across a relevant dilution range
- secondary-only or isotype controls, where appropriate
- potential off-target binding to related proteins or abundant matrix components
If apparent signal remains stable while target recovery collapses during dilution, non-specific interactions may be driving the readout.
Affinity and target abundance mismatch
An antibody can be specific and still be poorly matched to the study. Low-affinity binding may be workable for abundant targets but inadequate for low-level disease-associated proteins. When target abundance sits near the lower end of the assay window, small handling differences can look like on-off detection.
Useful checks include:
- whether the positive control stays within a measurable dynamic range
- whether replicate variation increases near the lower concentration range
- how often samples fall below detection
- whether signal improves only when antibody concentration is raised enough to also increase background
That pattern usually indicates the assay is being pushed beyond its practical sensitivity range.
Lot-to-lot consistency
Poor reproducibility over time often reflects reagent drift rather than biology. A new antibody lot can alter background signal, shift the dynamic range, or change recovery in a specific matrix. Before revising the full workflow, compare old and new lots on the same aliquoted samples and controls. If the lot change shifts the full signal distribution, the issue is likely reagent-related rather than cohort-related.
Epitope accessibility
Epitope accessibility becomes a major variable when the target is denatured, cleaved, complexed, post-translationally modified, or masked by sample preparation chemistry. This is one reason a biomarker candidate can look convincing in one assay format and disappear in another. If the same sample produces conflicting results across Western blot, ELISA, bead-based assays, or immunoenrichment workflows, ask whether the relevant epitope is exposed in the same way in each format.
Sample-related causes: matrix effects, degradation, abundance range, and handling history
If the antibody behaves acceptably in buffer but not in study material, the sample is often the limiting factor.
Matrix effect in serum, plasma, and tissue lysates
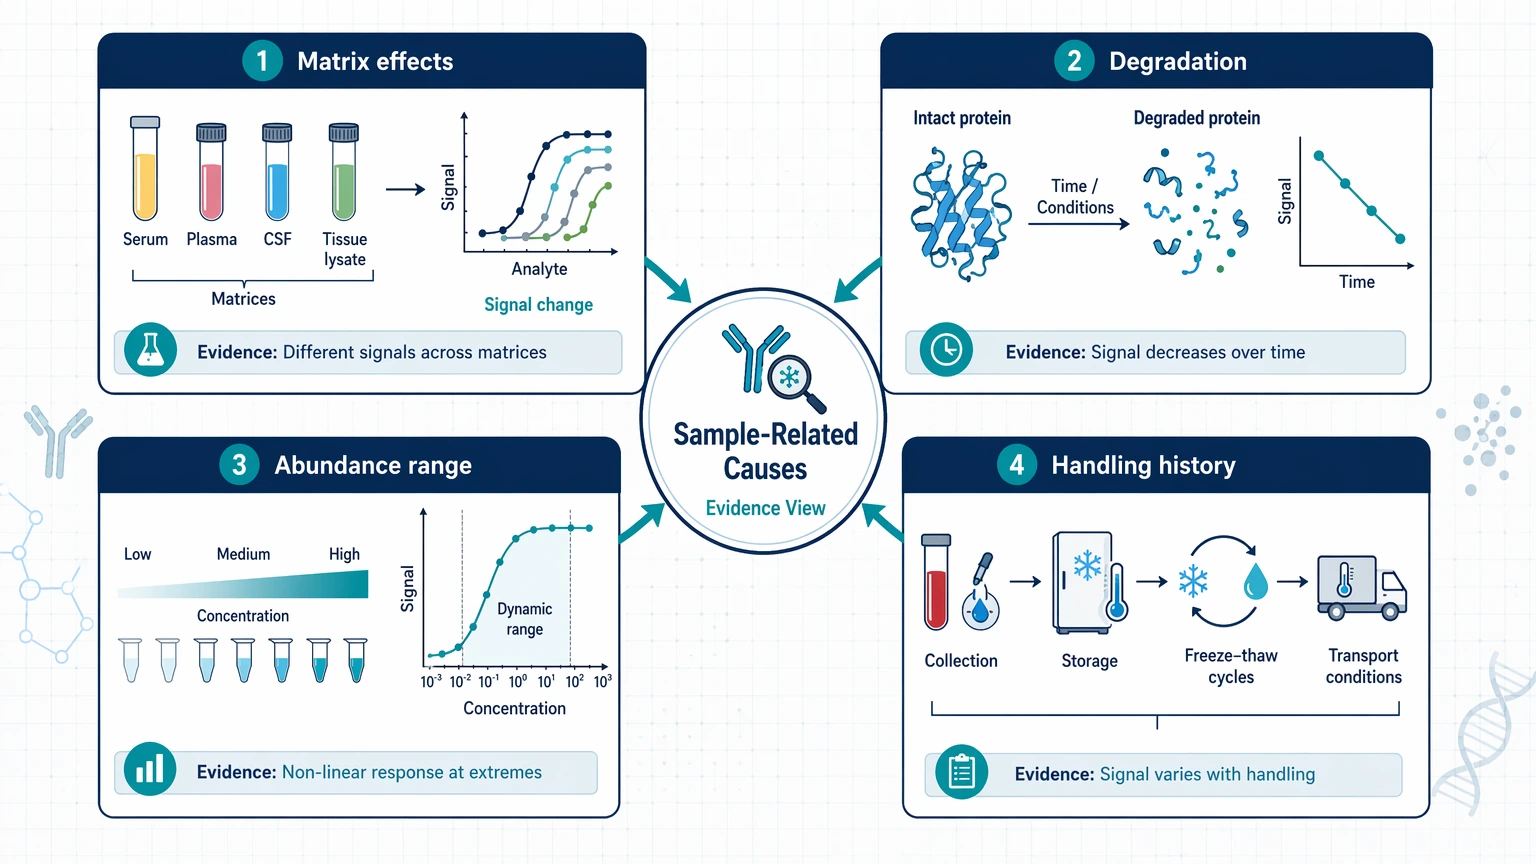
A matrix effect can suppress true signal, increase background signal, or distort dilution behavior. Inflammatory proteins, lipids, hemolysis, complement components, detergents, and high-abundance proteins can all interfere with binding or detection.
Checks that often expose matrix interference include:
- spike-and-recovery comparisons in buffer versus study matrix
- dilution linearity testing across serial dilutions
- side-by-side comparison of serum, plasma, and lysate formats
- monitoring whether background rises with total protein load rather than target concentration
When dilution improves separation more than it reduces true signal, matrix interference becomes a strong possibility.
Degradation and freeze-thaw history
Missing signal may reflect target loss rather than assay failure. Proteolysis, repeated freeze-thaw cycles, delayed processing, and prolonged storage under unstable conditions can reduce intact antigen levels or alter the measured epitope. If older aliquots or one collection batch consistently underperform, compare handling history before changing the assay.
Abundance range and missing-value patterns
Some biomarker candidates fall near the lower quantitation region in one subgroup but not another. That can create misleading missing-value patterns. If one sample class has a much higher below-detection frequency, the difference may reflect biology, but it may also result from inadequate sample input or poor recovery in that matrix. Review missingness together with raw intensity spread rather than treating it as a separate cleanup issue.
Assay design causes: controls, dilution windows, blocking, wash conditions, and detection settings
A suitable antibody and a usable sample can still underperform in a poorly configured assay.
Control strategy
A weak control strategy makes root-cause analysis difficult. For biomarker discovery work, teams usually need enough controls to distinguish non-specific signal, contamination, and assay drift. That often includes:
- blank controls
- negative matrix controls
- positive controls or reference materials
- secondary-only or detection-only controls, where relevant
- inter-run bridging samples for longitudinal studies
If positive and negative controls are not clearly separated, the assay is not ready to support confident biomarker decisions, even if some candidates appear promising.
Dilution windows and assay window
Every assay has a workable concentration range. Outside that assay window, recovery and dilution linearity often deteriorate. Excess sample can increase background signal and create hook-like behavior. Excessive dilution can erase low-abundance targets and inflate replicate variability.
The most useful first check is not always to add more sample. Instead, confirm whether signal tracks proportionally through a dilution series and whether controls stay within the usable dynamic range.
Blocking, washing, and detection settings
High background often comes from setup choices that can be tested directly:
- insufficient blocking time or poorly matched blocking chemistry
- wash conditions that leave loosely bound material behind
- primary or secondary antibody concentrations that are too high
- exposure or gain settings that compress real separation
- plate handling inconsistencies that introduce edge or evaporation effects
These factors should be tested one at a time. Change a single parameter, document the shift in signal-to-background separation, and keep a record of what actually improves reproducibility.
If your team still sees unresolved inconsistency after these targeted checks, you can submit your requirements to MtoZ Biolabs and evaluate your project in the context of sample type, assay format, and verification goals before using another limited sample set.
Data analysis causes: normalization, thresholding, batch effects, and cross-platform mismatch
Not all troubleshooting belongs at the bench. In some cases, the assay is workable, but the analysis pipeline turns manageable variation into false confidence or false failure.
Normalization drift
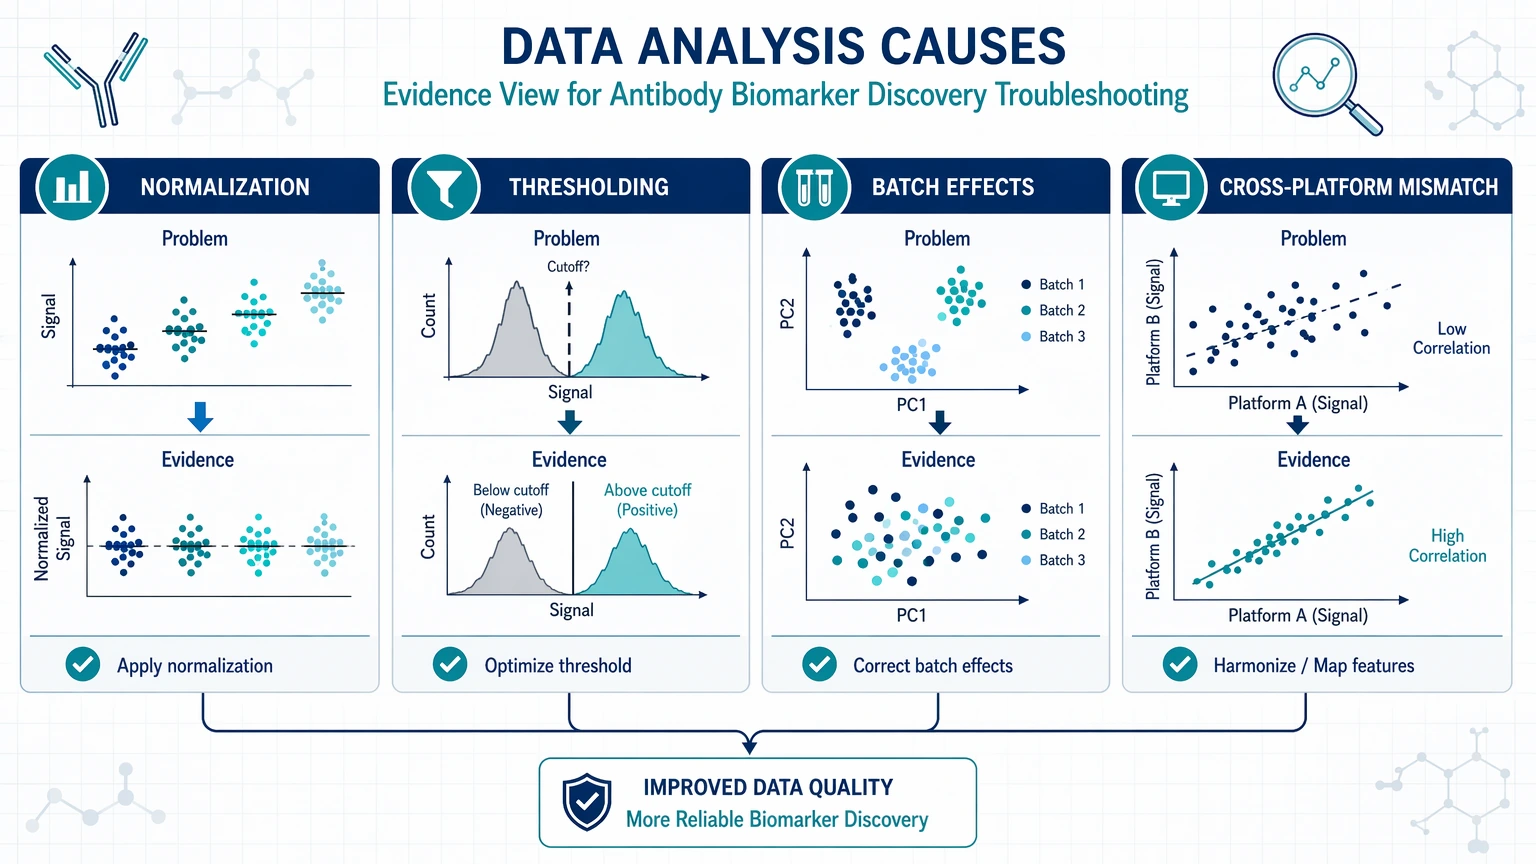
Normalization should reduce technical variation without obscuring biology. Problems arise when a reference feature is unstable across disease states, when sample processing differs between batches, or when total-signal scaling compresses real group differences.
A practical review should ask:
- Did normalization improve replicate consistency or only flatten the distribution?
- Are control samples still separated after normalization?
- Does sample rank order remain biologically plausible?
- Are outliers driving the apparent improvement?
Threshold setting and false positives
Unexpected positives can result from threshold choices rather than binding biology. A cutoff that appears reasonable in one cohort may overcall another if background distributions shift. Check thresholds against control separation, blank behavior, and below-detection frequency instead of copying them from an earlier experiment.
Batch effect
A batch effect becomes likely when samples cluster by run date, operator, plate, instrument, or reagent lot rather than study group. This is especially damaging in translational studies when cases and controls were not randomized across processing blocks. If the batch structure is visible in QC plots or replicate drift, more testing may only compound the confusion.
Cross-platform mismatch
A biomarker candidate supported by only one assay principle should still be treated as provisional. Differences in capture format, epitope accessibility, calibration approach, and matrix tolerance can all change the apparent result. Cross-platform mismatch does not automatically disprove the candidate, but it does require the team to define what each platform is actually measuring.
A stepwise troubleshooting checklist for root-cause isolation
Use this sequence before committing more samples or budget:
1. Define the dominant failure mode. Decide whether the main issue is background signal, weak signal, reproducibility, unexpected positives, or discovery-to-validation mismatch. 2. Lock a reference sample set. Use aliquoted controls and representative study samples for all comparisons. 3. Check antibody behavior first. Review specificity, cross-reactivity, lot records, and dilution response. 4. Test matrix effect. Run recovery and dilution linearity in buffer and in the actual study matrix. 5. Verify the assay window. Confirm that controls and representative samples fall within a usable dynamic range. 6. Audit the control strategy. Make sure the assay includes controls that isolate binding, detection, and contamination issues. 7. Review handling history. Look for degradation risk, freeze-thaw differences, and inconsistent preparation. 8. Inspect batch structure. Compare run date, operator, instrument, and lot against observed variance. 9. Reassess normalization and thresholds. Confirm that they improve interpretation without distorting sample ranking. 10. Escalate to orthogonal validation when the biology remains plausible but assay logic is still uncertain.
A structured checklist is also the point where outside technical review becomes useful. Teams often need to determine whether the main bottleneck sits in antibody performance, complex sample behavior, assay configuration, or downstream interpretation before repeating the full workflow.
When to confirm findings with orthogonal or higher-resolution analytical methods
Orthogonal validation makes sense when the biology remains credible but the antibody workflow cannot clearly establish specificity, reproducibility, or cross-platform agreement.
Typical triggers include:
- a strong discovery signal that disappears in a second immunoassay
- persistent concern about cross-reactivity
- inconsistent recovery or dilution linearity in complex matrices
- unresolved disagreement between replicate trends and normalized outputs
- a need to distinguish isoforms, fragments, or modified proteins that may share antibody recognition
Orthogonal methods do not automatically fix the project, but they can clarify whether the observed signal maps to the intended target. In protein biomarker studies, that may mean adding a higher-resolution confirmation step instead of repeatedly tuning the same immunoassay conditions.
Service Routes for Study Planning
For teams moving from method selection into execution, these service paths connect assay design, validation, and interpretation needs.
Conclusion
The most defensible approach to disease biomarker discovery antibody analysis troubleshooting is to narrow the problem in stages: identify the visible symptom, test antibody specificity and epitope fit, challenge the sample for matrix effect and degradation, confirm the assay window and control strategy, and then review normalization and batch effect before interpreting biology. This process is especially useful when samples are limited and the team must decide whether to rerun, re-optimize, replace reagents, or move to orthogonal validation.
This framework also has limits. It will not rescue a candidate with no reproducible biological signal, and it does not replace sound study design or proper controls. When repeated internal adjustments still leave uncertainty about specificity, matrix interference, or cross-platform credibility, contact us at MtoZ Biolabs to discuss antibody analysis bottlenecks, orthogonal confirmation options, or workflow redesign for biomarker discovery studies.
FAQ
How can a team distinguish antibody-driven background from matrix-driven background?
Compare the same assay setup across buffer, a simplified control matrix, and the actual study matrix. If background rises mainly in the biological matrix, a matrix effect is more likely. If elevated signal also appears in blanks or buffer-only conditions, excess antibody concentration, weak blocking, or cross-reactivity becomes more likely.
What is the fastest way to investigate a sudden drop in reproducibility between runs?
Use a bridging run with the same aliquoted samples, the same controls, and both old and new reagent lots if they are available. This design can separate reagent drift from sample preparation variation or instrument-related batch effect without introducing new biological variability.
Why can a biomarker candidate look convincing in one antibody assay and collapse in another?
Different assays may not measure the same molecular state. Epitope accessibility, target conformation, fragmentation, post-translational modification, and calibration design can all shift the apparent result. Before rejecting the candidate, define what each assay is actually detecting.
When is dilution linearity more informative than a single recovery experiment?
A single recovery check can look acceptable at one spike level even when the assay behaves unpredictably across the working range. Dilution linearity shows whether signal changes proportionally as the sample is diluted, which makes it useful for identifying matrix interference, hook-like effects, and dominant non-specific binding.
What should a team review before replacing an antibody after unexpected positives appear?
Review the thresholding logic, control integrity, carryover risk, and cross-reactivity evidence first. Repeat the signal pattern using negative panels, secondary-only controls, and a dilution series. If the same biologically implausible positivity persists under those conditions, replacing the antibody or adding orthogonal validation becomes a more justified next step.
How to order?




