






Affinity Purification Mass Spectrometry and Network Analysis to Understand Protein-Protein Interactions
Introduction
Protein-protein interaction research rarely stops at a single binding partner. Signaling pathways, macromolecular complexes, and disease mechanisms are organized as networks in which one bait protein may connect to many associated proteins, shared hubs, and condition-specific modules. Affinity purification mass spectrometry (AP-MS) can generate those candidate interactor lists at scale, but a ranked protein table alone does not explain how partners relate to one another or which biology the data support.
Network analysis converts AP-MS interactor evidence into structured interaction models. Nodes represent proteins, edges represent supported associations, and downstream enrichment or module detection helps place the bait-centered interactome into pathways, complexes, and functional context. This article explains how AP-MS and network analysis work together to understand protein-protein interactions, what decisions matter at each step, and how to move from discovery lists to biologically interpretable interaction networks.
What AP-MS Contributes to PPI Discovery
AP-MS uses bait-directed affinity capture followed by LC-MS/MS to identify proteins that copurify with a target under defined conditions.
The method is well suited to bait-centered discovery because it enriches associated proteins before mass spectrometry readout. Typical output includes identified proteins in bait and control purifications, quantitative bait-to-control ratios, and filtered candidate interactor lists after replicate review and contaminant filtering.
AP-MS identifies proteins that associate with the bait under the purification conditions used. It does not by itself define network topology, direct versus indirect binding, or functional coupling among recovered partners. Those questions require structured data integration and network interpretation after the MS step.
Why Network Analysis Is Needed After AP-MS
An AP-MS hit list can contain dozens or hundreds of proteins. Without network context, it is difficult to distinguish a coherent complex from a mixture of background binders, shared contaminants, and secondary associations.
Network analysis helps in several ways. It organizes interactors around the bait and reveals shared partners across baits or conditions. It highlights hub proteins that connect multiple candidates and may represent core complex components or pathway scaffolds. It supports module detection when groups of interactors cluster by function, localization, or co-enrichment pattern. It connects the interactor set to gene ontology, pathway databases, and published interaction resources so biological interpretation becomes explicit rather than anecdotal.
For protein-protein interaction studies, the value of AP-MS increases when results are treated as input to an interactome model rather than as a flat identification report.
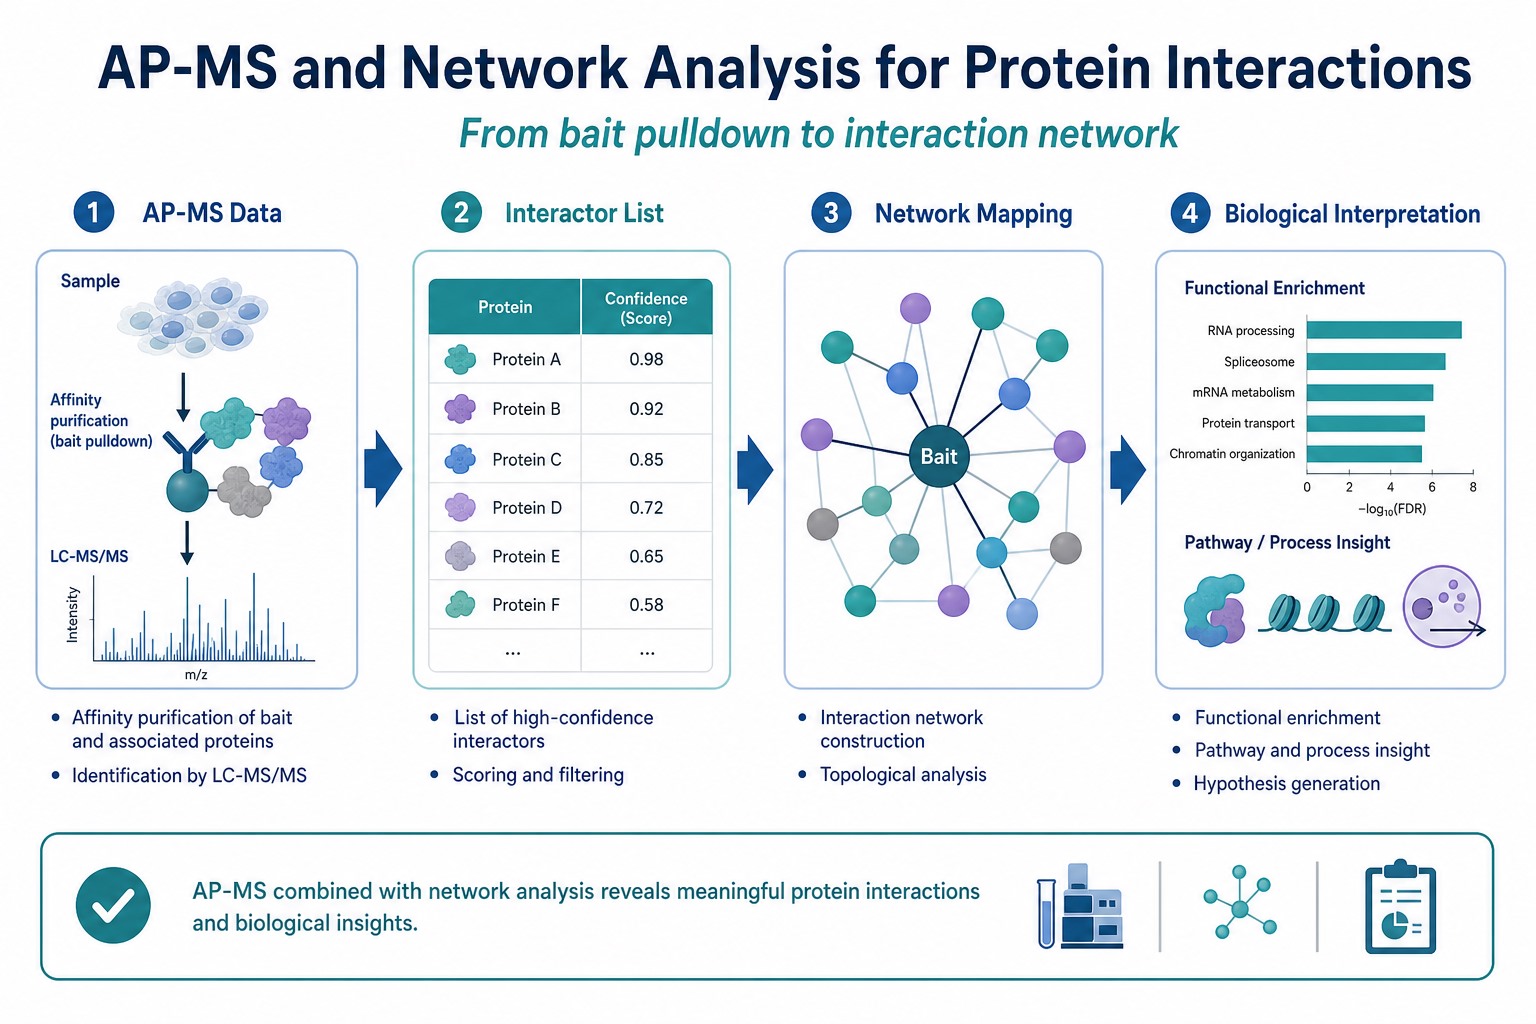
Figure 1. AP-MS generates interactor evidence that network analysis converts into structured protein interaction models.
From Interactor Lists to Interaction Networks
Moving from AP-MS tables to networks requires explicit rules at each layer.
Interactor filtering applies bait-control contrast, replicate consistency, and contaminant databases to retain likely specific partners. Edge definition assigns links between proteins based on co-enrichment in the same AP-MS experiment, overlap across related baits, or integration with curated interaction databases when appropriate. Node annotation adds protein names, accession identifiers, abundance scores, and condition labels needed for downstream review. Network construction builds a graph in which the bait, recovered interactors, and optionally known pathway neighbors are connected according to the chosen evidence rules. Functional mapping overlays gene ontology terms, pathway membership, and complex annotations to interpret modules and prioritize validation targets.
Weak filtering at the interactor stage propagates noise into the network. Strong controls and transparent edge criteria are therefore as important as the visualization step.
Standard Workflow for AP-MS Network Analysis
A practical AP-MS network workflow follows a linked sequence.
Experimental design defines bait format, control purifications, replicate number, and treatment groups before sample intake. AP-MS execution performs affinity capture, digestion, LC-MS/MS, and quantitative comparison against controls. Interactor nomination filters proteins by specificity scores, spectral counts, or label-free quantification ratios. Network assembly connects bait and interactors, optionally expands with public PPI databases, and reviews edge confidence. Module and pathway analysis identifies clusters, enriched processes, and candidate complex subunits. Validation planning selects direct binding tests, reciprocal AP-MS, or orthogonal interaction assays for high-priority nodes and edges.
Network analysis should be planned alongside AP-MS design so controls, replicates, and metadata support meaningful graph construction.
Related Services
Fusion Protein Interaction Analysis Service | Pull-Down and MS
MS-Based Protein-Protein Interaction Analysis Service
Pull Down based Protein Analysis Service with Mass Spectrometry
Co-Immunoprecipitation Protein Interaction Analysis Service
Protein Identification Service
Researchers planning AP-MS with network interpretation can consult MtoZ Biolabs to align bait design, LC-MS/MS analysis, and interactor review with downstream protein interaction mapping goals.
Core Elements of PPI Network Analysis
Network models become useful when each component is defined clearly.
Nodes
Nodes represent proteins in the AP-MS-derived interactome. The bait is usually treated as a central node. Interactors become first-order neighbors unless expanded using database-supported links.
Edges
Edges represent supported associations. In AP-MS-only networks, edges often reflect co-enrichment with the same bait or shared recovery across related baits. Database-supported edges may be added with explicit confidence labels to avoid overstating direct binding.
Modules and hubs
Module detection groups densely connected proteins that may correspond to stable complexes or functional subnetworks. Hub proteins with many connections can indicate scaffolds, chaperones, or frequent background binders and require careful review.
Functional context
Gene ontology, Reactome, KEGG, and complex-centric resources help translate network topology into testable biology such as signaling cascades, chromatin regulation, or membrane trafficking.
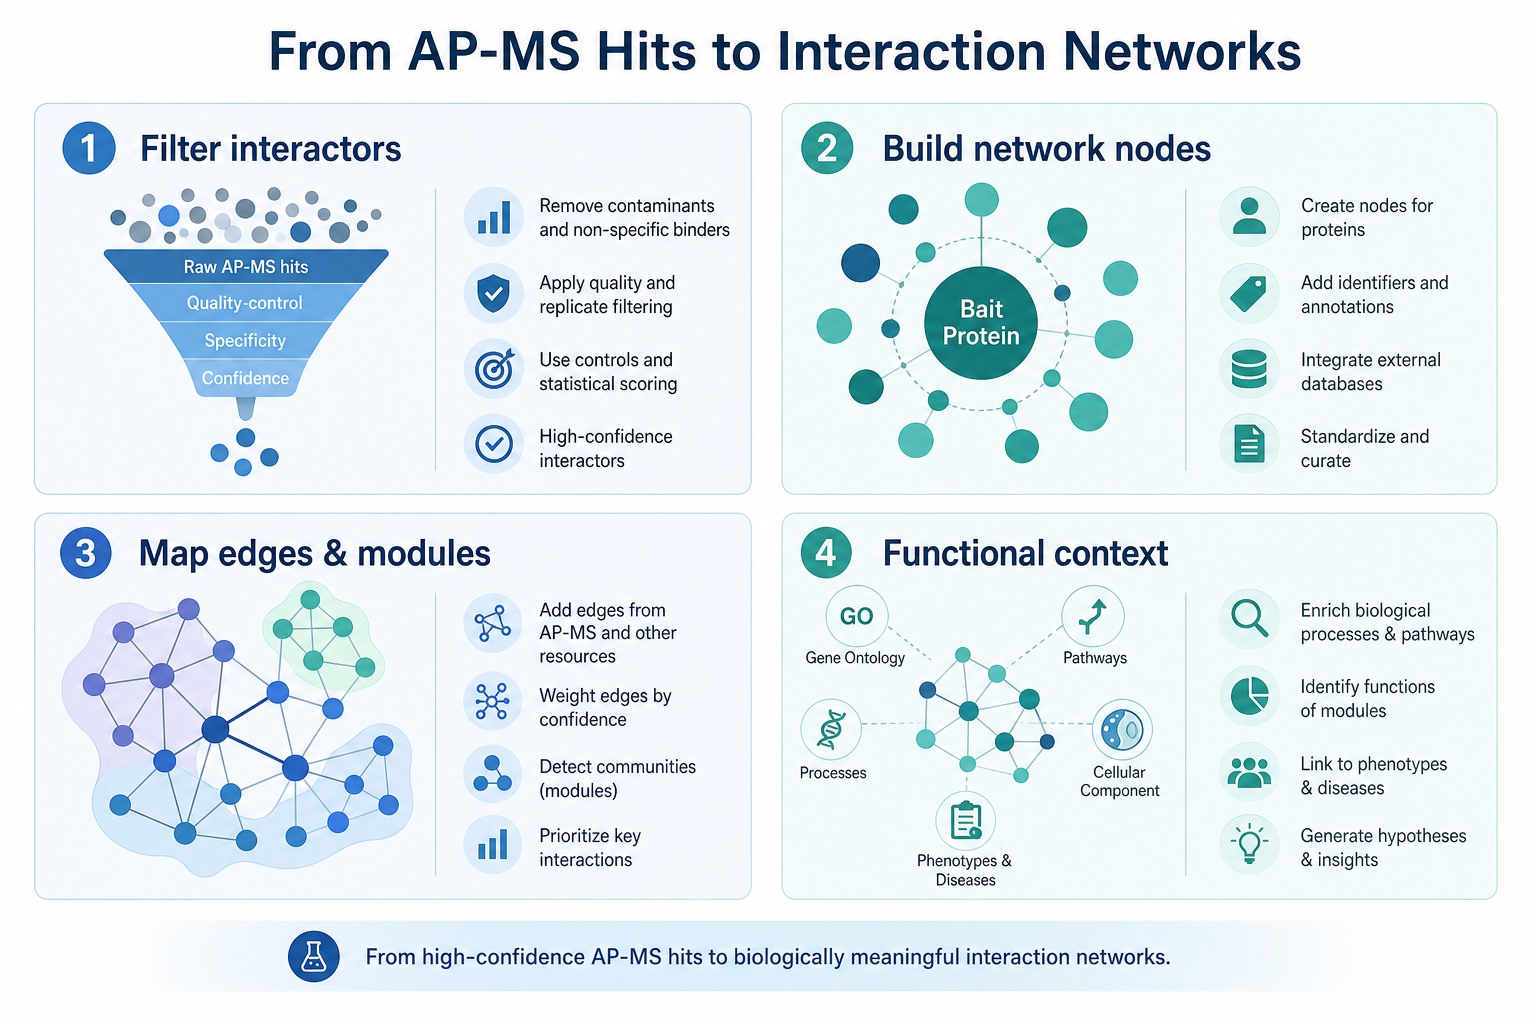
Figure 2. AP-MS network analysis moves from filtered interactors to modules, edges, and functional interpretation.
Network Analysis Approaches by Study Goal
Different PPI questions favor different network strategies.
|
Study Goal |
AP-MS Input |
Network Focus |
Typical Next Step |
|---|---|---|---|
|
Bait-centered interactome mapping |
Single bait plus controls |
First-order neighbors and modules |
Reciprocal AP-MS or Co-IP |
|
Complex subunit organization |
Tagged complex component |
Dense module around bait |
Mutagenesis mapping |
|
Condition-specific PPI remodeling |
Treatment versus vehicle AP-MS |
Differential nodes and edges |
Targeted validation of changed partners |
|
Pathway expansion |
Multiple related baits |
Shared interactors and hubs |
Functional assays in pathway context |
|
Target discovery |
Drug-treated AP-MS |
Network shift and node loss or gain |
Orthogonal binding confirmation |
The table links experimental intent to network design. It does not replace project-specific control planning.
Integrating AP-MS Data with Public Interaction Resources
AP-MS networks gain interpretive depth when experimental and curated data are combined carefully.
Public protein interaction databases, complex repositories, and pathway maps can place AP-MS hits into known biological neighborhoods. Integration is most reliable when database edges are labeled by evidence type and not merged silently with AP-MS-derived associations. A common practice is to build an experiment-first network from AP-MS specificity filters, then overlay published interactions to suggest indirect links, complex membership, or pathway adjacency.
This layered approach helps teams distinguish proteins that directly copurify with the bait from partners connected only through literature-supported paths.
Core Technical Advantages and Current Limitations
Core Technical Advantages
Bait-centered discovery at proteome scale.
AP-MS can recover many candidate interactors in one experiment, providing rich input for network construction.
Quantitative contrast improves node selection.
Bait-control and condition comparisons help prioritize nodes before graph assembly.
Network view reveals structure beyond lists.
Modules, hubs, and shared partners expose complex and pathway organization that tables alone may hide.
Functional mapping supports hypothesis generation.
Enrichment analysis connects interaction topology to processes that guide validation design.
Current Limitations
AP-MS edges are not always direct interactions.
Co-enrichment does not prove binary binding without follow-up assays.
Background proteins can appear as false hubs.
Sticky contaminants and abundant binders require strict filtering before network interpretation.
Database integration can overstate confidence.
Published interactions must be distinguished from experiment-derived edges.
Network completeness depends on AP-MS depth.
Low-abundance partners missed in MS will be absent from the graph.
Applications in Protein Interaction Research
AP-MS combined with network analysis supports several research programs.
Signaling pathway mapping places a bait kinase, receptor, or adaptor into a broader interaction neighborhood and highlights condition-specific remodeling. Complex biology studies use module detection to propose subunits and accessory factors around tagged components. Disease mechanism research compares interactomes from mutant, knockout, or patient-relevant models to identify rewired nodes. Drug target discovery reviews network shifts after compound treatment to prioritize engagement-linked partners. Validation pipeline design uses network centrality and functional enrichment to rank Co-IP, pull-down, or mutagenesis follow-up experiments.
Application value depends on control quality, replicate design, and whether network edges are reported with transparent evidence levels.
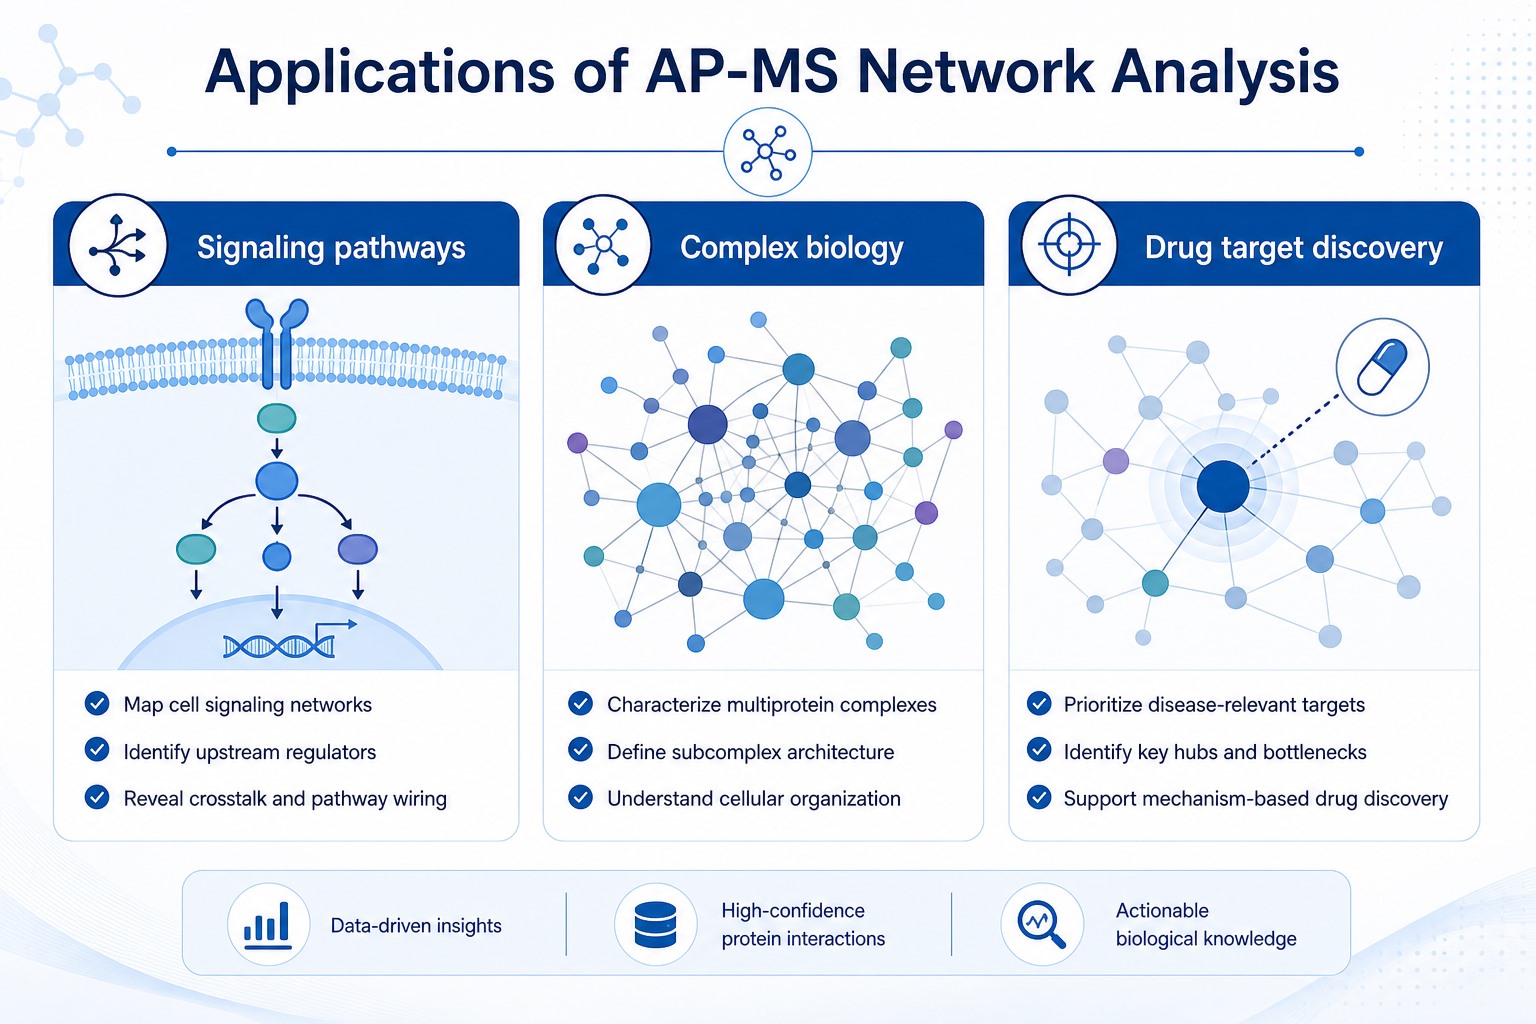
Figure 3. AP-MS network analysis supports pathway mapping, complex biology, and target discovery workflows.
Expected Deliverables from an AP-MS Network Project
A useful AP-MS network report should extend beyond a protein identification spreadsheet.
Typical deliverables include filtered interactor tables with bait-control support and replicate summary. Network files or figures showing nodes, edges, and bait-centered topology. Module or cluster summaries when density-based grouping is performed. Functional enrichment results for gene ontology, pathway, or complex terms linked to the interactor set. A validation priority list distinguishing high-confidence nodes from lower-confidence or database-supported connections. Method documentation covering bait design, controls, MS analysis, filtering thresholds, and network construction rules.
Reporting should separate AP-MS-derived associations from literature-supported links and from confirmed direct interactions.
Frequently Asked Questions
1. What is the role of network analysis in AP-MS studies?
It organizes AP-MS interactor lists into structured graphs so researchers can see modules, shared partners, and functional context around a bait protein.
2. Does an AP-MS network prove direct protein-protein interactions?
No. Network edges based on co-enrichment indicate association under the purification conditions used. Direct binding requires orthogonal validation.
3. Can AP-MS networks be built from a single replicate?
A preliminary network is possible, but replicate AP-MS data greatly improve confidence in node selection and reduce false hub formation.
4. Should public PPI databases be included in the network?
They can add useful context when evidence types are labeled clearly. They should not be merged with experimental edges without distinction.
5. What is the usual next step after AP-MS network analysis?
Teams typically validate prioritized nodes by reciprocal AP-MS, Co-IP, pull-down, or targeted binding assays before making direct interaction claims.
Conclusion
Affinity purification mass spectrometry and network analysis address complementary layers of protein-protein interaction research. AP-MS generates bait-centered interactor evidence at sequence level, while network analysis converts that evidence into interpretable interaction topology, modules, and functional context. Together they help researchers move from discovery lists to structured interactome models that support pathway analysis, complex mapping, and validation planning.
Programs that define control strategy, filtering rules, and network evidence criteria before sample analysis obtain clearer graphs and more actionable PPI hypotheses. Researchers planning AP-MS with network interpretation can contact MtoZ Biolabs to review bait design, LC-MS/MS analysis, and interactor-to-network reporting suited to their interaction study. For teams advancing from AP-MS discovery to validated interaction models, MtoZ Biolabs can also support integrated pull-down MS analysis and follow-up interaction confirmation workflows.
How to order?




