






Why Mass Spectrometry Proteomics Results Vary: Key Factors Behind Protein Coverage, Quantification, and Data Confidence
Introduction
Two mass spectrometry proteomics projects can follow the same general workflow and still produce different protein counts, different fold-change values, and different confidence levels in the final report. One laboratory may identify 4,200 proteins in a cell lysate while another reports 2,800 from a similar sample. A quantitative comparison may show strong treatment effects in one cohort and weak reproducibility in another. A peptide mapping report may assign high-confidence coverage in one run and leave critical regions unsupported in a repeat analysis. These differences are common enough that proteomics teams often ask whether the instrument, the sample, or the analysis pipeline is responsible.
Mass spectrometry proteomics results vary because protein coverage, quantification, and data confidence are controlled by linked experimental and computational factors rather than by a single instrument setting. Sample preparation, digestion efficiency, chromatographic performance, acquisition mode, search parameters, false discovery rate thresholds, and replicate design all influence the same dataset in different ways. Understanding why results vary helps teams interpret proteomics reports, compare studies more critically, and design projects that reduce unwanted technical noise.
Why Variation Is Expected in Mass Spectrometry Proteomics
Variation in proteomics is not always a sign of failure. Some differences reflect real biological change. Others reflect technical factors that can be reduced with better experimental design.
Bottom-up proteomics does not measure intact proteins directly in standard discovery workflows. Protein identities are inferred from peptides, and peptide detection is stochastic in data-dependent acquisition because the instrument cannot fragment every precursor in a complex mixture. Quantification is peptide-based, so missing peptides, shared peptides across protein families, and normalization choices can shift reported abundance values. Confidence depends on spectral quality, database completeness, and the stringency of filtering applied after database searching.
Because these layers are connected, a change in digestion protocol can alter both coverage and quantitation. A shorter LC gradient can reduce identification depth while also changing label-free alignment. A more permissive search may increase protein counts while reducing confidence in low-scoring matches. Interpreting proteomics variation therefore requires separating biological signal from technical drivers.
Key Factors Behind Protein Coverage Differences
Protein coverage in mass spectrometry proteomics refers to how many proteins are identified and how completely each protein is represented by supporting peptides.
Sample complexity and abundance range are primary drivers. Highly abundant proteins produce more tryptic peptides and more MS/MS spectra, while low-abundance proteins may never be selected for fragmentation in data-dependent acquisition. Plasma, serum, and other biofluids often show lower coverage for signaling proteins unless depletion or enrichment is applied.
Digestion efficiency affects which peptides enter the LC-MS/MS system. Incomplete reduction and alkylation, suboptimal enzyme-to-protein ratio, and post-digestion losses can reduce peptide yield for specific proteins. Proteins with few tryptic peptides, including many membrane proteins and small proteins, are inherently harder to detect repeatedly.
Chromatographic separation and acquisition strategy also shape coverage. Gradient length, column performance, and loading amount change how many peptides are sampled per run. Data-dependent acquisition may undersample low-abundance peptides, while data-independent acquisition depends on library quality and search depth.
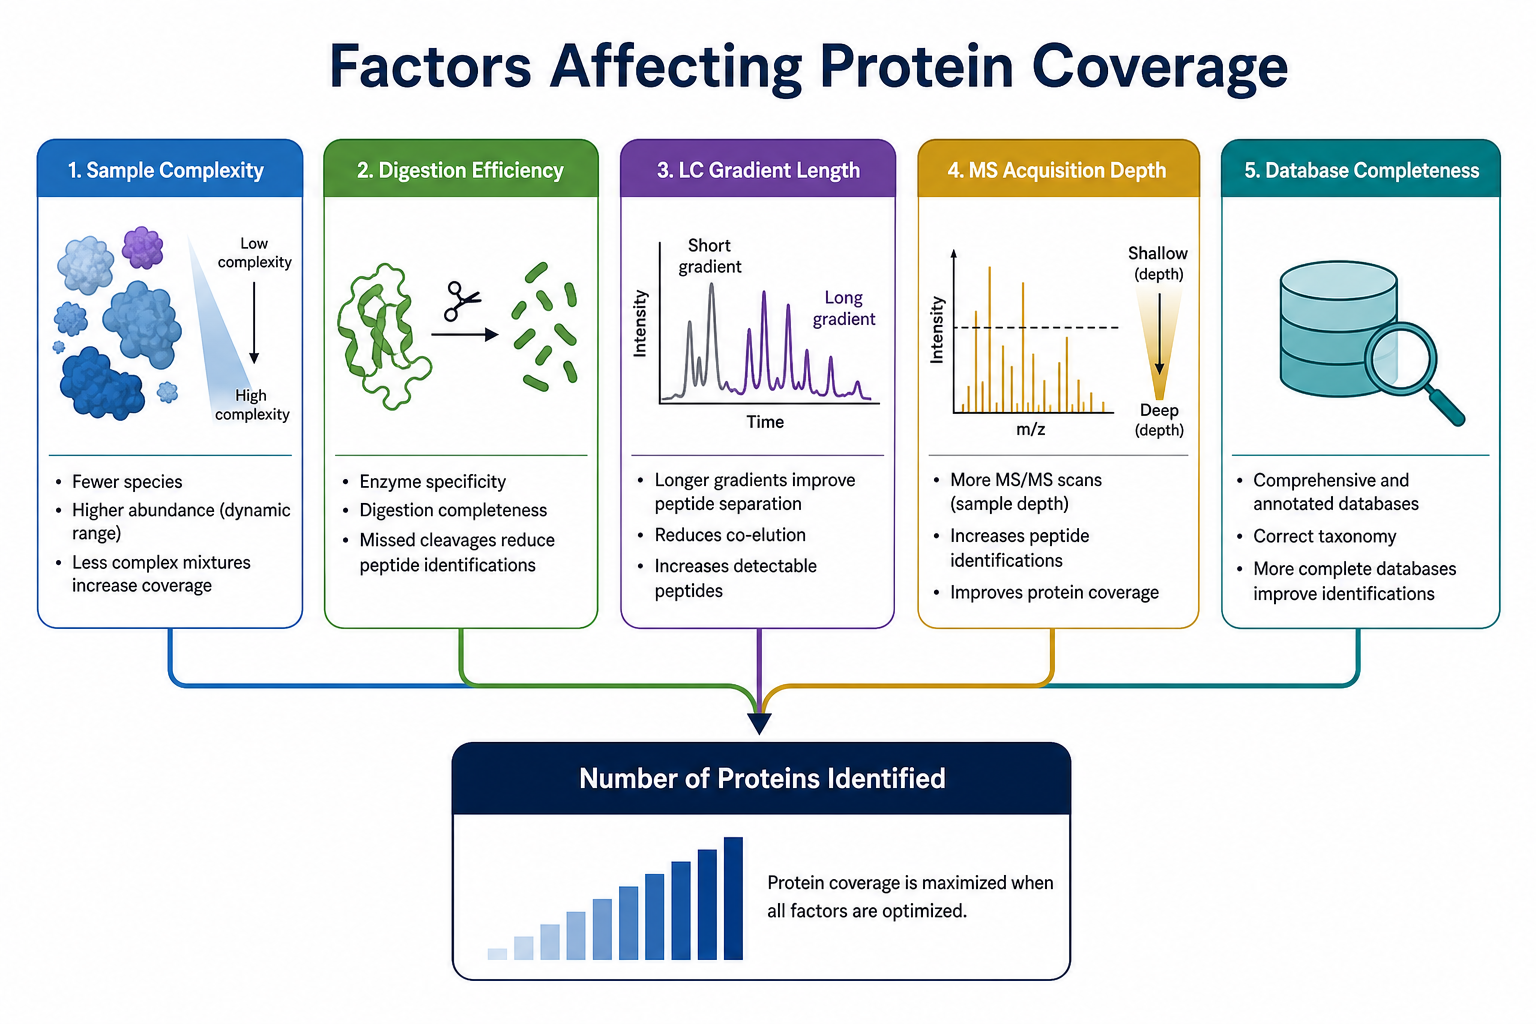
Figure 1. Protein coverage in mass spectrometry proteomics varies with sample complexity, digestion efficiency, chromatographic depth, acquisition strategy, and database inference settings.
Key Factors Behind Quantification Differences
Quantitative proteomics by mass spectrometry compares peptide or protein abundance across samples. Reported fold changes can vary when technical factors are not held constant.
Label-free quantitation depends on consistent peptide ion intensities across LC-MS runs. Retention time drift, sample loading differences, and normalization methods can change reported protein ratios when pipelines differ.
Isobaric labeling with TMT or iTRAQ enables multiplexed comparison but can show ratio compression when co-isolated precursors interfere with reporter ion measurement. Metabolic labeling with SILAC depends on complete incorporation and balanced mixing of light and heavy proteomes.
Missing values are a major source of apparent quantification difference. A protein may appear unchanged because peptides were detected in only some replicates, or because identification thresholds differ between runs.
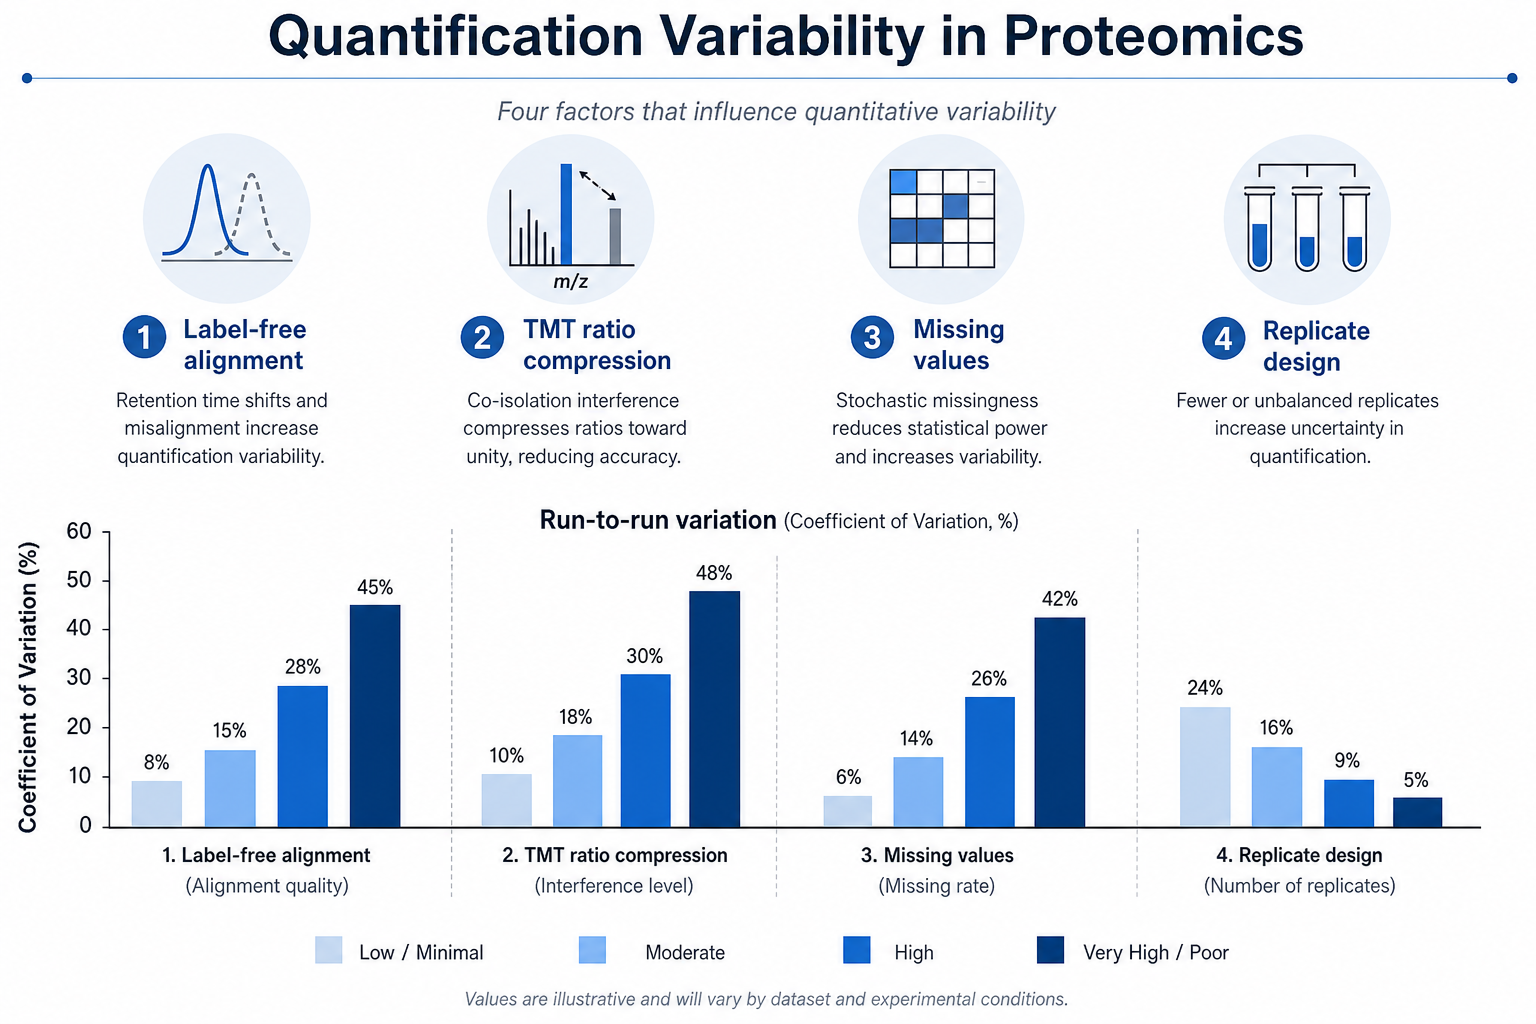
Figure 2. Quantification results in mass spectrometry proteomics vary with labeling strategy, LC-MS reproducibility, missing peptide values, normalization choices, and replicate design.
Key Factors Behind Data Confidence Differences
Data confidence reflects how strongly spectral evidence supports identification, quantitation, and modification assignment.
Peptide-spectrum match quality is the first confidence layer. High-scoring matches with consecutive fragment ions support stronger sequence assignment than sparse spectra. False discovery rate control determines which matches survive filtering.
Protein inference adds another confidence layer. Shared peptides across isoforms and homologous family members can create ambiguous protein groups. A protein reported with one unique peptide carries lower confidence than a protein supported by multiple unique peptides.
Quantitative confidence depends on replicate consistency and appropriate statistics. Instrument calibration and sample handling consistency influence confidence indirectly by affecting spectral quality and run-to-run reproducibility.
Related Services
Quantitative Proteomics Service
Label-Free Quantitative Proteomics Service, MS Based
Protein Identification Service
Proteomics Bioinformatic Analysis Service
Researchers concerned about coverage depth, quantitative reproducibility, or confidence thresholds in proteomics projects can consult MtoZ Biolabs before phase 1 sample preparation and phase 2 LC-MS/MS acquisition begin.
How Technical Factors Map to Result Differences
The table below links common technical variables to the proteomics outputs they most strongly affect.
|
Technical factor |
Main effect on coverage |
Main effect on quantitation |
Main effect on confidence |
|---|---|---|---|
|
Sample prep consistency |
Changes peptide yield and matrix cleanliness |
Alters ion intensity baselines across runs |
Affects PSM quality and missing values |
|
Digestion strategy |
Determines which peptides are produced |
Influences peptide completeness for ratio calculation |
Changes sequence support for protein inference |
|
LC gradient and column state |
Changes number of peptides sampled per run |
Affects retention alignment in label-free workflows |
Influences fragment quality through ion suppression |
|
DDA versus DIA acquisition |
Alters depth and run-to-run sampling |
Changes missing value patterns across cohorts |
Shifts reproducibility of peptide assignment |
|
Search and FDR settings |
Changes reported protein count |
Indirectly affects quantitation when PSM sets differ |
Directly controls identification stringency |
|
Replicate number |
Minor effect on identification lists |
Major effect on statistical reliability |
Determines whether claims are robust |
This mapping helps teams diagnose whether a result difference reflects preparation, acquisition, analysis, or true biology.
Reducing Unwanted Variation in Proteomics Projects
Not all variation can be eliminated, but many technical drivers can be controlled with upfront planning.
Standardize sample handling across all conditions in a comparison set. Match loading amounts and LC performance across runs, and include quality control samples when instrument drift is a concern.
Select quantitation strategy according to sample number and required reproducibility. Define confidence thresholds before analysis, including PSM-level FDR, minimum unique peptide counts, and modification localization criteria.
Plan biological and technical replicates explicitly. Biological replicates reveal true treatment effects. Technical replicates help separate preparation and instrument noise from biology.
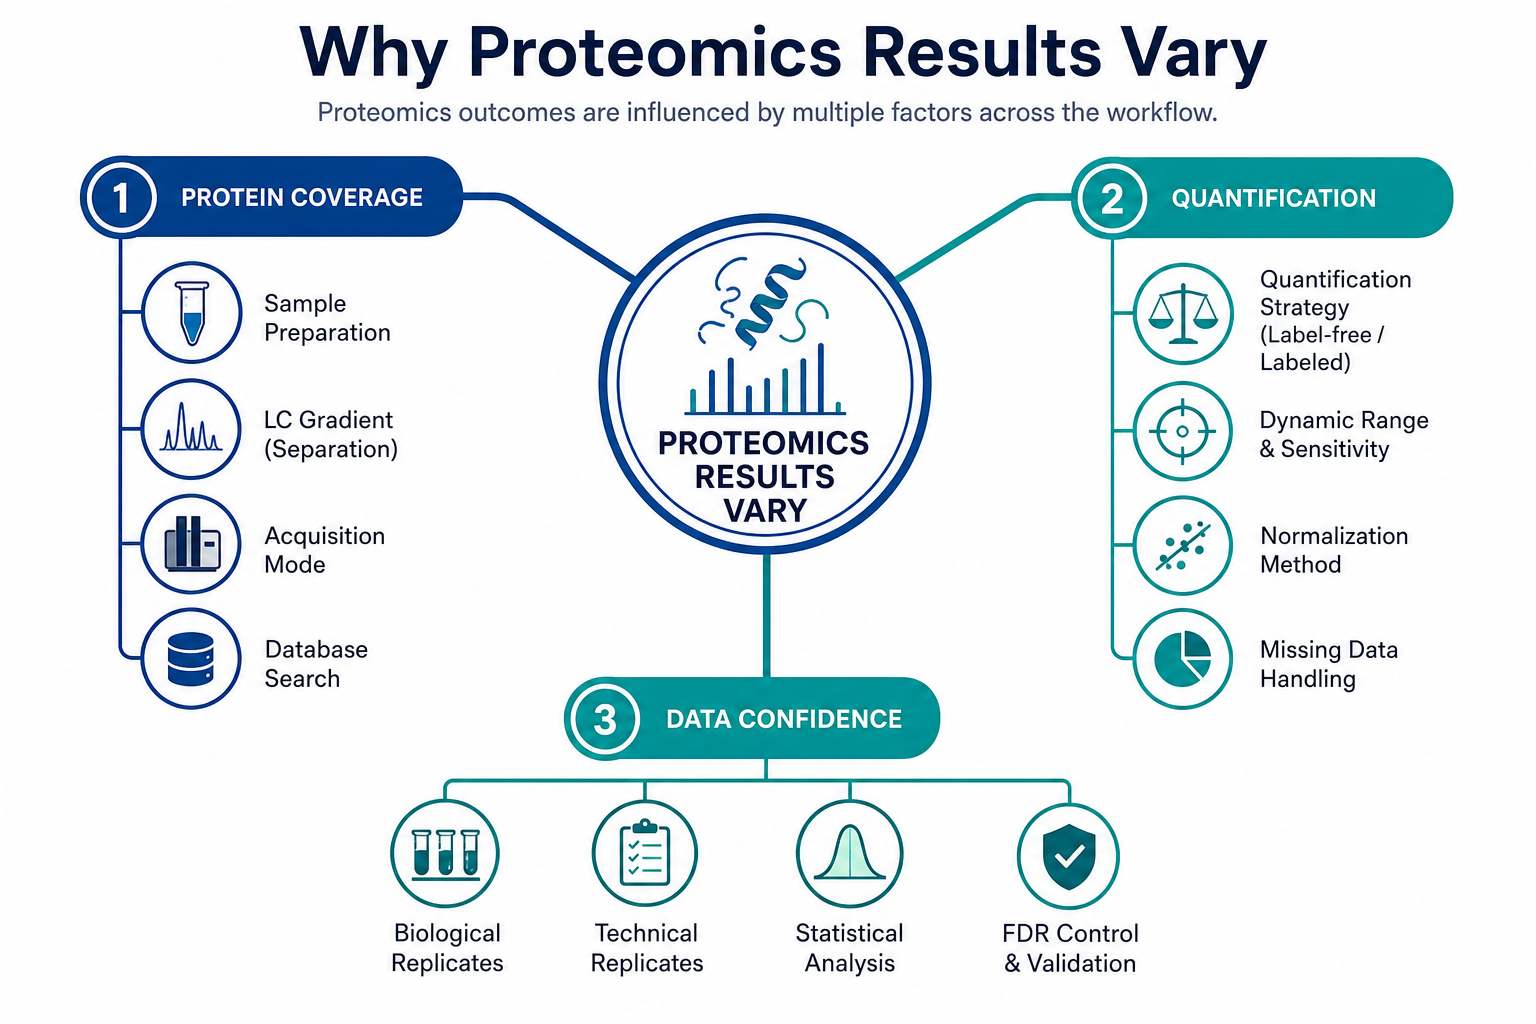
Figure 3. Mass spectrometry proteomics results vary across protein coverage, quantitation, and confidence because sample preparation, LC-MS/MS acquisition, and data analysis factors interact throughout the workflow.
When Result Differences Change Project Decisions
Coverage differences matter when a study depends on detecting low-abundance regulators, membrane proteins, or pathway members near the detection limit. A shorter protein list may miss biologically relevant targets even when the workflow is otherwise valid.
Quantification differences matter when treatment effects are subtle or when clinical specimens show high donor variability. In those cases, normalization choice, missing value handling, and replicate depth can determine whether a candidate protein is carried forward.
Confidence differences matter most in biologics characterization, biomarker validation, and publication-grade discovery claims. A protein identified with one shared peptide should not receive the same weight as a protein supported by multiple unique peptides with high-scoring MS/MS spectra.
Recognizing which output layer is affected helps teams decide whether to repeat preparation, extend LC gradient time, change acquisition mode, tighten FDR control, or move selected targets into targeted PRM follow-up.
Advantages of Understanding Proteomics Variation
Understanding why mass spectrometry proteomics results vary improves experimental design and report interpretation. Teams can set realistic expectations for coverage in complex matrices, distinguish stochastic identification differences from biological absence, and evaluate quantitative tables with attention to replicate support.
This knowledge also improves cross-study comparison when digestion, gradient length, acquisition mode, and FDR thresholds differ between datasets.
Frequently Asked Questions
1. Why do two proteomics labs report different protein counts from similar samples?
Protein counts differ because of sample preparation, digestion efficiency, LC gradient depth, acquisition mode, database content, and protein inference rules. Stochastic precursor selection in data-dependent acquisition also causes run-to-run variation.
2. Why do quantitative proteomics fold changes differ between analyses?
Fold changes vary with labeling strategy, normalization method, missing peptide values, LC-MS reproducibility, and replicate design. A change in analysis software defaults can also alter reported ratios.
3. What is the difference between protein coverage and data confidence?
Protein coverage describes how many proteins are detected and how completely they are represented by peptides. Data confidence describes how strongly spectral and statistical evidence supports those identifications and quantitative claims.
4. How can proteomics projects improve data confidence?
Projects can improve confidence by standardizing sample handling, using sufficient replicates, applying consistent FDR thresholds, requiring adequate unique peptide support, and validating critical targets with targeted PRM when needed.
5. Is variation in proteomics always a technical problem?
No. Some variation reflects real biological differences across donors, conditions, or time points. The task is to separate biological signal from technical drivers through replicate design and quality review.
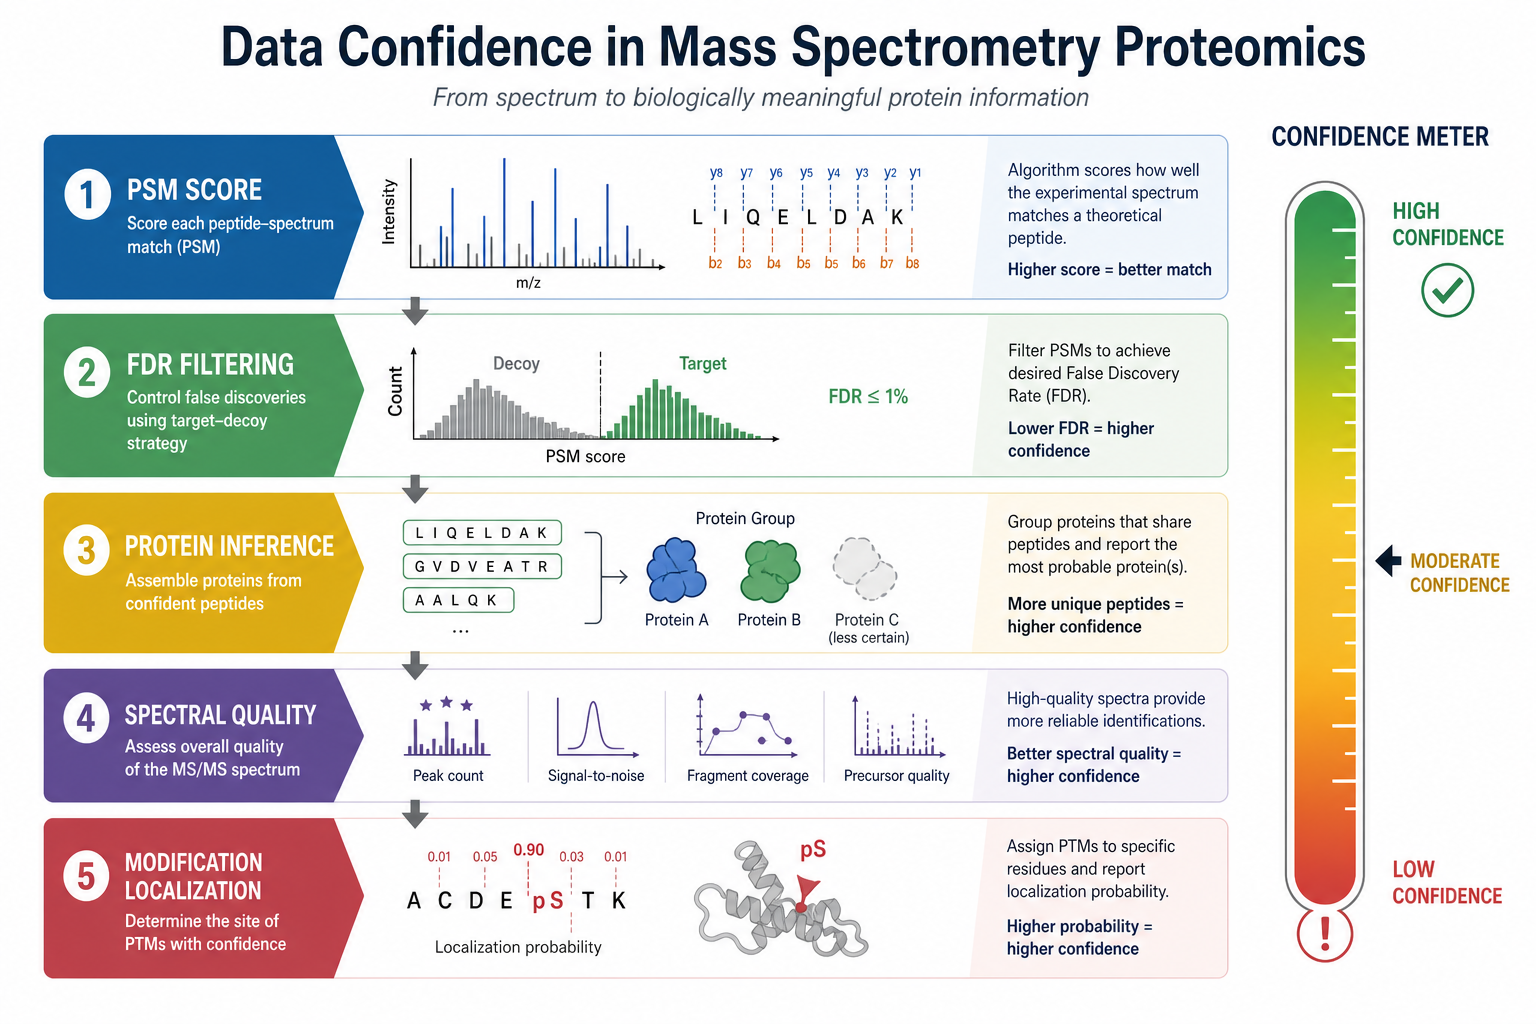
Figure 4. Data confidence in mass spectrometry proteomics depends on PSM quality, FDR control, protein inference rules, spectral support, and modification localization evidence.
Conclusion
Mass spectrometry proteomics results vary because protein coverage, quantification, and data confidence are shaped by connected factors across sample preparation, LC-MS/MS acquisition, and bioinformatic analysis. Coverage differences often trace to sample complexity, digestion, chromatography, and acquisition depth. Quantification differences often trace to labeling strategy, normalization, missing values, and replicate support. Confidence differences often trace to spectral quality, FDR thresholds, and protein inference rules.
Teams that define the required evidence level before the project begins can reduce unwanted technical variation and interpret result differences more accurately. If your group needs help diagnosing coverage gaps, quantitative inconsistency, or confidence thresholds in a proteomics dataset, MtoZ Biolabs can review workflow design and reporting criteria matched to your sample type and study goal. Contact MtoZ Biolabs to discuss how preparation, acquisition, and analysis choices affect protein coverage, quantitation, and confidence in your next proteomics project.
How to order?




