






Why Biofluid Proteomics Results Vary: Protein Coverage, Missing Values, and Reproducibility
Serum, plasma, and cerebrospinal fluid (CSF) proteomics do not always produce the same depth or consistency of protein detection. Differences can appear in the number of proteins identified, the proportion of proteins detected across samples, and the stability of quantitative measurements.
These differences can arise from the composition and condition of the biofluid, variation introduced during sample processing and LC-MS/MS analysis, batch-related effects, and genuine biological heterogeneity. Distinguishing among these sources is important when deciding whether a dataset is sufficiently reliable for the planned comparison.
What Variation Looks Like in Biofluid Proteomics Data
Before examining the source of variation, it is useful to separate three features of the dataset:
- Protein coverage: the number and range of proteins meeting identification criteria may differ among samples or projects.
- Detection completeness: some proteins may be quantified across most samples, while others are reported only in part of the sample set.
- Quantitative variation: protein abundance measurements may show different degrees of variation within biological groups or systematic shifts across analytical batches.
These features do not always change in the same direction. A dataset can have broad protein coverage but substantial missingness, while another dataset may identify fewer proteins with more consistent quantification across samples. Total protein count alone therefore does not describe the overall consistency of a biofluid proteomics dataset.
Why Protein Coverage Varies
Protein coverage is not determined by the mass spectrometer alone. The number and range of proteins identified also depend on the abundance distribution of the biofluid, the protein composition entering analysis, and how effectively lower-level peptide signals can be recovered and measured.
Biofluid Composition and Abundance Range
Serum and plasma contain proteins across an exceptionally wide abundance range. A relatively small number of abundant proteins contribute a large proportion of the total protein content, while many other proteins occur at much lower levels. This imbalance can limit access to lower-abundance proteins during LC-MS/MS analysis.
CSF has a different protein concentration and composition profile from serum and plasma. Protein coverage should therefore be evaluated within the context of the sample matrix rather than compared directly across different biofluids.
High-Abundance Protein Depletion
High-abundance protein depletion can increase access to lower-abundance proteins in serum and plasma, but depletion also changes the protein mixture entering proteomic analysis.
Datasets generated with and without depletion may therefore differ in both the number of proteins identified and the types of proteins represented. Protein counts from different preparation strategies are not directly equivalent, and a larger protein list does not necessarily indicate a more suitable dataset for a given study.
Sample Condition and Measurement Depth
Changes in sample condition can also influence which proteins remain available for detection. Hemolysis, precipitation, or contamination may alter the relative protein composition and change the detectable protein profile.
Analytical depth further affects how many proteins can be identified, especially at lower abundance. Differences in peptide recovery, chromatographic separation, and MS sampling can change whether low-level peptide signals meet the criteria for protein identification. For this reason, similar biofluid samples can still produce different levels of protein coverage under different analytical conditions.
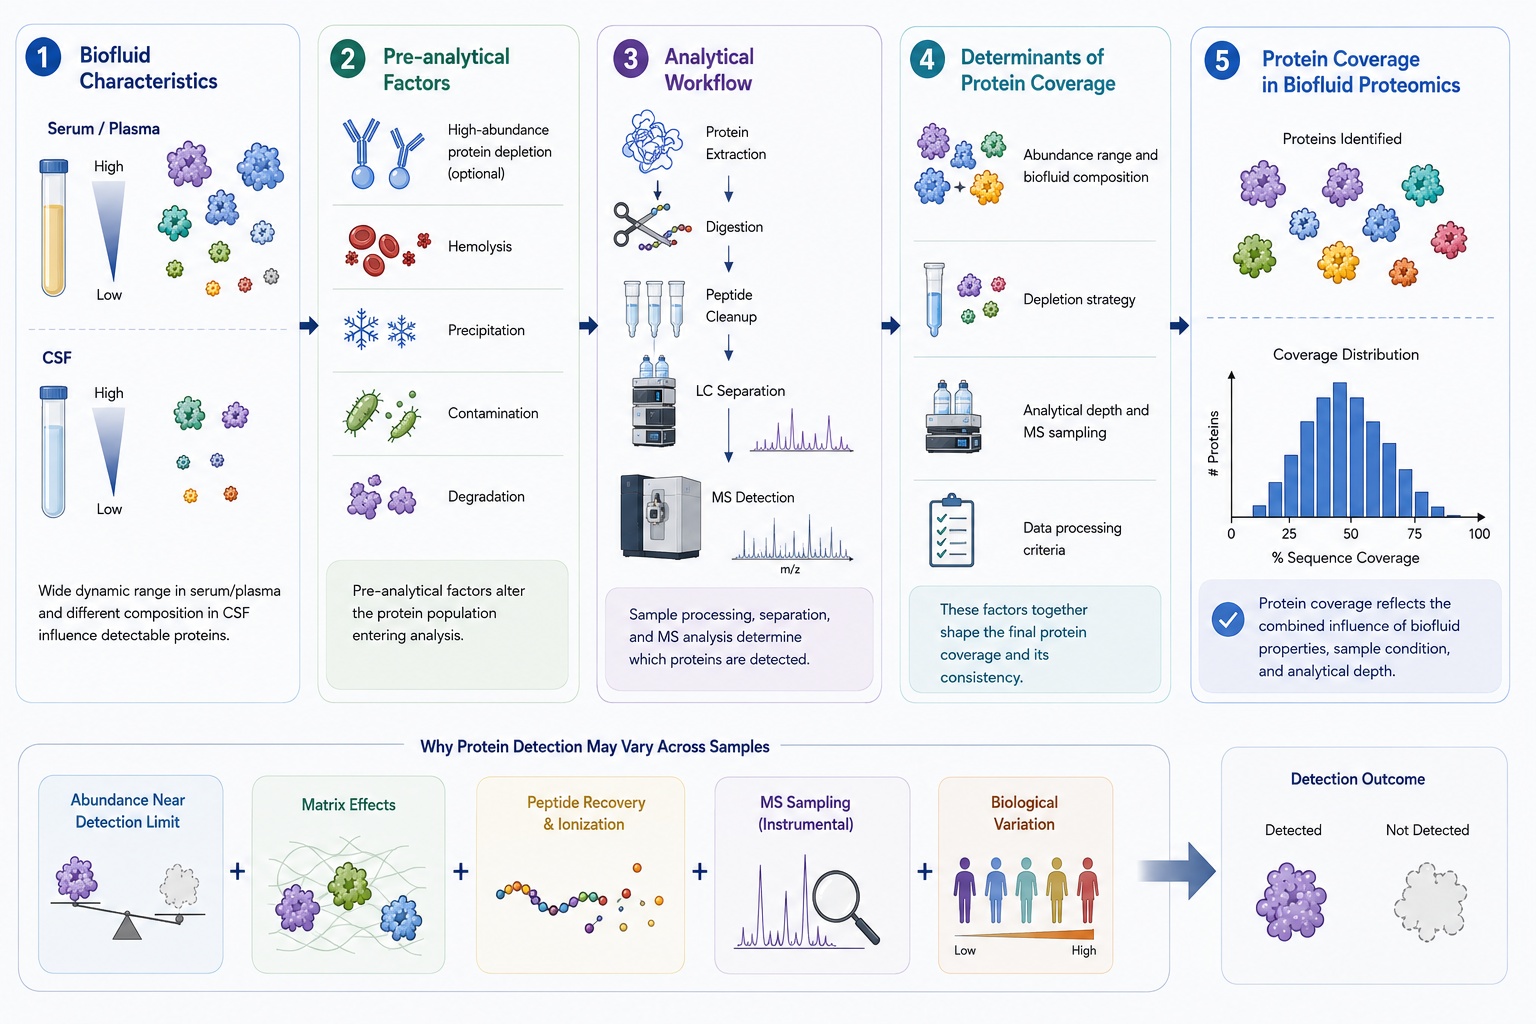
Figure 1. Factors That Influence Protein Coverage in Biofluid Proteomics.
Why Proteins Are Missing Across Samples
A protein may be quantified in some samples but have no reported value in others. Several factors can contribute to incomplete detection across a biofluid proteomics dataset:
- Low protein abundance: Proteins near the effective detection range are more likely to be detected inconsistently across samples.
- Analytical variation: Differences in peptide recovery, chromatographic separation, ionization, or MS sampling can affect whether sufficient signal is obtained for identification and quantification.
- Acquisition-related differences: The way peptide signals are sampled during LC-MS/MS can influence detection completeness across repeated measurements.
- Biological variation: Real abundance differences among individuals or experimental groups can place a protein above the detectable range in some samples but below it in others.
Missing values can therefore have both analytical and biological origins. A missing measurement should not be interpreted automatically as protein absence or as evidence of poor analytical performance. The pattern of missingness across the full sample set provides more useful context than a single missing value.
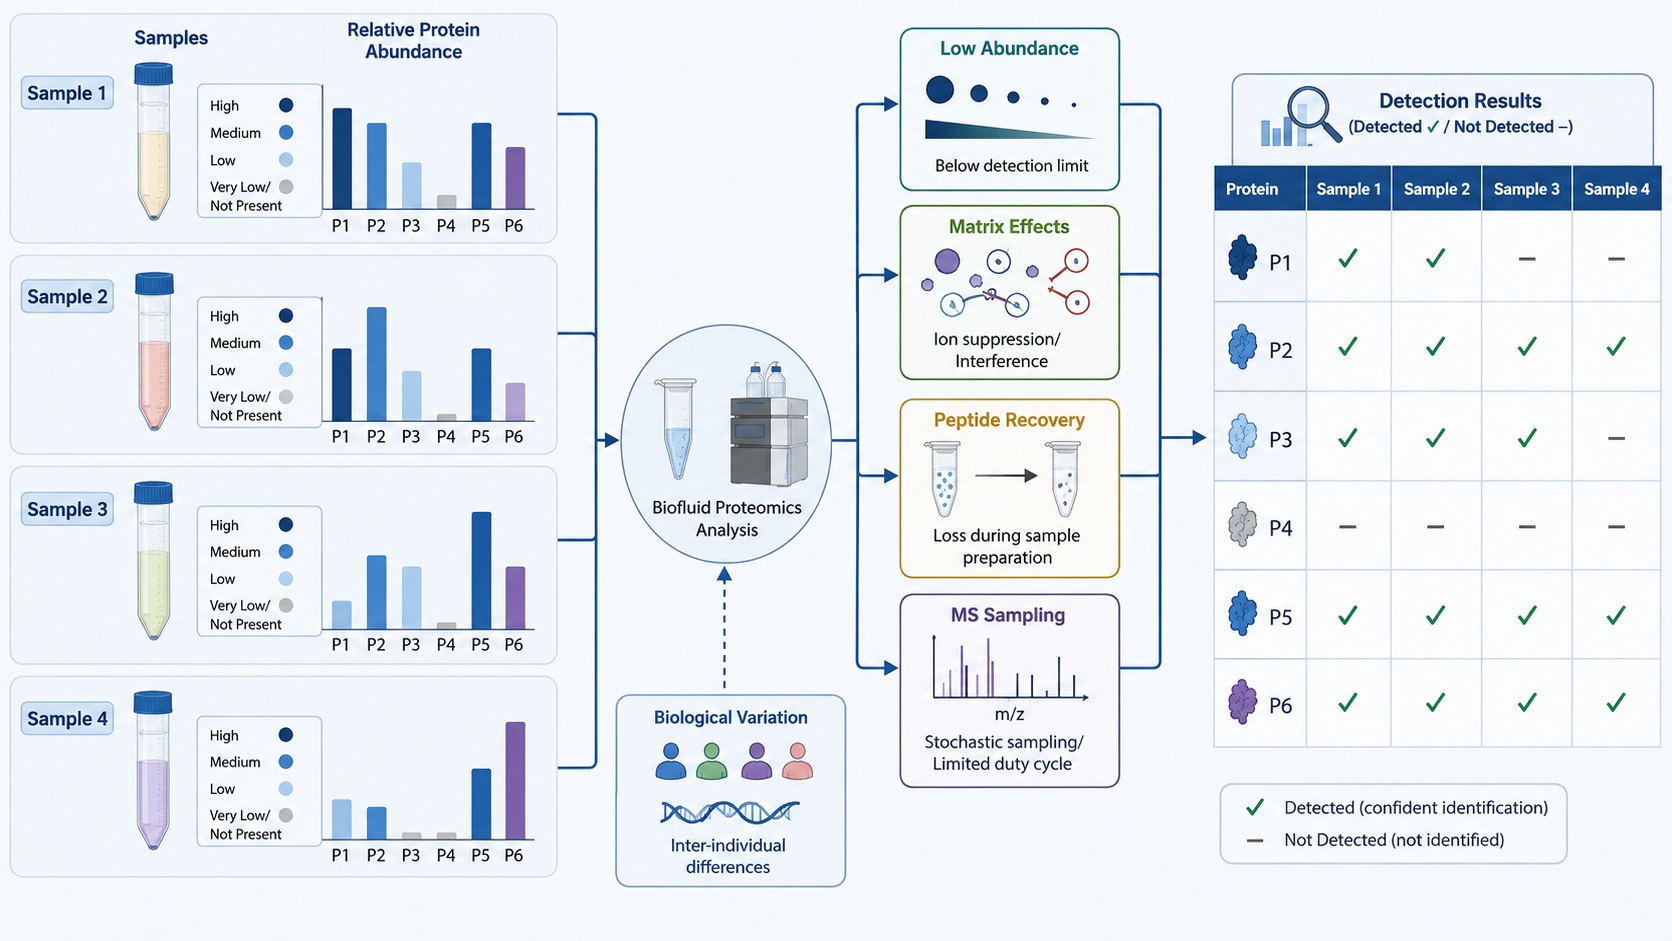
Figure 2. Sources of Inconsistent Protein Detection Across Biofluid Samples.
What Affects Quantitative Reproducibility
Sample Preparation Consistency
Differences in protein recovery, digestion, or peptide cleanup can change the relative amount of material available for quantification. When preparation varies across samples, additional quantitative variation can be introduced before LC-MS/MS analysis begins.
LC-MS/MS Stability
Quantitative measurements can also be affected by changes in chromatographic performance, ionization efficiency, and MS response during an analytical sequence. Stable analytical performance is particularly important in studies containing many samples because small technical shifts can accumulate across multiple runs.
Batch-Related Variation
Projects processed or analyzed across multiple batches may show systematic quantitative differences that are unrelated to the biological groups. Batch-related variation becomes more important when samples from different study groups are unevenly distributed across preparation or analytical batches.
Quantitative reproducibility therefore depends on controlling technical variation across the full sample set. The goal is not identical measurements among biological samples, but sufficient analytical consistency to distinguish technical variation from genuine biological differences.
How Cohort Size and Sample Heterogeneity Affect Observed Variation
The amount of variation visible in a proteomics dataset depends partly on how many samples are included and how similar those samples are biologically. Larger or more heterogeneous cohorts often show a wider range of protein abundance and detection patterns than small, tightly defined sample sets.
Larger Cohorts Capture a Wider Range of Variation
As more independent samples are included, uncommon abundance patterns and differences between individual samples become easier to observe. Proteins that appear relatively consistent in a small dataset may show a broader quantitative range when the cohort expands.
Greater variation in a larger cohort does not necessarily indicate reduced analytical reproducibility. The additional samples may simply reveal biological differences that were not represented in the smaller dataset.
Cohort Heterogeneity Affects Within-Group Consistency
Samples assigned to the same group can still differ in biological background or response to an experimental condition. Greater heterogeneity can lead to wider protein-abundance distributions and less uniform detection within the group, which may make group-level differences less distinct.
Study scale can also make systematic technical patterns easier to recognize because larger projects often span more preparation and analytical runs. Biological heterogeneity and technical variation therefore need to be distinguished when assessing how consistently a cohort behaves.
Technical Variation vs Biological Variation
Sample-to-sample variation can come from the analytical process, the biological samples themselves, or a combination of both. Separating these sources is important because similar data patterns can have different explanations.
|
Variation Type |
Common Source |
Effect on Data |
|
Technical |
Sample processing, LC-MS/MS analysis, batch differences |
Added measurement variation |
|
Biological |
Individual differences, experimental response, biological heterogeneity |
Genuine abundance differences |
|
Mixed |
Biological groups unevenly distributed across technical conditions |
Biological and technical effects become confounded |
High variation among biological replicates does not necessarily indicate poor analytical performance. Independent biological samples can differ substantially even when sample processing and LC-MS/MS measurements are stable.
Likewise, strong technical reproducibility does not guarantee clear differences between study groups. Biological effects may be modest relative to the natural variation within each group. Technical consistency and biological variability should therefore be evaluated as separate components of the dataset.
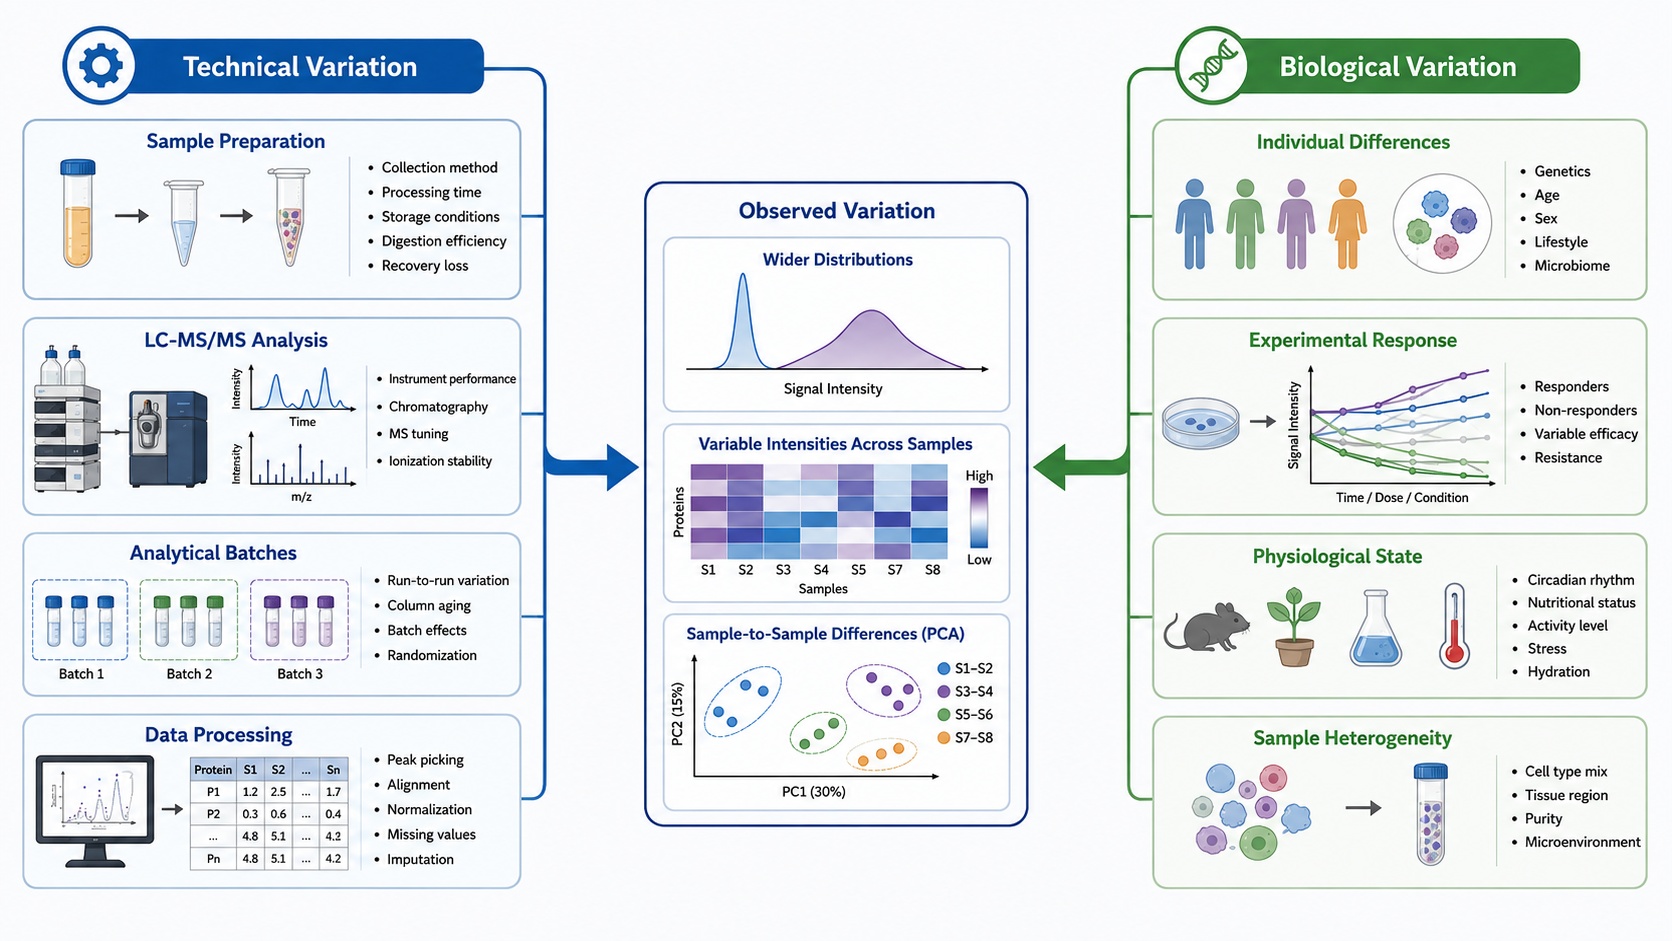
Figure 3. Technical and Biological Sources of Biofluid Proteomics Variation.
Evaluating Data Quality Beyond Protein Count
The number of identified proteins is only one measure of a biofluid proteomics dataset. For comparative studies, data quality also depends on how consistently proteins are detected and quantified across the sample set.
|
Variation Type |
Common Source |
|
Technical |
Sample processing, LC-MS/MS analysis, batch differences |
|
Biological |
Individual differences, experimental response, biological heterogeneity |
|
Mixed |
Biological groups unevenly distributed across technical conditions |
A dataset with moderate protein coverage can still support a strong comparison when detection is consistent and quantitative measurements are stable. A larger protein list may provide broader coverage but offer less value if many proteins are detected inconsistently across samples.
Data quality should therefore be judged in relation to the planned comparison rather than against a fixed protein count or universal reproducibility threshold. For serum, plasma, and CSF proteomics, the most useful dataset is one that provides sufficient coverage and measurement consistency for the biological question being addressed.
Frequently Asked Questions
Q1: Is there a minimum number of identified proteins that defines a good biofluid proteomics dataset?
No. There is no universal protein-count threshold for serum, plasma, or CSF proteomics. An appropriate dataset depends on the sample matrix, analytical approach, and whether the resulting measurements can support the intended comparison.
Q1: Can a dataset still be useful if some proteins have missing values?
A1: Yes. Some missing measurements can occur in proteomics datasets, particularly for proteins near the detection range. The importance of missing values depends on how frequently they occur, how they are distributed across samples, and whether the proteins needed for the main comparison are measured consistently.
Q2: Should technical replicates and biological replicates show the same level of variation?
A2: No. Technical replicates are used to assess analytical repeatability, whereas biological replicates contain genuine biological differences. Greater variation among biological replicates can therefore be expected even when technical performance is stable.
Q3: Why can quality-control samples be consistent while biological samples remain variable?
A3: Quality-control samples mainly reflect analytical stability. Biological samples also contain individual or experimental variation, so stable QC performance does not require biological samples to produce nearly identical quantitative profiles.
Q4: Can datasets from different serum or plasma preparation strategies be compared directly?
A4: Direct comparison requires caution. Preparation strategies such as high-abundance protein depletion can change the protein population entering LC-MS/MS analysis. Differences in protein coverage between datasets may therefore reflect preparation strategy as well as analytical performance.
Q5: When should unexpected variation in a dataset receive closer attention?
A5: Unexpected variation deserves further review when the pattern is concentrated in a particular subset of samples, preparation batch, or analytical sequence rather than appearing as normal variation across the cohort. Such patterns may indicate a systematic technical source that should be distinguished from biological variation.
Conclusion
Reliable biofluid proteomics comparison depends on keeping technical variation small enough that biological differences are not obscured. Consistent sample processing and LC-MS/MS performance make it easier to distinguish true sample-to-sample variation from changes introduced during analysis. This provides the basis for deciding whether a dataset is suitable for downstream statistical and biological interpretation.
For serum, plasma, and CSF projects with concerns about data consistency or study comparability, MtoZ Biolabs can help assess the analytical setup in the context of the research objective. For broader guidance on sample selection, workflow planning, quantitative strategies, and result interpretation, see Serum, Plasma, and CSF Proteomics: From Biofluid Samples to Biological Insights.
How to order?




