






Resistant vs Susceptible Plants: How to Design a Comparative Proteomics Study
A resistant versus susceptible plant proteomics study depends on keeping one comparison front and center: the same tissue, collected under the same challenge and growth conditions, from plants that differ mainly in resistance. Closely related materials, near-isogenic lines, or well-characterized genotype pairs are easier to interpret. If the materials have broad genetic background differences, differential proteins should be treated as resistance-associated candidates rather than direct resistance mechanisms. Before harvest, settle how resistance and susceptibility are defined, what challenge both genotypes will receive, which tissue and sampling window you will use, and whether you need quantitative comparison rather than protein identification alone.
Put the comparison in plain terms first. For example, challenged leaf from a resistant line versus challenged leaf from a susceptible line at a defined infection stage. Then collect enough tissue for that organ, keep biological replicates independent, and choose DDA or DIA only after the sample set looks realistic. Protein differences are easier to defend when they track the resistance contrast, not mismatched plant age, uneven challenge timing, different organs, or broad genotype background effects.
If you want a design check before harvest, share the genotype pair, resistance scoring rule, tissue type, challenge protocol, planned groups, and approximate tissue amount with MtoZ Biolabs so comparative plant proteomics can be matched to the question early.
Why Resistant vs Susceptible Designs Need Their Own Plan
This is a genotype comparison, not a classic stress-versus-control screen. In most resistance studies, the plant materials differ and the challenge is held as steady as possible. That is the reverse of many abiotic stress designs, where one genotype is stressed and compared with its own untreated control.
Three questions are especially important here.
How is resistance defined in practice? A pedigree label is rarely enough. Prefer a phenotype rule you can record at harvest, such as disease score, lesion size class, survival under a standard challenge, or another accepted resistance index for that crop.
Do both genotypes receive the same challenge? If only the susceptible line is inoculated, genotype and exposure are mixed. For a resistance comparison, resistant and susceptible plants should see the same challenge dose, timing, and environment, unless you deliberately add unchallenged baseline groups.
Is the harvest timed to the biology of infection or stress progression? Sampling too early can miss defense remodeling. Sampling too late can mainly capture tissue collapse in the susceptible line. Aim for a window where the phenotype difference is clear, but both tissues are still suitable for protein extraction.
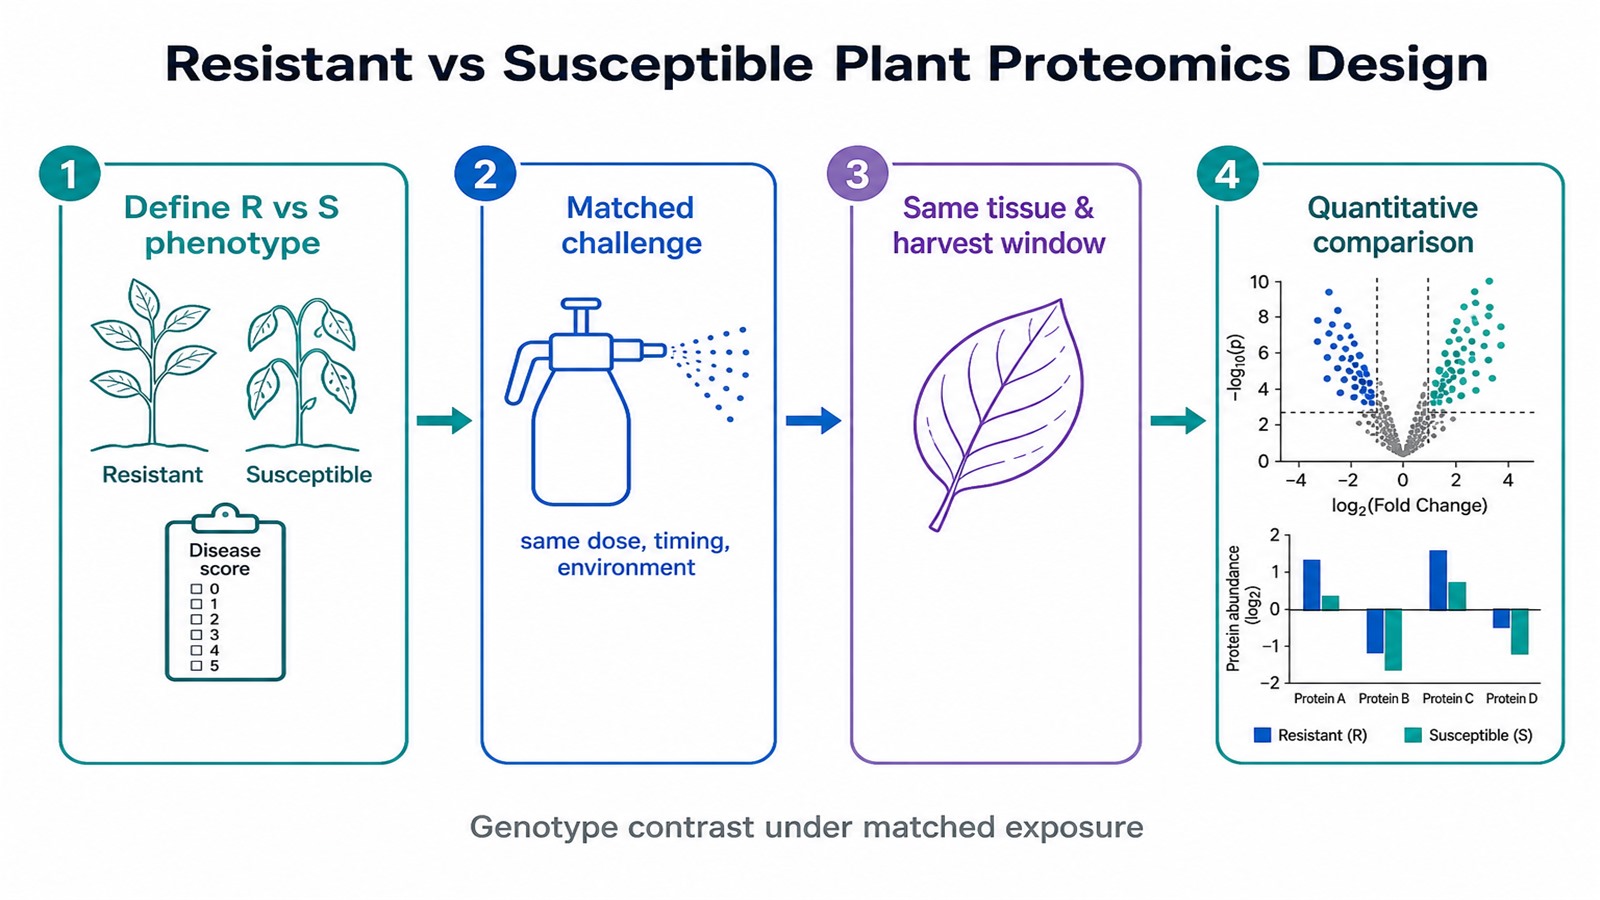
Figure 1. Define the resistance phenotype, apply a matched challenge, then sample the same tissue before quantitative comparison.
Materials, Challenge, and Groups to Settle First
Write these decisions down before plants are harvested. Changing them after collection usually weakens interpretation.
Name the resistant and susceptible materials, and the phenotype rule that separates them. If several resistant lines are available, decide whether the first round uses one pair or a small panel. When possible, use closely related materials or clearly document the genetic background difference before interpreting resistance-associated proteins.
Define the challenge clearly: pathogen strain or stressor, dose or inoculum level, application method, and hours or days after challenge at harvest. Keep this identical across genotypes for the main comparison.
Choose the organ that matches the resistance trait, such as leaf, root, stem, or seed. Do not pool organs unless the question is intentionally whole-plant. Soft tissues such as leaves and flowers are common for foliar resistance screens. Roots and other hard tissues fit root-disease or soil-related questions.
The cleanest starting design is resistant challenged versus susceptible challenged. Unchallenged baselines for each genotype help when you need to separate constitutive differences from challenge-induced differences. A full genotype-by-challenge layout is stronger for mechanism questions, but it needs more sample and clearer labeling.
Independent plants or independent pots usually count as biological replicates. Leaves from the same plant do not, if the claim is plant-level resistance. Agree that definition when group names are written.
| Design choice | Practical note for R vs S studies |
| Soft plant tissues such as leaves, flowers, young stems, or other fresh tissues | Confirm collection amount before harvest because protein yield and interfering compounds vary by species and tissue |
| Hard or fibrous tissues such as roots, bark, twigs, fruits, or seeds | Discuss feasibility early, especially when protein yield or matrix interference may affect extraction |
| Limited samples such as pollen | Confirm sample availability and analysis route before collection |
| Main comparison | Resistant challenged vs susceptible challenged at one harvest window |
| Optional baseline groups | Unchallenged resistant and unchallenged susceptible when constitutive differences matter |
Treat sample amounts as collection guides, not performance promises. Avoid degraded, contaminated, or repeatedly freeze-thawed material. Samples from pathogen-challenge studies should be discussed before shipment. Live pathogens or infectious materials are not accepted, and challenged plant tissues may require safety confirmation before submission. A plant proteomics project typically includes protein extraction, digestion, and LC-MS/MS. Standalone preparation-only requests should be confirmed separately.
Keep Non-Resistance Factors Matched
Resistant versus susceptible studies go wrong when genotype differences are mixed with uneven handling. Match developmental stage, growth medium, light cycle, nutrition, and tissue position as closely as you can. When the organ is structured that way, harvest the same leaf rank or root zone in both lines.
Record a short phenotype note for every plant at harvest, using the same scoring rule. That note is not part of the proteomics report, but it later shows whether a protein change sits with a clear resistance phenotype or with uneven disease progress. Keep abundance results separate from any claim about pathogen load unless pathogen load was measured on its own.
If the susceptible line collapses much earlier than the resistant line, avoid a late shared harvest that mainly compares intact tissue with degraded tissue. Move both genotypes to an earlier shared window, or label late susceptible samples as a separate damage-state group and interpret them with that limit in mind.
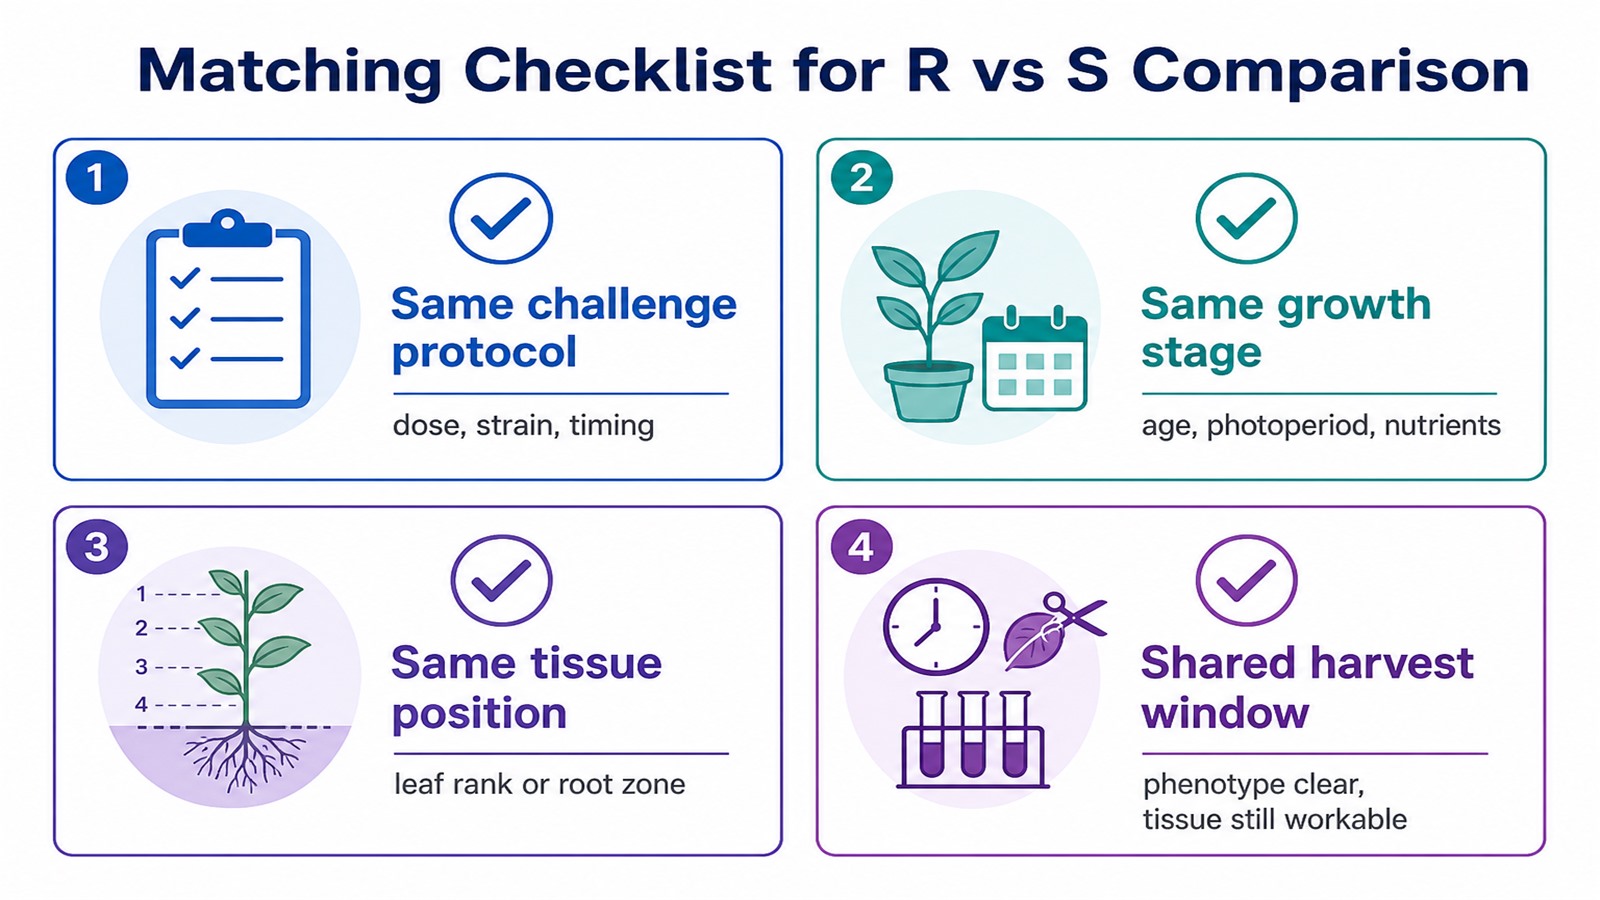
Figure 2. Keep challenge, stage, tissue position, and harvest timing matched so resistance remains the main comparison.
Choosing Identification or Quantification
Once the groups and tissue amounts look realistic, choose the analytical approach from the question.
Protein identification fits early characterization when you mainly need a protein list from one condition. Quantitative comparison is required when you want to know which proteins differ in abundance between resistant and susceptible materials.
DDA can be useful for discovery-oriented pilots, method setup, or studies where initial protein identification depth is the first concern. DIA is often preferred when matched resistant and susceptible cohorts require more consistent quantification across multiple groups or time points. The final route should be selected after the group structure, replicate plan, species database quality, and quantitative objective are clear. Instruments such as Orbitrap Exploris 480, timsTOF Pro, and Orbitrap Astral can be discussed once the study size is clear.
A common path is a first quantitative comparison of one well-matched resistant versus susceptible pair under challenge, then a later expansion to unchallenged baselines, additional time points, or a small line panel. Avoid locking a large multi-line map before phenotype scoring and challenge timing are stable.
When the first round is done, read the differential list with the phenotype notes side by side. Proteins that track a clear resistance score are stronger leads for follow-up than proteins that appear only in plants with uneven disease progress. That simple cross-check often saves weeks of chasing noise.
A typical report can include differential analysis, functional annotation, GO and KEGG enrichment, and protein interaction or pathway context when suitable databases are available for the studied species. Use pathway enrichment to prioritize candidates, not as final proof of a resistance mechanism. Priority proteins still need independent follow-up. If defense metabolites are central to the story, plant metabolomics can be added after the protein comparison is clear. If early signaling is the next question, phosphoproteomics is a natural companion rather than a replacement for the abundance screen.
Related Services
Plant Phosphoproteomics Analysis Service
Frequently Asked Questions
Do resistant and susceptible plants both need the same challenge?
Yes for the main resistance comparison. If only one genotype is challenged, genotype and exposure are mixed. Add unchallenged baselines when constitutive differences also matter.
How many genotypes should the first round include?
One well-characterized resistant versus susceptible pair is usually enough to start. Expand to a panel after phenotype scoring, tissue choice, and harvest timing are stable.
Can comparative plant proteomics prove a resistance mechanism?
No. It ranks candidate proteins and pathways associated with the resistance comparison. Functional assays and independent validation are still needed before a mechanism claim.
How much plant tissue should be planned?
Sample amount should be confirmed before harvest because plant tissues differ in protein yield, water content, and interfering compounds. Share the plant species, tissue type, treatment groups, analysis route, and available material so the collection plan can be reviewed before sample preparation.
What information should be shared before the project starts?
Share the genotype pair, resistance scoring rule, tissue type, challenge protocol with timing, planned groups and replicates, and approximate tissue amount. That package makes it easier to check whether comparative plant proteomics fits the design.
Conclusion
Resistant versus susceptible plant proteomics is a genotype comparison under matched challenge, not a generic stress screen. Define the phenotype rule, give both materials the same exposure, sample the same tissue at a biologically sensible window, and quantify only after the sample set looks realistic. Keep confounders out of the comparison, treat pathway maps as candidate context, and plan follow-up for priority proteins.
To review this design before collection, contact MtoZ Biolabs with the genotype pair, scoring rule, tissue, challenge scheme, groups, and tissue amount.
How to order?




