






- Biological Products Analysis Service Primary Structure Analysis Service Therapeutics Characterization Service | Advanced Structural Charge Heterogeneity Analysis Service Biopharmaceutical Impurities Analysis Service
- Preclinical Drug Development Active Ingredients Identification and Screening Service Drug Target Analysis Service Biopharmaceuticals Characterization Service Targeted Drug Delivery Service | Precise and Efficacious Customized Drug Development and Optimize Service
- Thematic Analysis Service High-Throughout Gene Knockout Services Biopharmaceutical Stability Analysis Service PROTAC Drug Off-Target Protein Assessment Service Biosimilar Assessment Service Generic Peptide Pharmaceuticals Assessment Service Research on Media Development and Optimization Vaccine Quality Research and Testing Solutions Antibody Drug Analysis Service mRNA Drug Analysis Service Medical Device Analysis Service
- Proteomics Analysis Service Sample Preparation Service Protein Analysis Service Quantitative Proteomics Service Post-Translational Modifications Proteomics Service Proteomics Service of Different Sample Types Targeted Proteomics Service Peptidomics Analysis Service Proteomics Bioinformatic Analysis Service High-Throughout Proteomics Analysis Service for Gene Knockout Chemical Proteomics Analysis Service
- Metabolomics Analysis Service Untargeted Metabolomics Service Targeted Metabolomics Analysis Service High-Throughput Metabolomics Service After Gene Knockout Metabolomics Bioinformatic Analysis Service More Services
- Lipidomics Analysis Service Untargeted Lipidomics Analysis Service Targeted Lipidomics Analysis Service Exosome Lipidomics Service Lipidomics MALDI Imaging Service Oxylipidomics Service
- Multi-Omics Analysis Service Integrative Lipidomics-Proteomics Analysis Service Integrative Transcriptomics-Metabolomics Analysis Service Integrative Transcriptomics-Proteomics Analysis Service Integrative Transcriptomics-Lipidomics Analysis Service Integrative Metabolomics-16S rDNA Sequencing Analysis Service Integrative Proteomics-Metabolomics Analysis Service Integrative PTM-Metabolomics Analysis Transcriptome Sequencing (RNA-sequencing) Service Metatranscriptomics Sequencing Service Full-Length 16S/18S/ITS Sequencing Service Prokaryotic Transcriptomics Sequencing Service Eukaryotic Non-Ginseng Transcriptome Sequencing Service Eukaryotic Transcriptome Sequencing Service 16S/18S/ITS Amplicon Sequencing Service Exosomal Sequencing Service
- Single Cell Analysis Service Single Cell Sequencing Service Single Cell Mass Cytometry Analysis
- Bioinformatics
Proteomics in Plant Breeding: How to Compare Varieties with Contrasting Traits?
Published: August 12, 2026
Proteomics in plant breeding helps compare varieties or breeding lines with contrasting traits by linking protein abundance changes to the phenotype measured. A high-yield line versus a low-yield line, a drought-tolerant cultivar versus a sensitive one, or medicinal plant materials with different stress responses can all follow the same core logic:
- Define the trait contrast in measurable terms.
- Sample the relevant tissue under comparable conditions.
- Interpret differential proteins with phenotype and pathway context rather than treating every significant hit as a breeding marker.
The value is not a protein list by itself. Breeding teams need to know which proteins and pathways track the target trait consistently enough to support candidate prioritization, breeding-related research, or follow-up validation.
If you are comparing plant materials with contrasting traits, share your materials, research objective, tissue type, and current study plan with MtoZ Biolabs. The comparison can be reviewed before sampling when possible.
What Crop Trait Proteomics Can and Cannot Show
Quantitative plant proteomics can identify proteins that differ in abundance between varieties or breeding lines under a defined comparison. It may reveal:
- Baseline protein differences between materials
- Shared responses to a treatment
- Protein changes that differ in direction or magnitude between genotypes
- Coordinated changes in metabolism, stress response, transport, storage, or protein homeostasis
Differential analysis identifies changing proteins, while functional annotation, GO and KEGG pathway analysis, and suitable database-supported association networks help organize those changes and prioritize candidates.
These outputs help prioritize biology linked to the trait contrast. They do not by themselves:
- Prove causality
- Confirm a differential protein as a breeding marker
- Predict field performance across every environment
- Replace genetic mapping when the breeding goal requires locus-level resolution
- Replace independent functional or multi-environment validation
Proteomics is strongest when paired with a clear phenotype rule. Yield components, seed quality traits, stress tolerance scores, validated biochemical traits, or medicinal plant responses under defined conditions can support a comparison when the same rule is applied across materials.
Discovery results should be described as candidate proteins and pathway priorities until broader testing and independent validation support stronger breeding claims.
Define the Trait Contrast Before Sampling
Breeding comparisons fail most often when the trait is named but not measured. Write the contrast in one sentence.
Examples include:
- High-oil versus low-oil breeding lines at maturity
- Drought-tolerant versus sensitive cultivars under a defined water-deficit treatment
- Two medicinal plant accessions with contrasting metabolite accumulation under the same growth condition
Then define what separates the materials in practice. A pedigree label alone is rarely enough. Use a measurable trait rule such as:
- Yield component
- Quality index
- Stress score
- Validated biochemical or metabolite-related measurement
- Another accepted phenotype for that crop
Choose whether the comparison is constitutive or treatment-linked:
- Constitutive comparisons ask which proteins differ between lines under the same standard growth condition.
- Treatment-linked comparisons ask how different lines respond to the same stress, challenge, or induction condition.
When the aim is to distinguish baseline genotype effects from treatment responses, matched control and treated groups are generally needed for each line. Comparing only treated Line A and treated Line B shows differences under treatment but cannot determine whether those differences were already present.
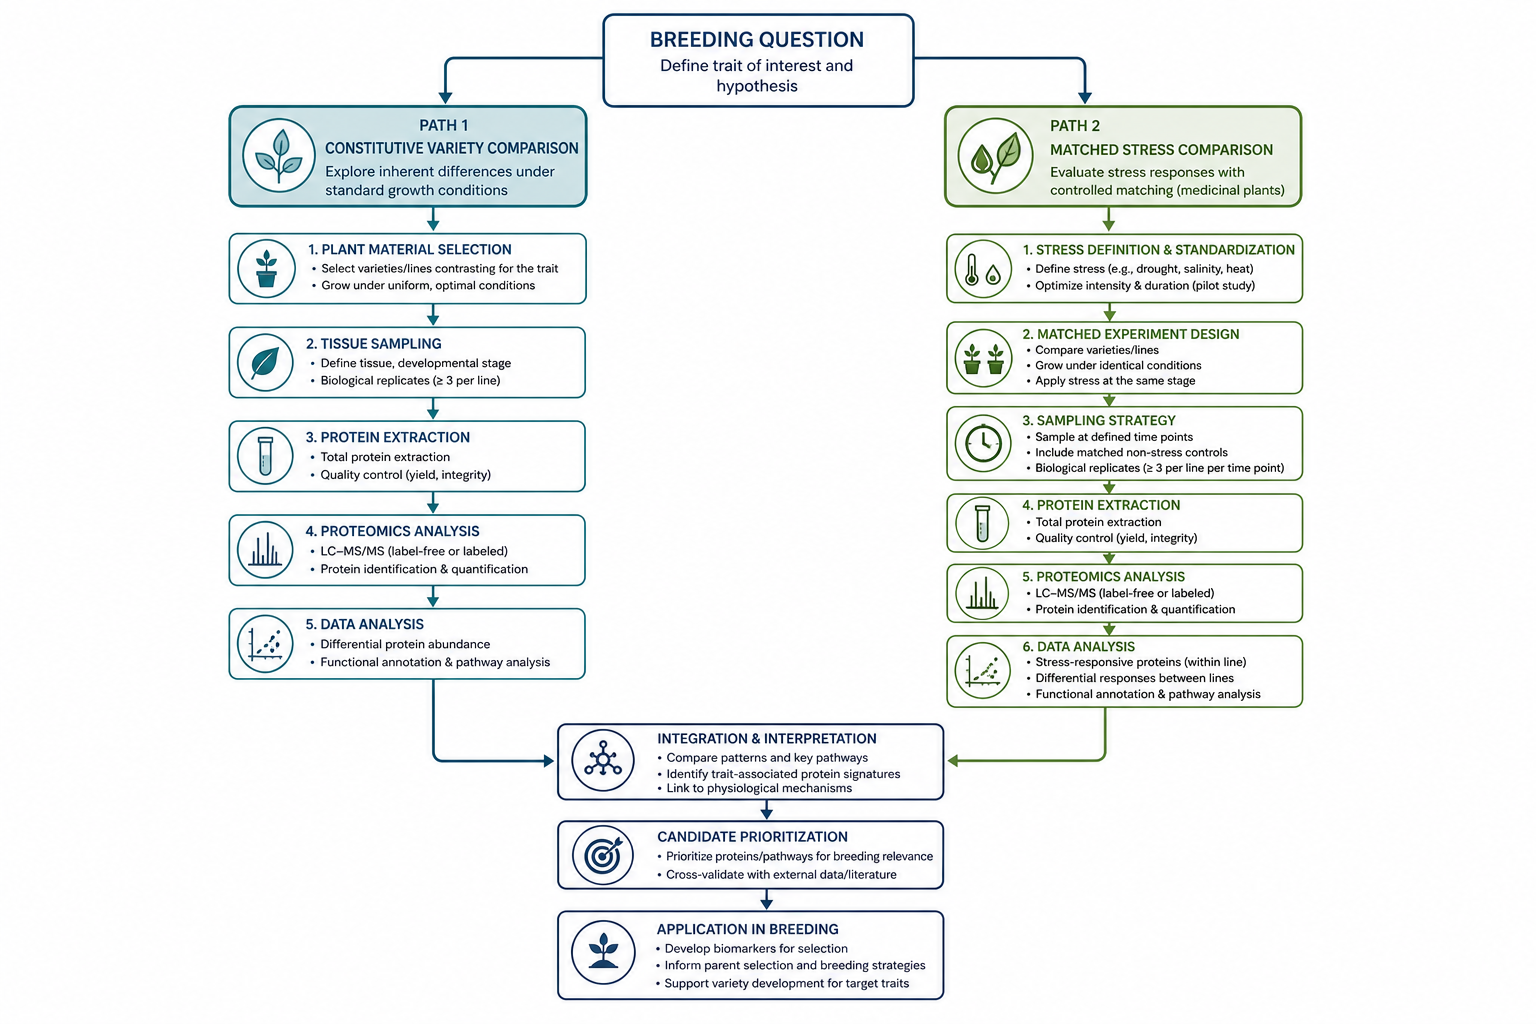
Figure 1. Constitutive comparisons and matched genotype-by-treatment designs answer different breeding questions.
| Breeding Comparison Element | What to Define Early | Why It Matters |
| Trait contrast | High vs low, tolerant vs sensitive, resistant vs susceptible | Sets the biological claim |
| Phenotype rule | Yield component, quality score, stress index, or validated trait measure | Keeps proteomics tied to measurable breeding value |
| Plant materials | Named varieties, lines, or accessions | Clarifies the comparison |
| Control groups | Matched control and treated groups when responses are studied | Separates baseline and treatment effects |
| Tissue and stage | Seed, leaf, root, flower, or medicinal organ | Determines which proteome reflects the trait |
| Growth or stress context | Standard growth or defined treatment condition | Limits environmental confounding |
| Replicate unit | Independent plants, pots, or experimental units | Supports defensible group comparison |
Design Variety Comparisons That Breeding Can Use
The cleanest breeding-oriented design compares two or more lines under comparable conditions while keeping non-trait factors as steady as possible. Match across varieties whenever the organ allows structured harvest:
- Developmental stage
- Planting date
- Pot size
- Nutrition
- Light cycle
- Tissue position
- Harvest time
Use independent biological replicates rather than repeated subsamples from one plant when the claim is line-level or variety-level. Replicate number should reflect trait variability and project goals. Plant position, sample preparation order, and LC-MS/MS run order should be randomized or balanced when possible.
Avoid mixing organs unless the question requires it:
- Seed-protein comparisons for quality breeding should not be diluted with leaf samples.
- Root-trait questions should not rely on shoot tissue without clear justification.
When stress is part of the design, standardize the treatment procedure but also record the actual phenotype or physiological status of each line at harvest. Equal treatment duration does not necessarily produce equal effective stress.
For medicinal plants, stress proteomics is most interpretable when the stress protocol, harvest window, and organ choice are fixed before collection. Leaf and root comparisons answer different questions and should not be merged without explicit intent.
Sample requirements depend on species, tissue type, developmental stage, extraction difficulty, and workflow. Confirm the required amount, preservation method, and sample condition before collection rather than applying one universal requirement.
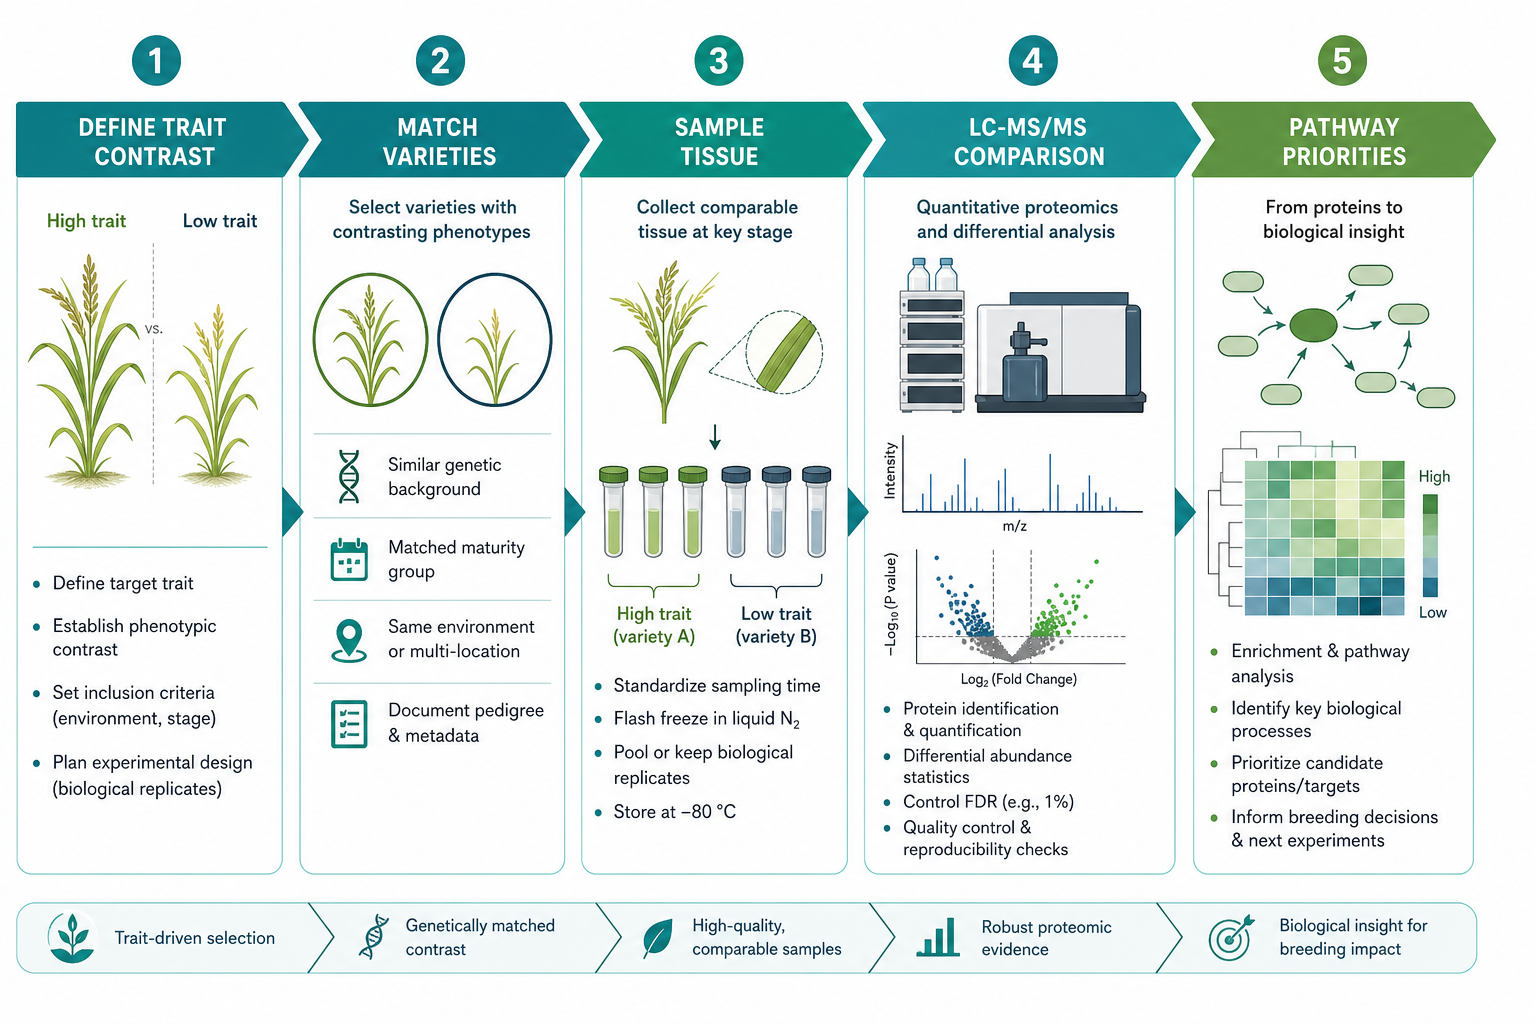
Figure 2. Define the trait contrast, match biological conditions, then move from differential proteins to pathway priorities.
From Differential Proteins to Pathway Priorities
After LC-MS/MS and quantitative comparison, the breeding question shifts from discovery to prioritization. Which protein changes track the trait contrast consistently enough to discuss in a breeding context?
Start with proteins whose direction of change is consistent across biological replicates, not only those with the strongest summary statistics. A moderate but stable shift may matter more than a large fold change driven by one outlier sample.
In treatment-linked designs, distinguish genotype effects, treatment effects, genotype-by-treatment interactions, and predefined comparisons linked to the research objective.
Use functional annotation and pathway views to organize candidates. GO and KEGG themes can highlight:
- Metabolism
- Stress response
- Transport
- Storage protein change
- Secondary metabolism
- Protein synthesis, folding, or degradation
Database-supported association networks may help identify functional modules or highly connected candidates. These networks organize known or predicted associations; they do not demonstrate direct protein interactions in the submitted samples.
Treat pathway enrichment as a prioritization tool. An enriched pathway supports hypothesis formation but does not prove that any single protein controls the trait.
Cross-check differential proteins against phenotype records collected at harvest. Candidates that align with the measured trait are stronger than proteins appearing mainly in uneven, damaged, or outlier samples.
Analytical Choices for Breeding Comparisons
Once groups and tissue suitability look realistic, choose the workflow from the comparison goal.
Protein identification alone fits early exploratory work when the main need is to characterize what is present in a new line or organ. Quantitative comparison is required when the breeding question depends on abundance differences between varieties with contrasting traits.
DDA and DIA can both support comparative plant proteomics. Workflow selection should consider sample complexity, required quantitative consistency, expected proteome depth, missing-data tolerance, and the planned statistical comparison. DDA data may be processed using MaxQuant or Proteome Discoverer, while DIA workflows may be supported by Spectronaut or DIA-NN.
Instrument options such as Orbitrap Exploris 480, timsTOF Pro, and Orbitrap Astral can be discussed according to the confirmed project workflow.
A common breeding path is:
- A first quantitative comparison between well-characterized lines with a strong trait contrast
- Expansion to additional parents, stress stages, or related traits once phenotype scoring and harvest timing are stable
- Follow-up metabolomics, phosphoproteomics, or targeted validation after protein priorities are clearer
Avoid scaling to a large panel before those design elements are confirmed.
Common Mistakes in Breeding-Oriented Proteomics
- Comparing varieties at different developmental stages mixes trait biology with maturity effects.
- Using cultivar labels without measuring the target phenotype weakens interpretation.
- Comparing only treated lines while claiming treatment-induced responses confuses baseline and treatment effects.
- Assuming equal treatment duration produces equal effective stress can confuse tolerance with tissue damage.
- Treating every differential protein as a breeding marker overstates discovery output.
- Using tissue unrelated to the target trait weakens the study.
- Reading pathway enrichment as proof of mechanism overstates the evidence.
- Ignoring phenotype records, outliers, or batch effects can elevate noise to biological meaning.
A Practical Planning Checklist
- Write the trait contrast and phenotype scoring rule.
- Name the varieties or breeding lines being compared.
- Decide whether the study is constitutive or treatment-linked.
- Include matched controls when treatment responses are inferred.
- Choose tissue, developmental stage, and harvest window.
- Match growth and treatment conditions across lines.
- Plan independent biological replicates per group.
- Record phenotype notes at harvest for every replicate.
- Balance plant position, sample preparation, and LC-MS/MS run order.
- Decide whether quantitative comparison or identification-focused screening fits the objective.
- Review whether metabolomics or phosphoproteomics should follow once protein priorities are clearer.
Related Services
Plant Phosphoproteomics Analysis Service
Frequently Asked Questions
1. Can proteomics compare breeding varieties with contrasting traits?
Yes, when the trait contrast, tissue, developmental stage, and growth or stress conditions are defined clearly across lines.
2. What traits are commonly studied with crop trait proteomics?
Yield components, quality traits, stress tolerance, storage proteins, and medicinal plant quality-related responses are common comparison themes.
3. Are matched controls needed in treatment-linked studies?
Matched controls are recommended when the study aims to distinguish baseline genotype differences from shared or genotype-dependent treatment responses.
4. Should all lines receive exactly the same treatment?
The treatment procedure should be standardized, but equal exposure does not always produce equal effective stress. Phenotype or physiological status should also be recorded at harvest.
5. Do differential proteins prove a breeding marker?
No. They are candidate proteins until trait linkage, replicate stability, broader material testing, and follow-up validation support stronger claims.
6. How much plant material is required?
The required amount depends on species, organ, developmental stage, sample condition, extraction difficulty, and workflow. Confirm the requirement before collection.
7. What should be shared before starting a breeding comparison?
Plant materials, research objective, tissue type, phenotype measurement, and the current comparison plan are usually sufficient for an initial discussion.
Conclusion
Proteomics in plant breeding supports variety comparison when the trait contrast is measurable, tissues and conditions are comparable, and differential proteins are read with phenotype and pathway context rather than as automatic markers.
A well-designed comparison can distinguish baseline genotype differences from shared and genotype-dependent treatment responses. The resulting proteins and pathways provide candidates for breeding-related research and functional validation, rather than confirmed markers or causal mechanisms.
To plan proteomics for comparing varieties with contrasting traits, contact MtoZ Biolabs with the available plant materials, research objective, tissue type, and current study design.
How to order?




