






How Mitochondrial Proteomics Reveals Protein Changes After Drug Treatment
Mitochondrial proteomics can show which mitochondrial proteins change in abundance after drug treatment when treated samples are compared to matched vehicle controls at defined dose and time points. The readout is treatment-associated differential proteins, pathway patterns, and a ranked candidate list. It does not classify toxicity, prove mechanism of action, or substitute for respiration, membrane potential, ROS, or cell-viability assays, which are separate modules.
A single treated condition demonstrates that something changed in the organelle proteome, but multiple doses or harvest times strengthen interpretation by separating early direct responses from later secondary remodeling. Vehicle controls at matched solvent concentration and exposure schedule are required so delivery effects are not mistaken for compound biology.
Frame every differential protein as a research-stage candidate. Functional confirmation and independent replication remain necessary before attributing a phenotypic outcome to a specific mitochondrial protein shift.
Why Drug Treatment May Alter the Mitochondrial Protein Profile
Many compounds touch electron transport, membrane integrity, or organelle protein homeostasis either as primary pharmacology or as off-target stress. Literature across chemistries reports abundance shifts in oxidative phosphorylation subunits after respiratory inhibitors, elevated chaperones and quality-control proteins after membrane-active agents, and broader import or metabolic enzyme changes after sustained exposure. The pattern depends on compound class, concentration, and duration.
A treated-versus-control comparison maps which of those themes appear in your system instead of assuming a mechanism from structure alone. Dose and time dimensions help distinguish targeted engagement from generalized injury signatures when both could elevate stress proteins.
Applications
Single-compound treated-versus-vehicle studies at one exposure window to screen for organelle protein responders after acute or chronic treatment.
Dose-response series comparing low, intermediate, and high concentrations with shared vehicle controls to see whether mitochondrial shifts scale with exposure level.
Time-course designs after treatment to separate early direct protein changes from delayed secondary remodeling.
Combination-treatment studies comparing vehicle, drug A, drug B, and drug A plus drug B groups to characterize single-agent and combination-associated protein patterns.
Candidate nomination before target validation, such as confirming a respiratory subunit change by targeted MS or immunoblot at the same dose and harvest time used for discovery.
Advantages of Mitochondrial Proteomics in Drug-Treatment Studies
Organelle enrichment improves detection of respiratory, import, and stress-response proteins that can be diluted in whole-cell lysate after compound exposure.
Quantitative comparison reports direction and magnitude of treatment-associated shifts, supporting pathway interpretation rather than presence-only lists.
Dose and time factors, when built into the design, strengthen ranking by showing which proteins track exposure intensity or appear only at specific harvest windows.
Flexible workflows using DDA with MaxQuant or Proteome Discoverer, DIA with Spectronaut or DIA-NN, or TMT multiplexing accommodate multiple treatment arms in one study.
Data deliverables integrate with downstream validation planning because candidates arrive with treatment context attached.
What Treated-Versus-Control Comparisons Reveal
Treatment-associated proteins are those whose abundance differs between drug-exposed and vehicle-control samples under matched handling. Pathway grouping shows whether hits concentrate in oxidative phosphorylation, import machinery, chaperone systems, or metabolic enzymes, hinting at targeted engagement versus diffuse stress. When several doses or times are included, proteins that track dose or appear only at early versus late harvest separate primary responders from downstream changes. Replicate consistency across independent treatment experiments yields a ranked list for Phase 2 follow-up.
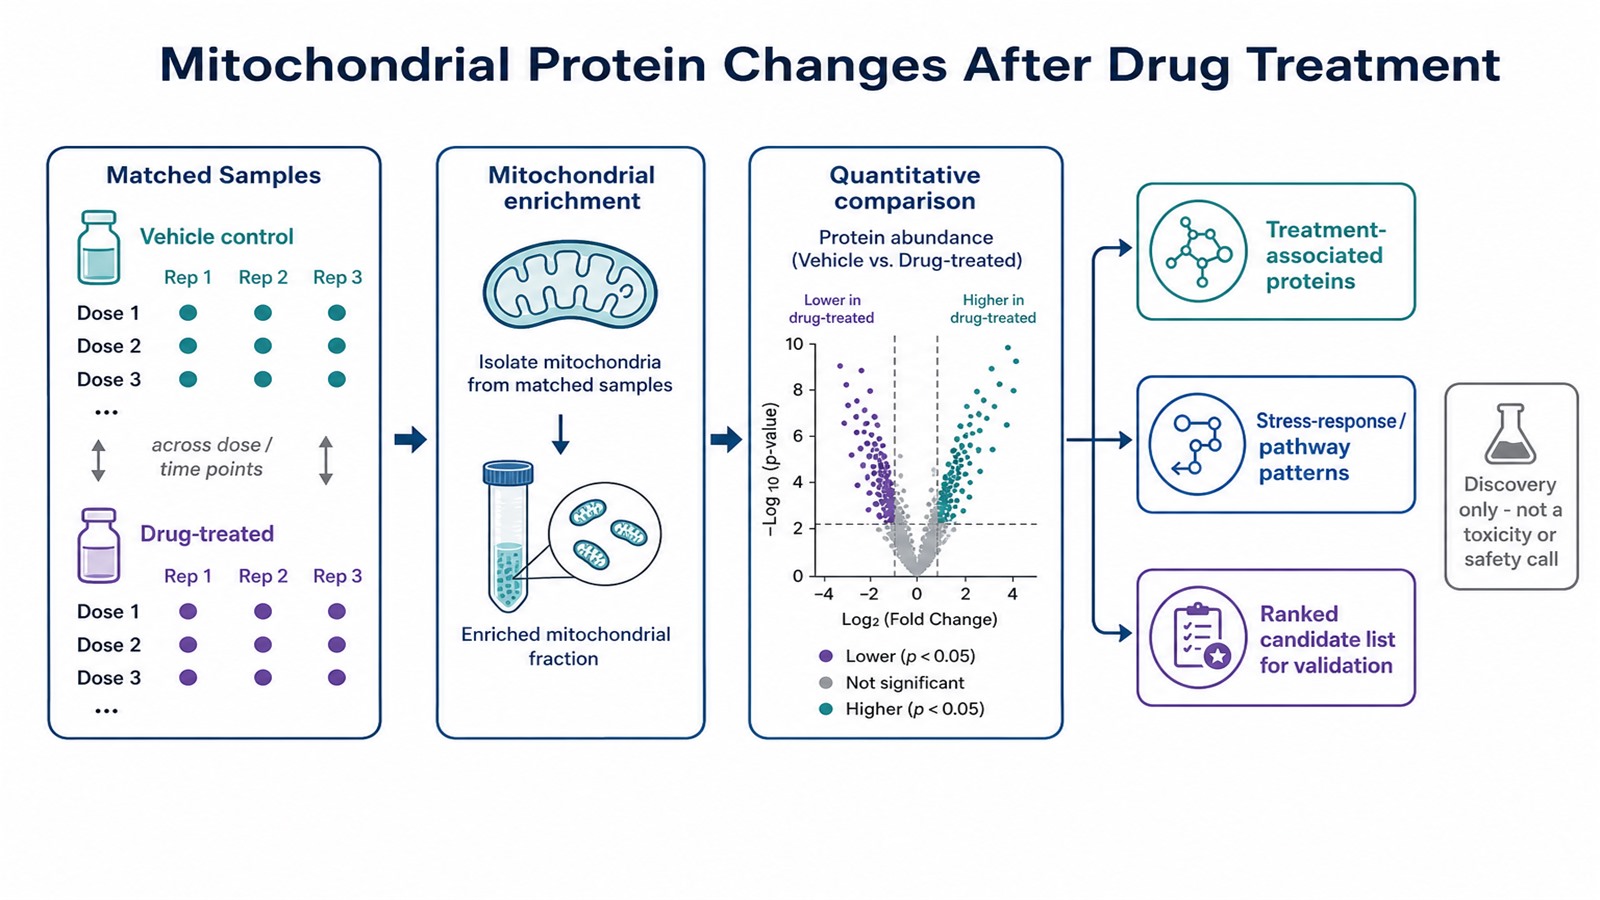
Figure 1. Matched treated and vehicle-control samples feed a comparison that returns differential mitochondrial proteins and stress-response patterns for validation.
What It Cannot Tell You
Abundance change after treatment is not proof of impaired respiration, membrane depolarization, or cell death. Those endpoints require dedicated assay modules outside proteomics.
Proteomics does not deliver a toxicity classification or regulatory safety verdict. Avoid language that implies a hazard determination from protein lists alone.
Early and late responses can coexist in one comparison if only a single late harvest is taken. Without time resolution, direct targets and secondary stress responses may be merged unless dose or kinetic design separates them.
Groups that differ in solvent volume, serum batch, confluence, or harvest delay introduce confounding that proteomics cannot correct after the fact.
Dose and Time as Design Variables
Dose spacing should bracket relevant exposure levels from subtoxic engagement through clearly stress-inducing concentrations if the question allows, always with parallel vehicle controls at each dose tier. Identical solvent composition across arms prevents carrier effects from mimicking compound responses.
Time points should reflect the biology under study. Short exposures highlight immediate organelle stress proteins; longer exposures reveal adaptive remodeling or cumulative injury markers. Align harvest timing exactly across replicates so handling differences do not create false treatment calls.
Washout arms, when used, need matched vehicle washout controls and defined intervals between compound removal and harvest so recovery dynamics are interpretable.
Compound stability in media should be documented when exposure spans many hours or days. Degradation or metabolism can change effective concentration over time and produce protein shifts that track incubation length rather than intended pharmacology unless media refresh or replenishment is standardized across treated and control wells.
Interpreting Treatment Signatures at the Pathway Level
A focused shift limited to one respiratory complex or import submodule suggests targeted organelle engagement worth following with compound-specific validation. Broad elevation of chaperones, proteases, and multiple complex subunits often resembles generalized mitochondrial stress and may appear at high dose even when lower doses show narrower signatures. Comparing dose tiers helps separate on-target remodeling from injury-like patterns.
When time-course arms are included, proteins that appear at the first harvest and persist through later points differ interpretively from those that emerge only after extended exposure. The former may track immediate pharmacology; the latter may reflect adaptive or secondary remodeling. Reporting candidates with dose and time metadata keeps downstream validation aligned with the exposure window where the change was detected.
When to Use Mitochondrial Proteomics, and When to Reframe
|
Situation |
Fit for mitochondrial proteomics |
Recommended action |
|---|---|---|
|
Matched treated and vehicle-control samples |
Strong |
Run quantitative organelle-focused comparison |
|
Question targets mitochondrial protein abundance after treatment |
Strong |
Enrich mitochondria with consistent chemistry |
|
Goal is candidate discovery for validation |
Strong |
Plan Phase 2 confirmation at same dose and time |
|
Need to separate direct from secondary effects |
Partial |
Add dose tiers or time-course arms |
|
Claim requires respiration or viability data |
Partial |
Add functional assays as a separate module |
|
Treatment and control differ beyond drug and vehicle |
Weak |
Fix matching before analysis |
Designing the Drug-Treatment Comparison in Two Phases
Phase 1 locks treatment schema and controls. Define compound stock, vehicle composition, concentration series, exposure duration, and harvest time. Include vehicle-only controls at every dose tier and time point. Collect biological replicates from independent treatment experiments, not repeated aliquots from one plate. Plan input around 5x10^7 cells per unit, about 200 mg tissue per unit, or isolated mitochondrial protein at 50 ug minimum with 80 to 100 ug preferred per condition, at 0.5 ug/uL minimum and 1 ug/uL or higher preferred.
Phase 2 standardizes organelle preparation and acquisition. Process treated and control material with identical enrichment workflows in parallel. Choose DDA, DIA, or TMT based on the number of dose and time conditions. Orbitrap Exploris 480, timsTOF Pro, or Orbitrap Astral may be selected when depth or multiplex demand requires it. Analyze with MaxQuant, Proteome Discoverer, Spectronaut, or DIA-NN as matched to acquisition mode. Confirm scarce material with MtoZ Biolabs before treatment begins.
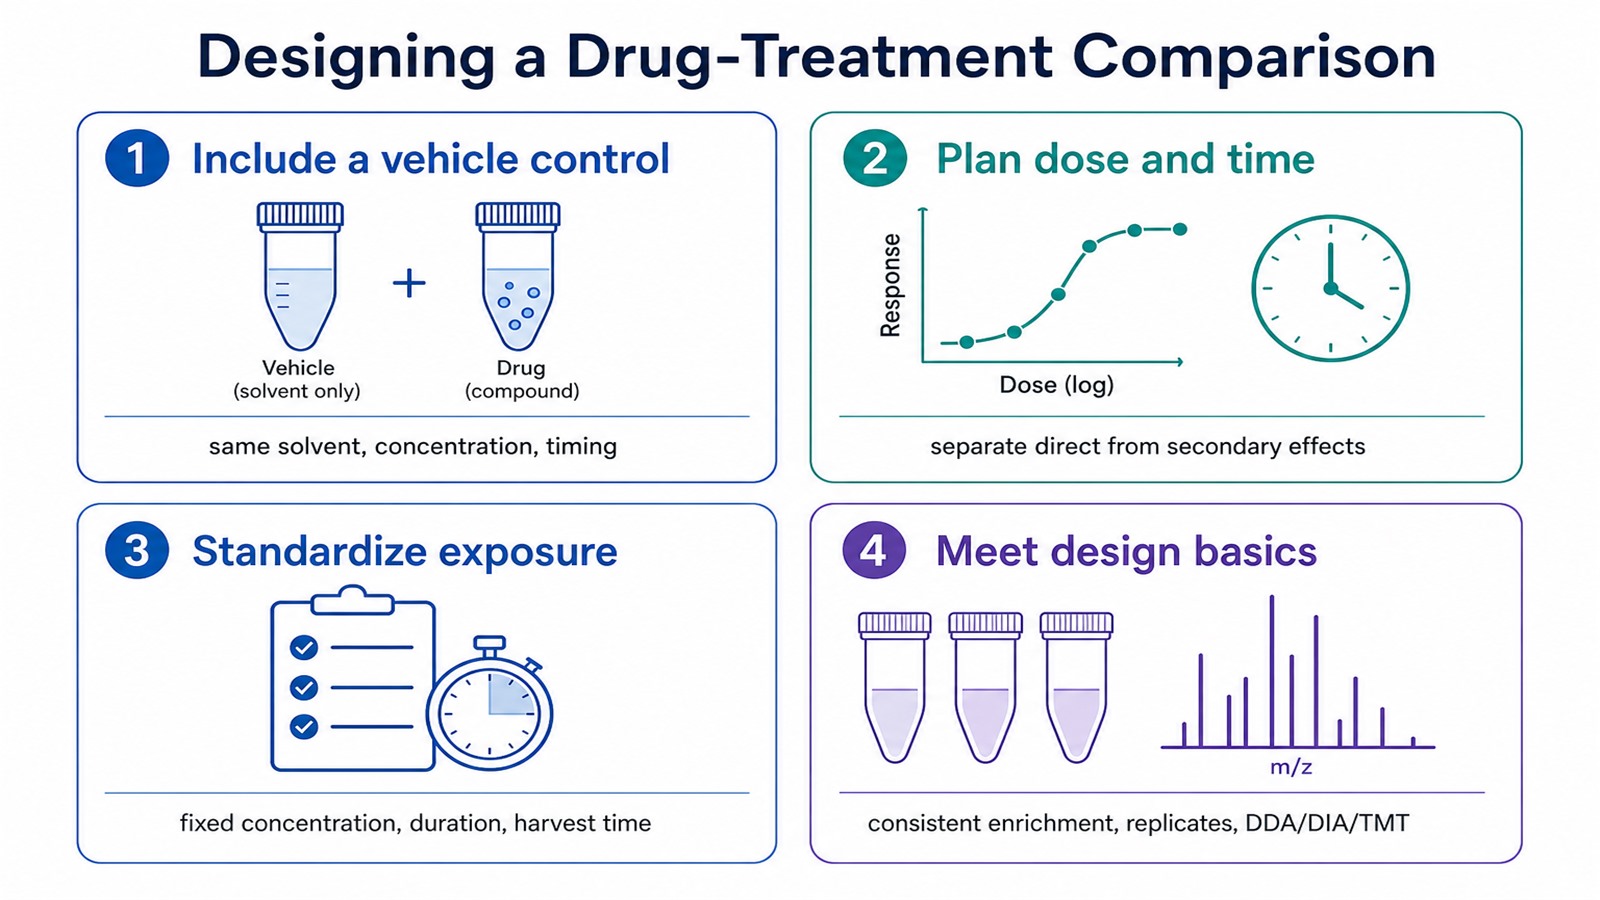
Figure 2. A defensible drug-treatment comparison uses a vehicle control, planned dose or time, and standardized exposure across arms.
Related Services
Mitochondrial Proteomics Service
Mitochondrial Isolation and Mitochondrial Protein Purification Service
Subcellular Proteomics Service
Frequently Asked Questions
Can mitochondrial proteomics detect a drug's mechanism of action?
It identifies candidate proteins and pathways that change after treatment. These are hypotheses about mechanism and require functional and independent validation before a mode of action is claimed.
Should the study include more than one dose or time point?
Where possible, yes. Multiple doses or time points help separate early direct effects from later secondary responses and make the candidate list more credible than a single treated condition.
Does the analysis measure mitochondrial respiration or toxicity?
No. Proteomics measures protein abundance, not respiration, membrane potential, ROS, viability scoring, or regulatory toxicity endpoints. Those readouts require separate assay modules.
How much sample is needed per condition?
Plan around 5x10^7 cells per unit, about 200 mg tissue per unit, or isolated mitochondrial protein at 50 ug minimum with 80 to 100 ug preferred for each biological replicate in each treatment arm.
Why is a vehicle control necessary?
The solvent used to deliver a compound can alter the proteome. Matched vehicle controls at the same concentration and schedule attribute differences to the drug rather than to the carrier.
Can I compare treated samples to untreated cells with no vehicle?
Vehicle controls are strongly preferred. Untreated cells that never received solvent can differ in handling and stress baseline, weakening treated-versus-control interpretation.
Conclusion
Mitochondrial proteomics supports drug-treatment research when treated and vehicle-control samples differ only in compound exposure and when dose and time are planned to capture how organelle proteins respond. It reports treatment-associated mitochondrial proteins and pathways, ranks candidates for validation, and leaves respiration, viability, and related phenotypes to separate modules. Keeping claims at the candidate level preserves interpretability when compounds produce both targeted and stress-like signatures.
Researchers planning a treatment study can review dose, time, and sample requirements with MtoZ Biolabs before exposure. Bring the compound schema, control design, replicate plan, and expected deliverables so mitochondrial protein analysis aligns with the treatment question from the start.
How to order?




