






Mitochondrial Proteomics for Comparing Drug-Sensitive and Drug-Resistant Cancer Models
Mitochondrial proteomics can compare drug-sensitive and drug-resistant cancer models from the same lineage and report which mitochondrial proteins change in abundance as resistance emerges. The output is a differential protein list, pathway patterns, and ranked candidates associated with the resistant state. It does not prove that any protein drives resistance, measure respiration or metabolic flux, or replace functional validation.
The comparison works when sensitive and resistant lines share origin and differ mainly in resistance status, and when both arms are prepared with identical enrichment and handling. Paired models generated by stepwise drug exposure, transgenic rescue lines, or CRISPR-edited targets are all usable if passage history and selection pressure are documented so lineage drift does not masquerade as resistance biology.
Treat results as discovery-stage evidence. A protein elevated in resistant cells may reflect adaptation, compensation, or an unrelated clone effect until confirmed with orthogonal assays and perturbation tests in matched backgrounds.
Why Mitochondria Appear in Drug Resistance Research
Cancer cells under selective pressure often remodel metabolism and survival pathways tied to the organelle. Literature across lineages reports shifts in oxidative phosphorylation subunits, tricarboxylic acid cycle enzymes, and proteins linked to apoptotic regulation when cells survive chemotherapy or targeted agents. Redox handling and import machinery also recur as candidate nodes because they influence how cells tolerate treatment stress.
These patterns are model-specific. A shift seen with paclitaxel-resistant ovarian lines may not appear in erlotinib-resistant lung models. A sensitive-versus-resistant proteomic comparison shows which organelle proteins actually move in your pair rather than assuming a universal resistance signature.
Applications
Paired cell line comparisons where a parental sensitive line and its drug-selected resistant derivative are analyzed to nominate proteins linked to the resistant phenotype.
Isogenic CRISPR or overexpression models that differ only in a proposed resistance gene, used to see whether mitochondrial protein shifts follow genetic manipulation in a controlled background.
Cross-drug panels within one lineage asking whether mitochondrial remodeling is shared across agents or specific to a compound class.
Candidate prioritization before knockdown, knockout, or rescue experiments that test whether a nominated protein contributes to survival under drug pressure.
Biomarker exploration when a stable abundance shift in resistant cells suggests a monitorable organelle protein, subject to independent confirmation in additional pairs and clinical specimens.
Advantages of Mitochondrial Proteomics in Paired Resistance Models
Organelle enrichment raises detection depth for respiratory, metabolic, and apoptosis-related proteins that may be diluted in whole-cell lysate from highly proliferative cultures.
Quantitative comparison between sensitive and resistant arms reports direction and magnitude, which supports ranking candidates for limited validation bandwidth.
Pathway grouping clarifies whether resistance associates with broad oxidative phosphorylation remodeling, focused complex changes, or scattered stress-response hits.
Paired design from one lineage reduces genetic background noise relative to comparing unrelated cell lines, so differential calls are more likely to reflect resistance-associated biology when matching is maintained.
Acquisition flexibility through DDA with MaxQuant or Proteome Discoverer, DIA with Spectronaut or DIA-NN, or TMT multiplexing adapts to the number of pairs and replicates in the study.
What a Sensitive-Versus-Resistant Comparison Reveals
The primary readout is differential mitochondrial protein abundance between resistant and sensitive states under matched culture and enrichment conditions. Proteins that increase or decrease with resistance are reported with replicate-supported effect direction. Pathway analysis groups hits into oxidative phosphorylation, metabolic enzyme sets, import and quality-control modules, or redox-related proteins, which helps distinguish focused remodeling from diffuse stress signatures. The ranked candidate list emphasizes proteins that replicate across independent cultures or passages and separates them from one-off shifts that may reflect clone noise.
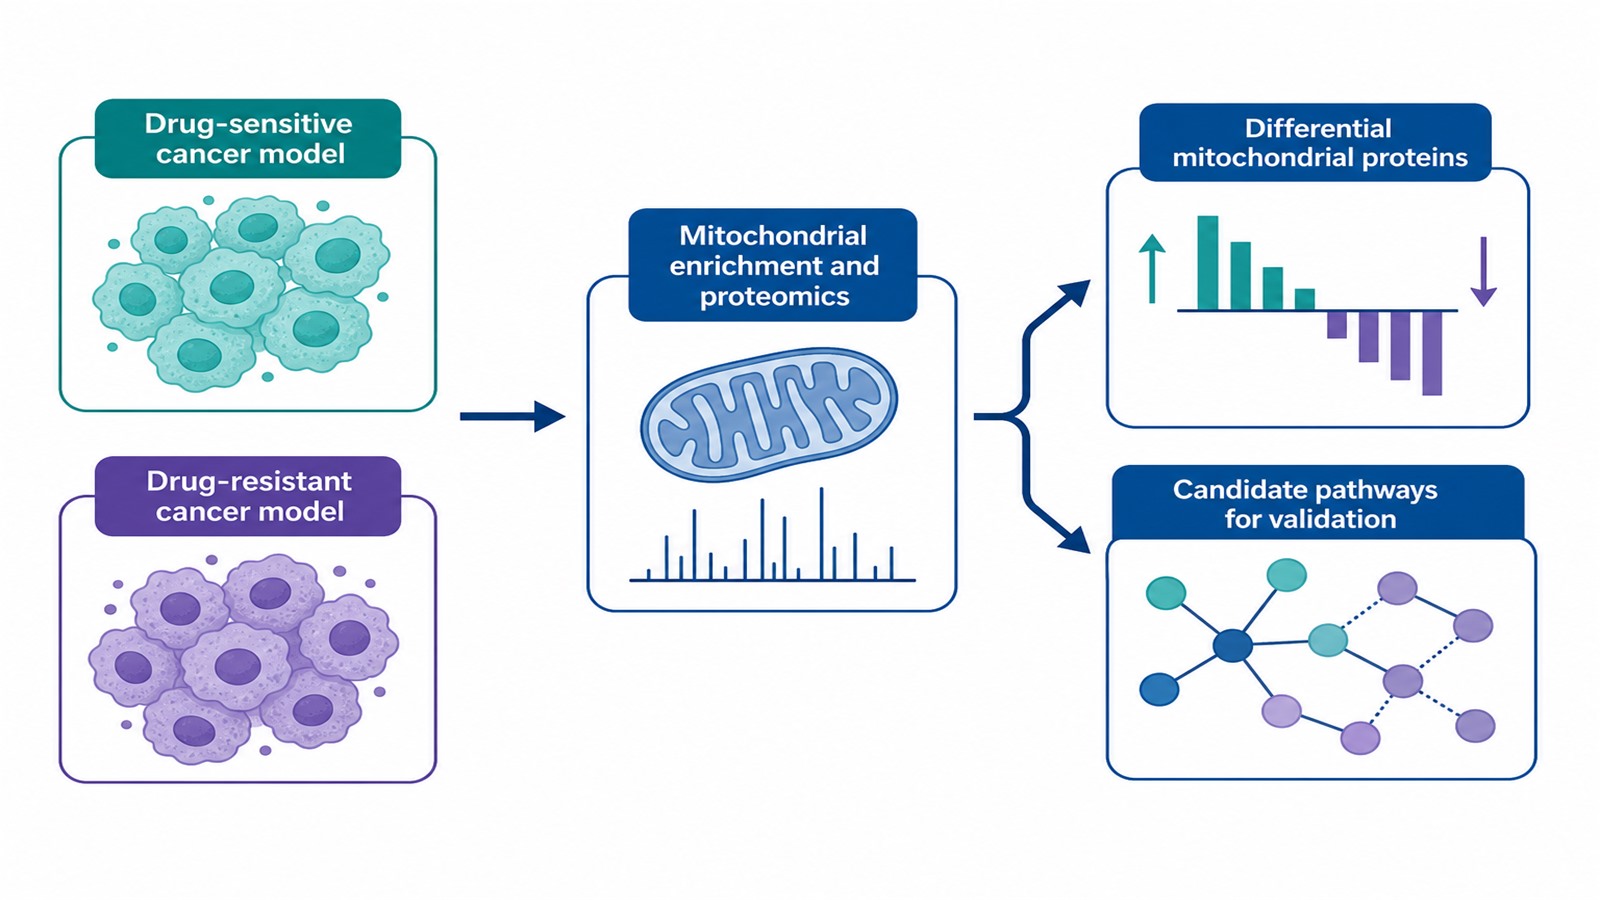
Figure 1. Paired sensitive and resistant models feed a matched comparison that returns differential mitochondrial proteins and candidate pathways.
What It Cannot Tell You
Abundance change is not proof of altered respiration, membrane potential, or ROS handling. Those phenotypes require separate assay modules outside proteomics.
A differential protein is not automatically a resistance driver. The comparison associates protein shifts with the resistant state; causality requires genetic or pharmacologic follow-up in the same background.
Long-term culture and drug selection introduce drift. If resistant lines diverged in ploidy, growth rate, or off-target mutations, proteomic differences may partly reflect clonal evolution unrelated to the drug target mechanism.
Enrichment profiles vary with input and chemistry. Interpret results as organelle-enriched abundance changes, not as absolute organelle purity metrics.
Paired Model Design: Keeping Resistance as the Main Contrast
A defensible resistance study starts with lineage documentation. Record how the resistant line was derived, the drug and concentration used for selection, passage number at harvest, and whether a sensitive control from the same frozen stock was expanded in parallel. Sensitive and resistant cells should be harvested at comparable confluence and growth phase so culture state does not confound organelle protein levels.
Drug exposure history matters even at harvest under drug-free conditions. Some pairs are maintained on maintenance dose while others are washed out before collection; the scheme should be identical across arms being compared. If resistant cells acquired secondary mutations, note whether whole-exome or targeted sequencing is available to interpret unexpected protein shifts.
Resistance phenotype should be reconfirmed close to harvest using the same functional readout applied during selection, such as IC50 shift or colony survival under drug, so the proteomic comparison aligns with a verified resistant state rather than a label applied many passages earlier.
Biological replicates should come from independent cultures or cryopreserved aliquots, not repeated preps from one flask. Technical duplicates help monitor preparation consistency but do not substitute for independent biological units when claiming resistance-linked biology.
When to Use Mitochondrial Proteomics, and When to Reframe
|
Situation |
Fit for mitochondrial proteomics |
Recommended action |
|---|---|---|
|
Paired sensitive and resistant lines from one lineage |
Strong |
Run matched quantitative organelle comparison |
|
Question targets mitochondrial protein abundance |
Strong |
Apply consistent enrichment across both arms |
|
Goal is candidate nomination for validation |
Strong |
Plan perturbation follow-up in Phase 2 |
|
Claim requires respiration or membrane potential data |
Partial |
Add functional assays as a separate module |
|
Lines differ in passage history or selection protocol |
Weak |
Re-establish matched cultures before analysis |
|
Unrelated cell lines compared without shared origin |
Weak |
Reframe as exploratory or rebuild a paired model |
Designing the Comparison in Two Phases
Phase 1 locks the model pair and harvest parity. Confirm resistance phenotype with the same assay used during selection, align passage and confluence, and collect independent biological replicates from each arm. Plan input at roughly 5x10^7 cells per unit or isolated mitochondrial protein at 50 ug minimum with 80 to 100 ug preferred, at 0.5 ug/uL minimum concentration and 1 ug/uL or higher preferred.
Phase 2 standardizes organelle isolation and acquisition. Use the same enrichment protocol on sensitive and resistant material harvested in parallel. Select DDA, DIA, or TMT to fit the number of conditions and replicates. Orbitrap Exploris 480, timsTOF Pro, or Orbitrap Astral may be deployed when depth or throughput requires it. Process data with MaxQuant, Proteome Discoverer, Spectronaut, or DIA-NN according to acquisition mode. Confirm scarce pairs with MtoZ Biolabs before collection.
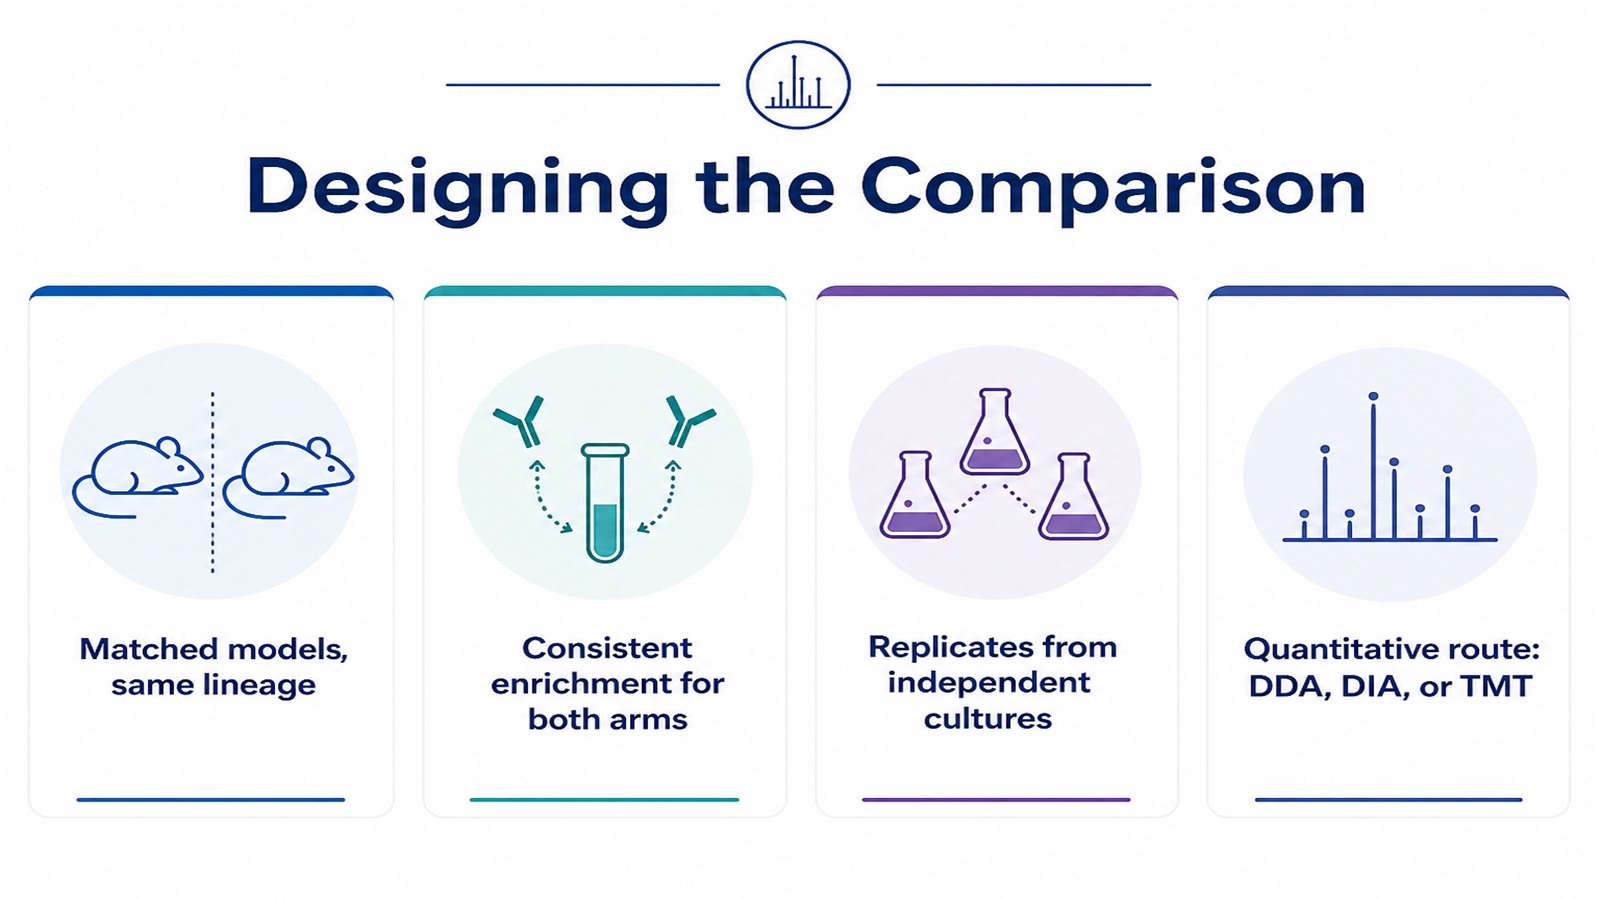
Figure 2. A defensible resistance comparison keeps resistance status as the main variable across matched, consistently prepared arms.
Related Services
Mitochondrial Proteomics Service
Mitochondrial Isolation and Mitochondrial Protein Purification Service
Subcellular Proteomics Service
Frequently Asked Questions
Can mitochondrial proteomics identify drug resistance mechanisms?
It identifies candidate proteins and pathways that differ between sensitive and resistant models. These are hypotheses associated with the resistant phenotype and require functional validation before a mechanism is claimed.
What sample do I need for a sensitive-versus-resistant comparison?
Paired models from the same lineage, prepared identically. Plan around 5x10^7 cells per unit or isolated mitochondrial protein at 50 ug minimum with 80 to 100 ug preferred for each biological replicate.
Does the analysis measure mitochondrial respiration?
No. Proteomics measures protein abundance, not respiration, membrane potential, or ROS. Those readouts require separate assay modules outside the proteomics workflow.
Should the comparison be quantitative rather than identification only?
Yes. Comparing two states requires quantification because identification alone reports presence without the abundance differences that distinguish resistant from sensitive cells.
How many replicates does a paired resistance study need?
Enough independent biological units to separate resistance-linked changes from routine culture variation. The count depends on effect size and model stability and is agreed during study design.
What if my resistant line was passaged many more times than the sensitive control?
Passage imbalance introduces drift unrelated to resistance. Re-expand both lines from early frozen stocks in parallel, match passage at harvest, or treat extra differential proteins as potential culture artifacts until validated.
Conclusion
Mitochondrial proteomics is a practical discovery tool for paired drug-sensitive and drug-resistant cancer models when both lines share origin, differ mainly in resistance status, and are processed with consistent organelle enrichment. It surfaces mitochondrial proteins and pathways that shift with resistance and delivers a ranked candidate list for targeted follow-up, while respiration and related functional readouts remain separate modules. Keeping the design focused on matched pairs preserves interpretability in a field where clonal drift is common.
Researchers planning a resistance comparison can review the model pair and analytical plan with MtoZ Biolabs before collection. Bring lineage history, resistance selection details, sample amounts, and the output format you need so mitochondrial protein analysis is scoped to the resistance question from the start.
How to order?




