






How to Compare Mitochondrial Protein Changes Across Aging Stages
Mitochondrial proteomics can compare protein abundance across ordered aging stages when samples represent at least two, and preferably three or more, clearly defined age groups with matched handling. The output identifies stage-associated mitochondrial and mitochondria-associated proteins, reports direction and relative magnitude for each contrast, and reveals whether changes follow a progressive trend or appear only at a late stage. This is a discovery readout at the protein level, not a functional or clinical test.
Multi-stage aging comparisons differ from a simple two-group design in both planning and interpretation. Each stage needs its own biological replicates from independent units, not pooled aliquots from a single harvest. Covariates such as sex, diet, body weight, and tissue composition often shift with age and must be balanced or recorded across stages. Unless the same subjects are followed longitudinally, trends across stages are inferred from cross-sectional groups and should be described that way.
Protein abundance is not activity. A shift in a respiratory subunit across stages does not by itself prove altered respiration, membrane potential, or turnover. Those functional readouts require separate assays outside a proteomics workflow. Treating proteomics output as stage-associated candidates for validation keeps the interpretation defensible in a field where biological variability grows with age.
Why Multi-Stage Aging Comparisons Need a Dedicated Design
Aging research often produces samples from young, middle-aged, and old animals, cells at different passage or senescence states, or tissue collected at ordered time points. A two-group young-versus-old contrast can show that something changed, but it cannot distinguish a progressive shift from a late-onset event or a transient peak at an intermediate stage. Three or more well-separated stages let the analysis separate these patterns.
Mitochondrial change is a recurring theme in aging literature, which is why protein-level readouts are useful for locating where that change happens. Bioenergetic capacity, protein turnover pathways, and oxidative damage responses all appear across tissues and models, but the specific proteins involved differ by matrix and stage definition. A staged comparison tests which themes actually appear in your samples rather than assuming any in advance.
Because variability increases with age, replicate planning per stage matters more than in many two-group studies. An underpowered late stage can flatten a real trend, while an unmatched covariate can create false stage associations that look biological but reflect diet, sex imbalance, or tissue composition instead.
What a Multi-Stage Comparison Reveals
A staged mitochondrial proteomics comparison produces several linked readouts, all at the level of protein abundance.
Stage-associated proteins are proteins whose abundance differs between age stages, reported with direction and relative magnitude for each pairwise or multi-group contrast. With three or more stages, trend patterns become informative. A change may be progressive across age, appear only at a late stage, or peak at an intermediate stage. That pattern is more informative than a single young-versus-old fold change.
A ranked candidate list emerges from proteins that change consistently across biological replicates and follow a coherent trend. These candidates form the shortlist worth carrying into validation, which keeps an aging project focused on the most credible signals rather than every detected difference.
The comparison also maps which functional themes appear at which stage. Respiratory chain subunits, import machinery, and turnover-related proteins may shift at different points in the aging sequence. That stage-resolved map is often the primary value of a multi-group design.
Interpretation Limits You Should Set Before Collection
Setting limits early protects aging projects from overclaiming.
Protein abundance is not activity. Detecting lower abundance of a complex I subunit at an old stage does not prove reduced respiration. Functional confirmation requires separate assays that sit outside proteomics scope.
Cross-sectional stages are snapshots, not continuous trajectories. Unless the same units are sampled repeatedly over time, any trend across stages is inferred from independent groups collected at different ages. Report that inference explicitly rather than describing it as a measured trajectory.
Age travels with confounders. Body weight, sex balance, diet, housing, and tissue composition can shift with age. These factors should be recorded and balanced across stages so age remains the main difference. Any factor that cannot be balanced should be noted in the interpretation.
Enrichment produces an enrichment profile, not absolute purity. Stage comparisons depend on matched enrichment chemistry across every stage, not on assuming a perfectly pure organelle proteome.
Multi-Stage Aging Design: Planning Checklist
A staged comparison supports strong conclusions only when age is the main difference between groups and each stage is defined the same way.
Define stages before collection. Fix what each stage means, whether by chronological age, passage number, or a senescence marker, and apply the definition consistently so groups are truly comparable. Vague labels such as "middle-aged" without a numeric cutoff create ambiguity that weakens every downstream contrast.
Balance covariates across stages. Sex, diet, housing, and tissue source should be balanced so age is not confounded. Record any factor that cannot be balanced for later interpretation.
Plan replicates per stage, not just overall. Each stage needs enough biological replicates from independent units to detect a trend. An ordered design benefits from a similar replicate count in every stage, because an underfilled late arm can distort trend calling.
Lock enrichment and input path. Enrich mitochondria with consistent chemistry across all stages. Plan sample amounts at ~5×10^7 cells per unit, ~200 mg of tissue, or isolated mitochondrial protein at ≥50 μg with 80 to 100 μg preferred and a concentration of ≥0.5 μg/μL, preferably ≥1 μg/μL, for each replicate in each stage.
Select a quantitative route that handles several arms. Multi-group comparisons typically use DIA analyzed with Spectronaut or DIA-NN, or TMT with a channel layout locked before collection. Small pilot stage comparisons may use DDA with MaxQuant or Proteome Discoverer. Confirm scarce samples with MtoZ Biolabs before collection.
|
Design element |
Requirement for multi-stage aging comparison |
|---|---|
|
Stage definition |
Fixed, numeric, applied consistently |
|
Minimum stages |
Two for any contrast; three or more for trend calling |
|
Replicates |
Independent biological units per stage, evenly planned |
|
Covariate balance |
Sex, diet, housing matched or recorded |
|
Starting material |
Same enrichment path across all stages |
|
Output scope |
Stage-associated protein candidates, not functional proof |
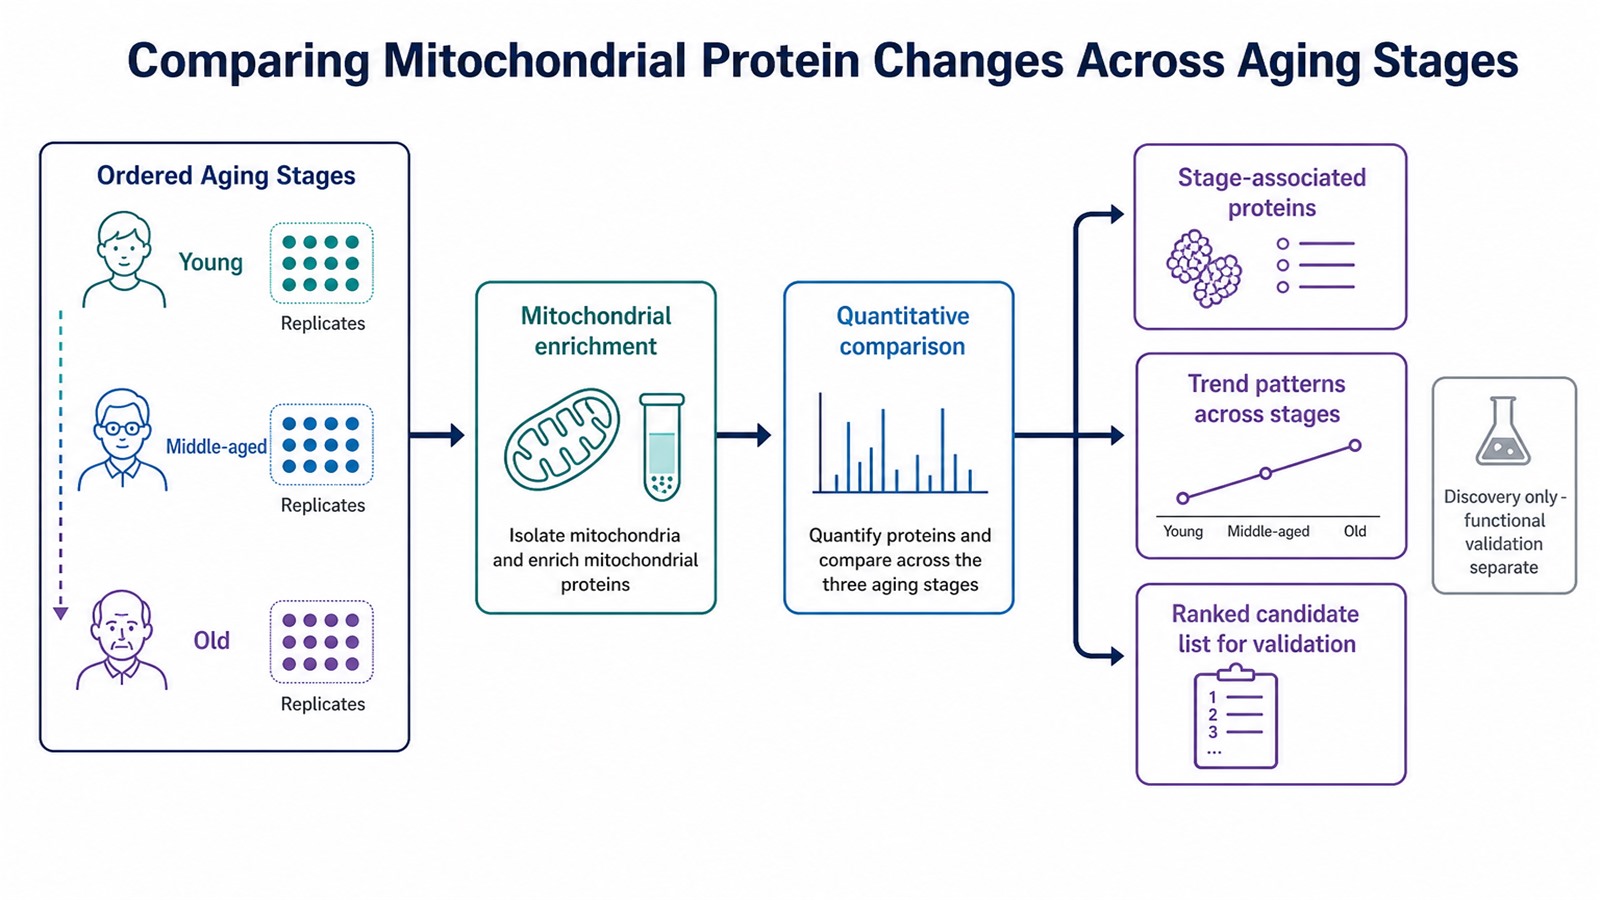
Figure 1. Samples from ordered aging stages feed a comparison that returns differential mitochondrial proteins and stage-to-stage trend patterns for validation.
Reading Stage Trends Without Overclaiming
When three or more stages are analyzed, describe the pattern the data support rather than the pattern you expect. A progressive decline across stages, a late-onset shift, or an intermediate peak each implies different biology and different follow-up experiments.
Pairwise contrasts between adjacent stages and global multi-group tests answer different questions. Adjacent contrasts highlight when a shift first appears. Global tests ask whether abundance differs across the full stage series. Both are valid, but they should be planned before analysis so the interpretation matches the statistical approach.
Candidate proteins that change in one tissue or model may not generalize. Validation in an independent cohort, a second tissue, or a targeted follow-up experiment strengthens any aging claim beyond the discovery list.
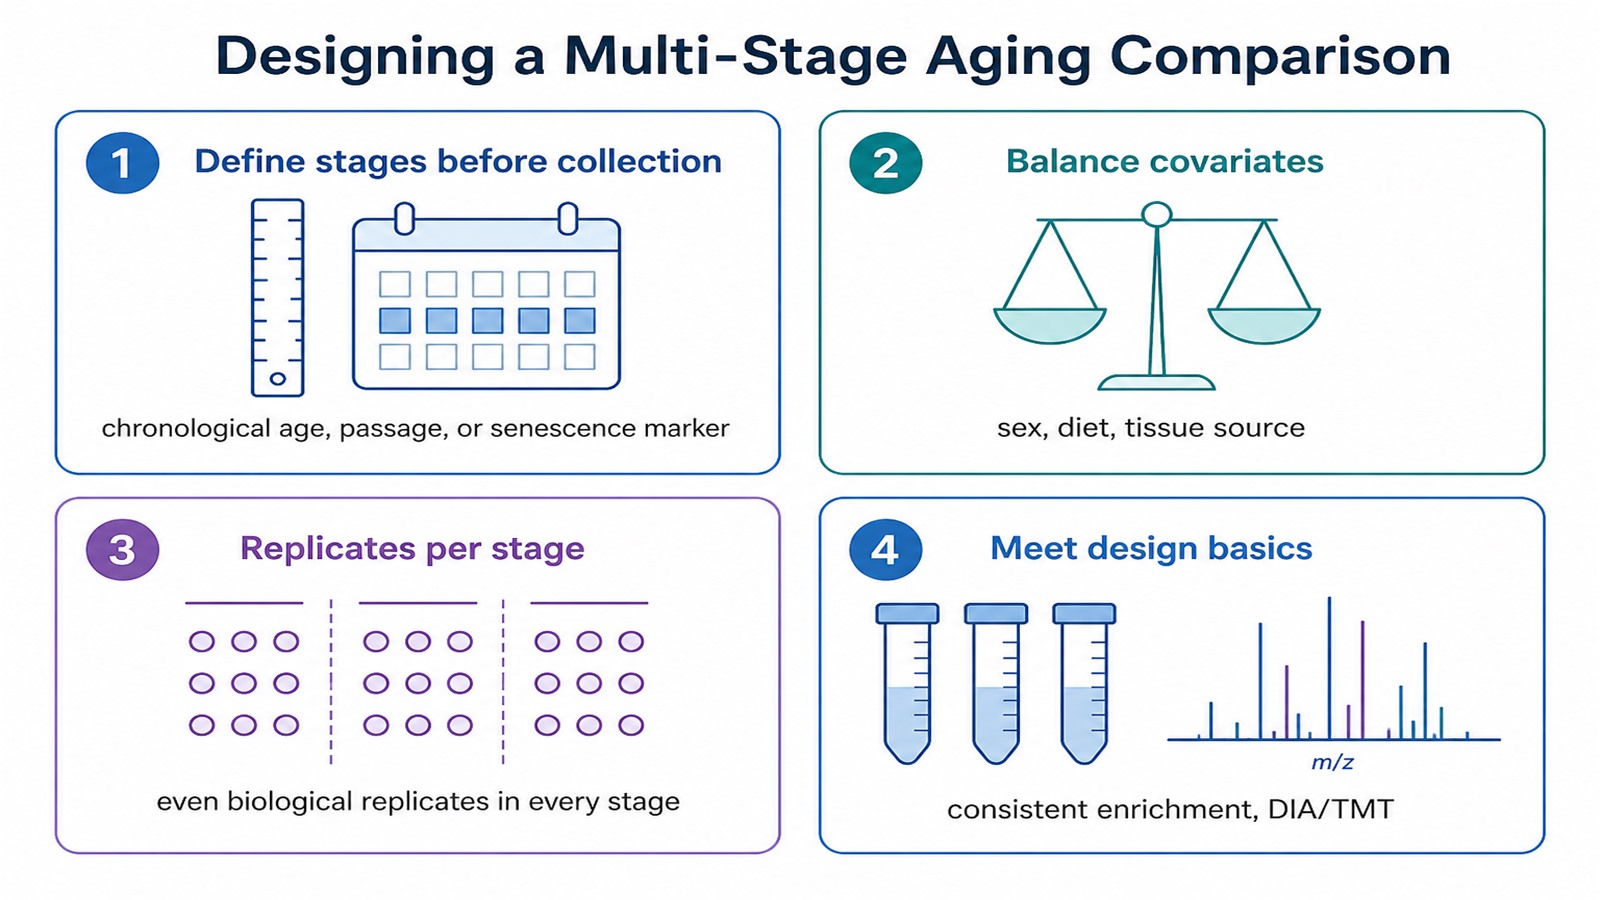
Figure 2. A defensible aging comparison defines stages, balances covariates, and keeps replicates even across every stage.
Related Services
Mitochondrial Proteomics Service
Mitochondrial Isolation and Mitochondrial Protein Purification Service
Subcellular Proteomics Service
Frequently Asked Questions
How many aging stages should a study include?
At least two stages are required for any comparison, but three or more well-separated stages are far better because they let the analysis distinguish a progressive trend from a change that appears only late.
Can mitochondrial proteomics show a continuous aging trajectory?
It shows abundance differences and associations across the ages or stages that were sampled. Cross-sectional groups do not directly measure a within-individual trajectory. Longitudinal interpretation requires repeated measurements from the same biological units and appropriate repeated-measures analysis.
Does the analysis measure mitochondrial respiration or turnover?
No. Proteomics measures protein abundance, not respiration, membrane potential, or mitophagy. Those functional readouts require separate assays outside the proteomics workflow.
How much sample is needed per stage?
Typical MtoZ Biolabs planning guidance includes approximately 5 × 10^7 cultured cells or approximately 200 mg of animal tissue per sample for mitochondrial enrichment. A client-prepared mitochondrial fraction or extracted mitochondrial protein should provide at least 50 µg of measurable protein, with 80–100 µg preferred when possible.
Why is covariate balance so important in aging studies?
Factors such as sex, diet, and body weight often shift with age. If they are not balanced across stages, age-linked protein differences can be confounded by these covariates rather than by aging itself.
Conclusion
Mitochondrial proteomics is a strong discovery tool for aging research when stages are clearly defined, well matched, and the question is about protein-level change across age. It reveals which mitochondrial proteins shift between stages, whether those shifts follow a coherent trend, and which candidates are worth validating, while leaving functional confirmation to separate assays. Treating the output as stage-associated candidates keeps the interpretation defensible in a field where variability grows with age.
Researchers weighing this approach can review the plan with MtoZ Biolabs before collection. It helps to arrive with the sample type and source, the stage definitions and sample amount, the planned groups and replicates, and the expected analytical output, so mitochondrial protein analysis is matched to the aging question from the start.
How to order?




