


KEGG Pathway Annotation and Enrichment Analysis Service
KEGG (Kyoto Encyclopedia of Genes and Genomes) is a database used for systematic analysis of metabolic pathways and functions of gene products in cells. KEGG combines gene with its expression information as a whole network. KEGG records data from genome, chemical molecule, and biochemical system, including metabolic pathways (PATHWAY), drugs (DRUG), diseases (DISEASE), gene sequences (GENES), and genomes (GENOME).
1. Statistics of KEGG Mapping Results for All Identified Proteins
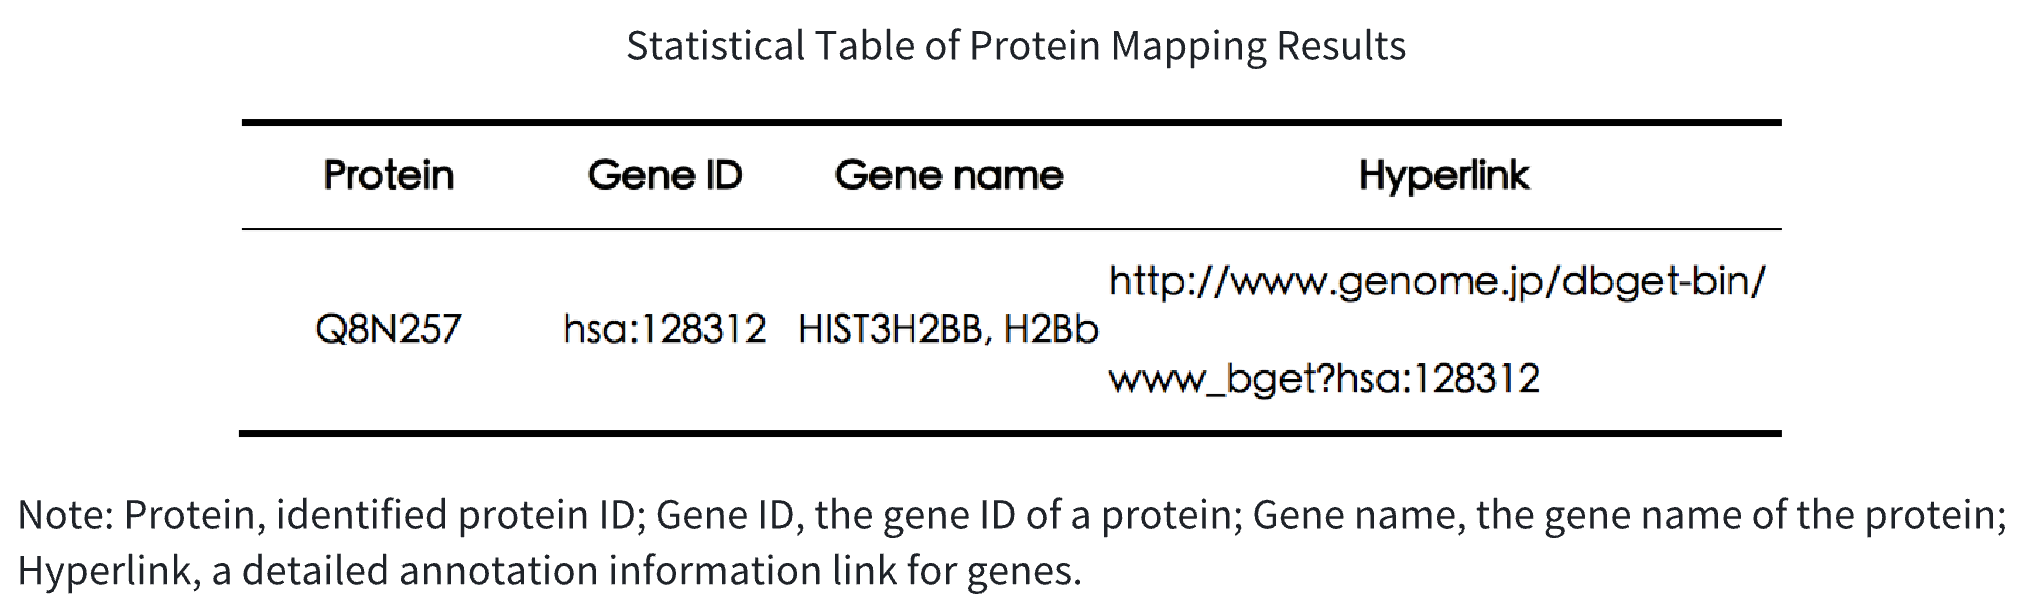
Table 1. Statistical Table of Protein Mapping Results
2. Statistics of KEGG Annotation Results for All Identified Proteins
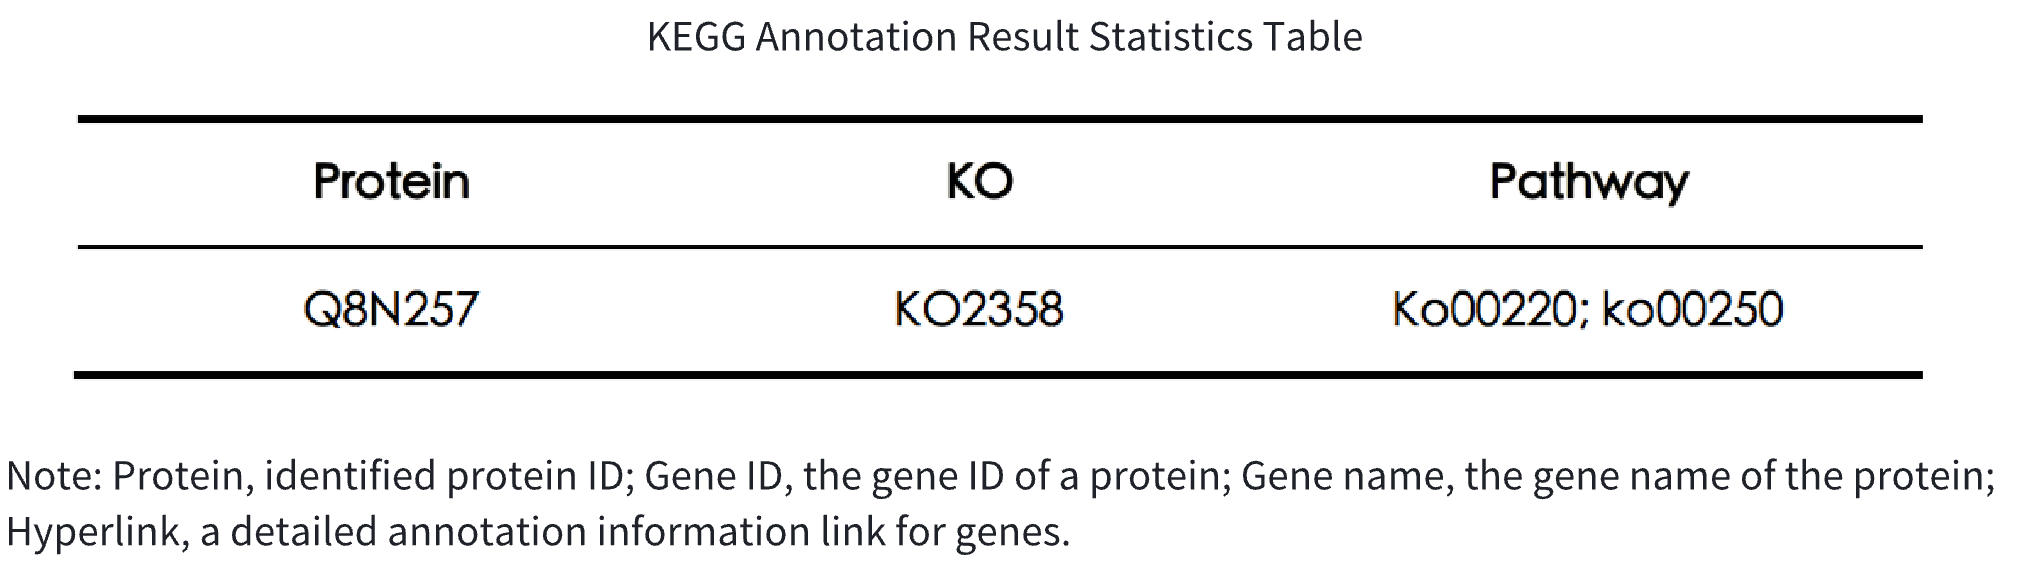
Table 2. KEGG Annotation Result Statistics Table
3. KEGG Pathway Annotation
In organism, different gene products coordinate to exercise biological functions. Pathway annotation analysis of differentially expressed genes helps to further understand the functions of genes. Pathway annotation diagram for differentially expressed proteins is as follows:
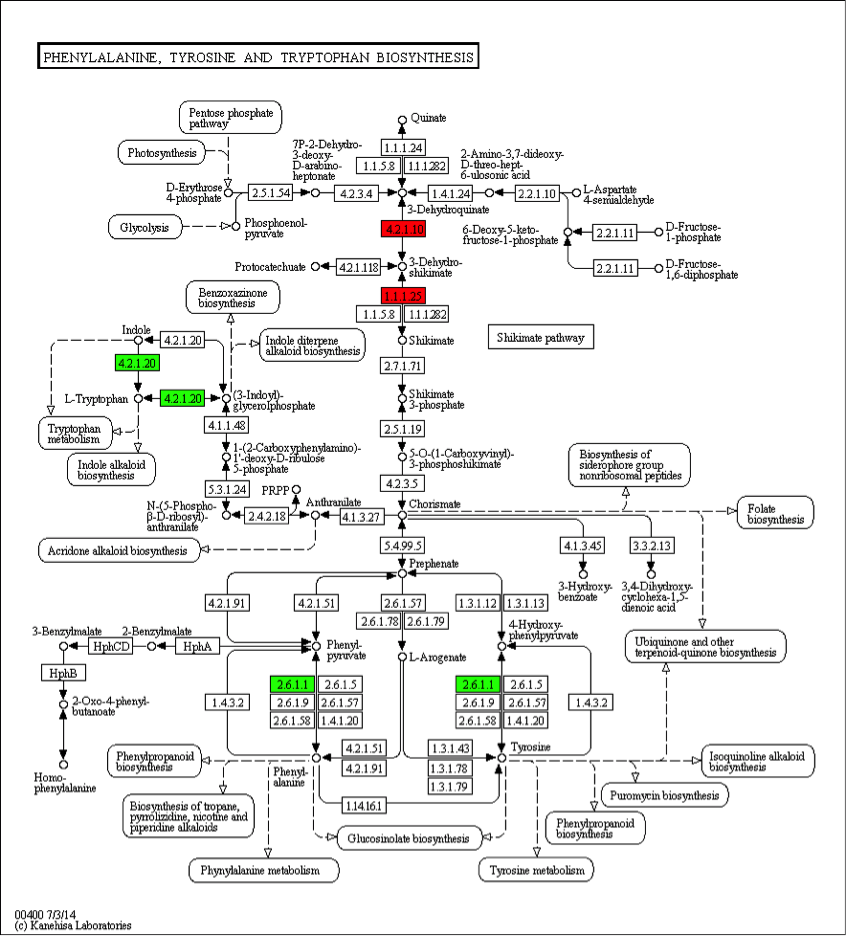 Figure 1. Pathway Diagram of KEGG Annotation Results
Note: Compared to the control group, enzymes marked in red are related to upregulated proteins; enzymes marked in green are related to downregulated proteins; enzymes marked in blue are related to both upregulated and downregulated proteins. The numbers inside the boxes represent the number of enzyme (EC number), and the entire pathway consists of complex biochemical reactions catalyzed by various enzymes. This pathway diagram marks enzymes related to differentially expressed genes in different colors, which focuses on the study of the differential expression of certain metabolic pathway-related proteins according to the difference among subjects and explains the root causes of phenotypic differences through the pathway.
4. KEGG Pathway Classification
The annotation results of differentially expressed genes in KEGG are classified according to the pathway types in KEGG, results are shown in the following figure:
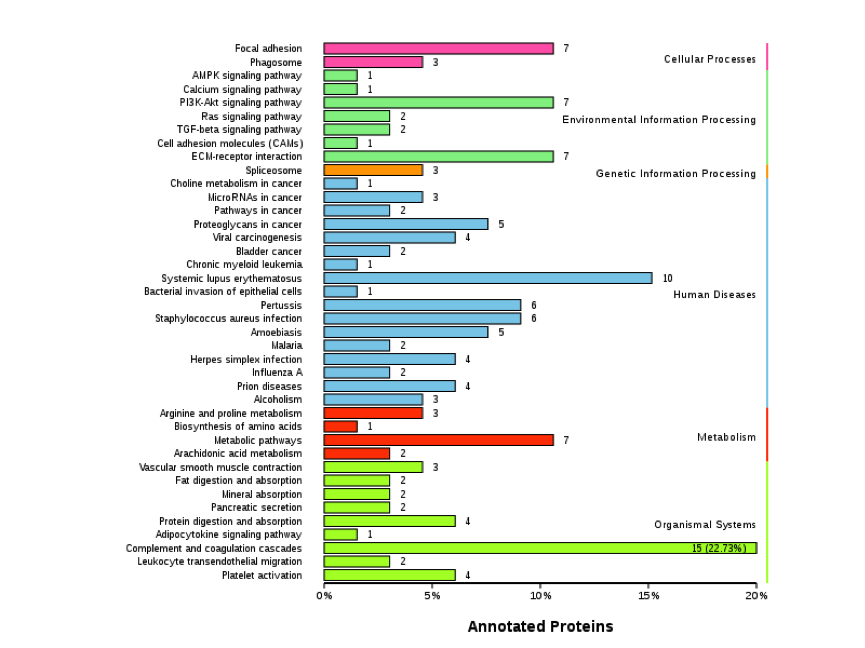 Figure 2. KEGG Classification Diagram of Differentially Expressed Proteins
Note: The vertical axis is the name of the KEGG metabolic pathway, and the horizontal axis represents the number of proteins annotated to that pathway and their proportion of the total annotated proteins.
5. KEGG Pathway Enrichment
Analysis of whether differentially expressed proteins are over-represented in a certain pathway is termed pathway enrichment analysis for differentially expressed proteins. We use Kobas software to perform KEGG pathway enrichment analysis for differentially expressed proteins. The results of the KEGG pathway enrichment analysis for differentially expressed proteins are shown in the following figure:
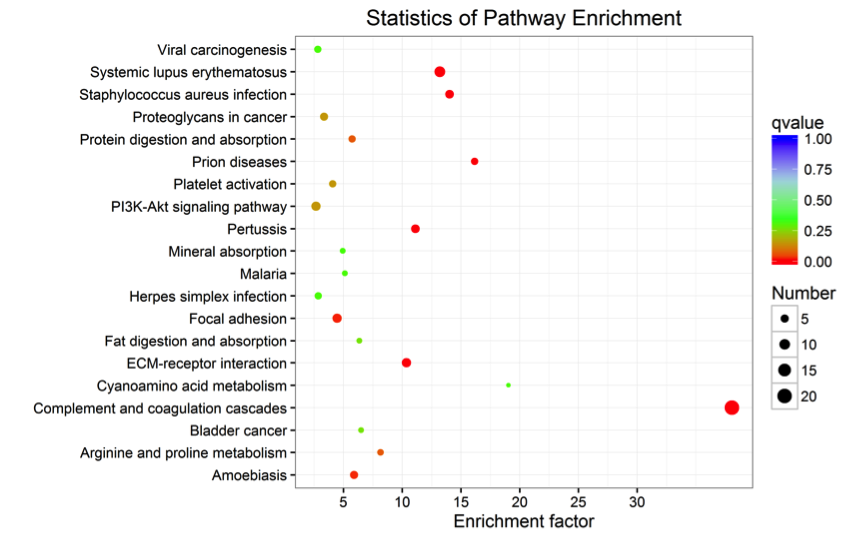 Figure 3. KEGG Pathway Enrichment Statistics Diagram of Differentially Expressed Proteins
Note: Each point in the diagram represents a KEGG pathway, with the pathway name on the left axis. The horizontal axis represents the enrichment factor, a ratio that the proportion of differentially expressed proteins annotated to the pathway to the proportion of proteins in that species annotated to a pathway. The higher the enrichment factor, the more reliable the significance of enrichment of differentially expressed proteins in that pathway.
MtoZ Biolabs, an integrated chromatography and mass spectrometry (MS) services provider.
Related Services
GO Functional Annotation and Enrichment Analysis Service
How to order?

