


Differential Protein Analysis Service
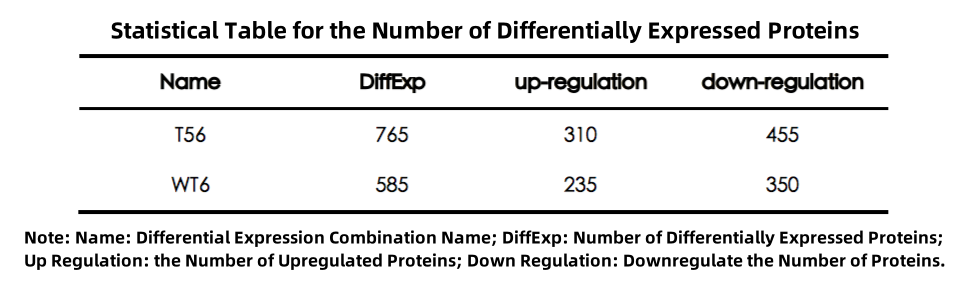
Differential protein analysis can significantly enhance the discovery of new biomarkers, improving the accuracy of biomarker identification and providing valuable insights for clinical disease analysis. MtoZ Biolabs offers precise differential protein analysis based on statistical data, identifying significant differences in protein levels under various physiological conditions and tissues. In the statistical analysis of differentially expressed proteins, FC ≥ 1.3 (or ≤ 1/1.3) is used as the threshold. Proteins with FC ≥1.3 are considered up-regulated, while those with FC ≤ 1/1.3 are considered down-regulated. The number of differentially expressed proteins is summarized in the table below:
Table 1. Statistical analysis of differentially expressed proteins
Venn Diagram
The Venn diagram illustrates the shared and unique differentially expressed proteins between two groups:
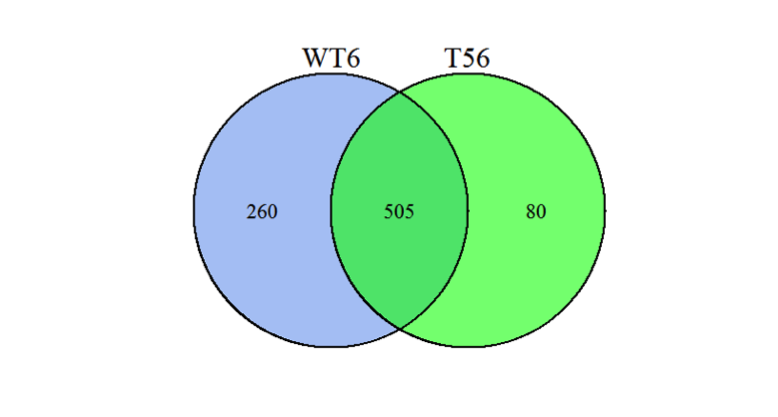 Figure 1. Venn Diagram of Differentially Expressed Proteins
Volcano Plot
The volcano plot provides a rapid visualization of the differences in protein expression levels between two sample groups and the statistical significance of these differences.
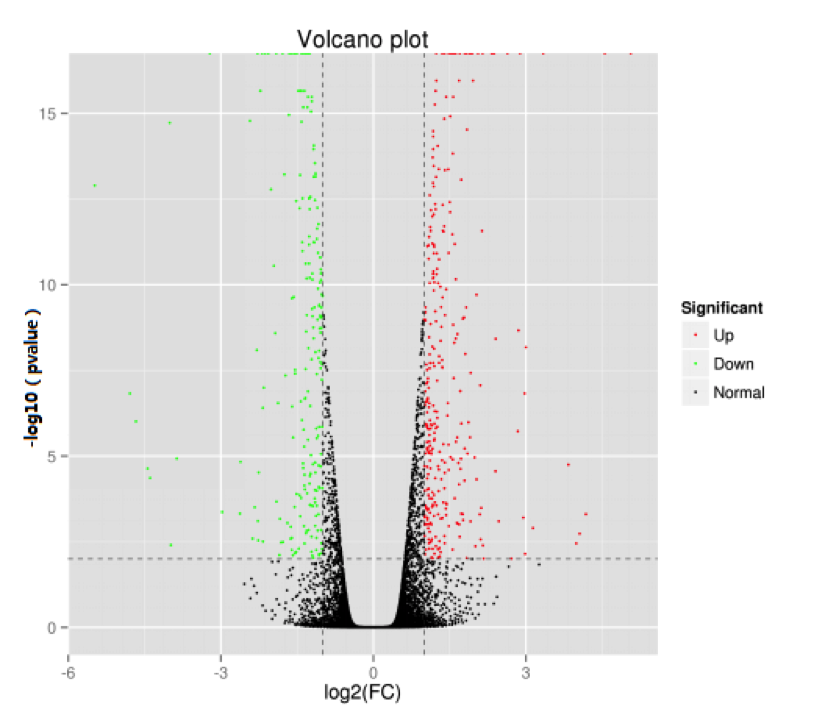
Figure 2. Volcano Plot of Differentially Expressed Proteins
Note: Each point in the volcano plot represents a protein. The x-axis shows the log fold change in expression levels between the two samples, while the y-axis indicates the t-test p-value. A larger absolute value on the x-axis signifies a greater fold change in expression levels between the samples; a higher value on the y-axis denotes more significant differential expression, enhancing the reliability of identified differentially expressed genes. Green dots represent down-regulated proteins, red dots represent up-regulated proteins, and black dots indicate non-differentially expressed proteins.
MtoZ Biolabs, an integrated chromatography and mass spectrometry (MS) services provider.
Related Services
Differential Proteins Clustering Analysis Service
How to order?

