


Proteomics Data Quality Assessment Service
Proteomics mass spectrometry data is fundamental to proteomics analysis. The quality of the mass spectra is closely related to the accuracy of the retrieval and analysis results. Therefore, the quality assessment of proteomics data is particularly important. To ensure the reliability of bioinformatics analysis, MtoZ Biolabs evaluates proteomic data identified from the following four aspects:
1. Peptide Match Error Distribution
2. Peptide Count Distribution
3. Peptide Length Distribution
4. Protein Molecular Weight Distribution
1. Analysis of Peptide Match Error Distribution
The error distribution between the molecular weight of all matched peptides and their theoretical molecular weight is shown in the following diagram:
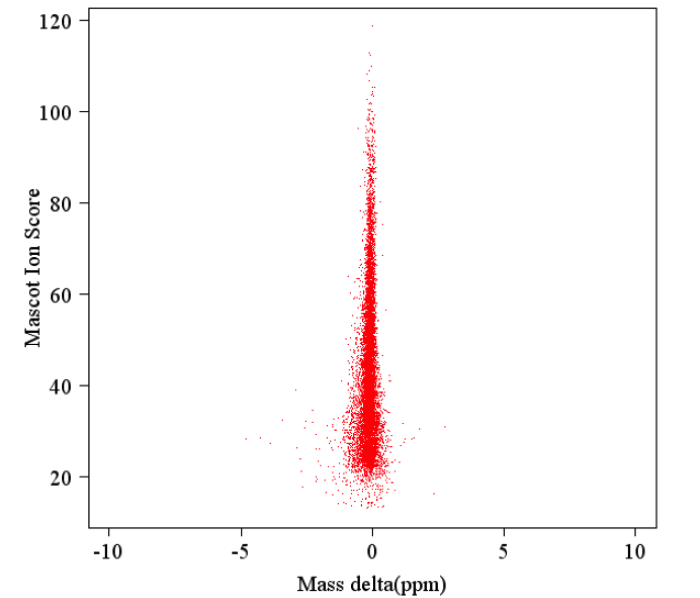 Figure 1. Peptide Match Error Distribution Chart
2. Analysis of Peptide Count Distribution
The distribution of peptide counts in the identified proteins is shown in the following diagram:
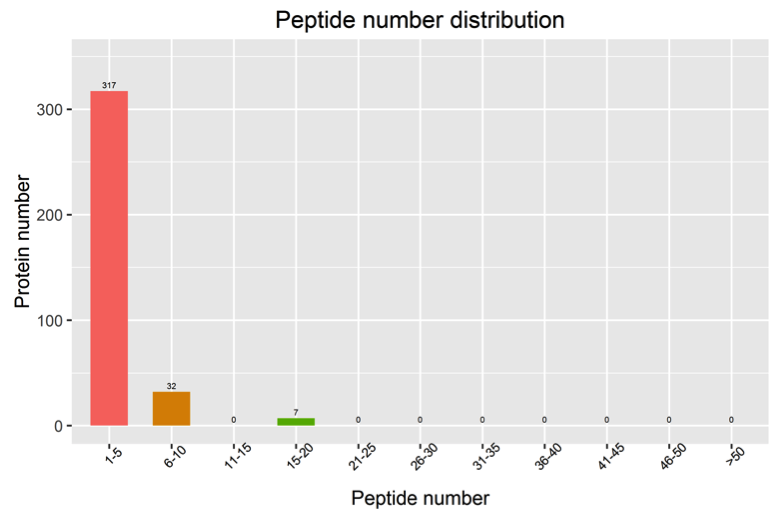 Figure 2. Peptide Count Distribution Chart
Note: The horizontal axis represents the count of peptides, and the vertical axis represents the number of proteins.
3. Analysis of Peptide Length Distribution
The distribution chart of the lengths of the identified peptides is as follows:
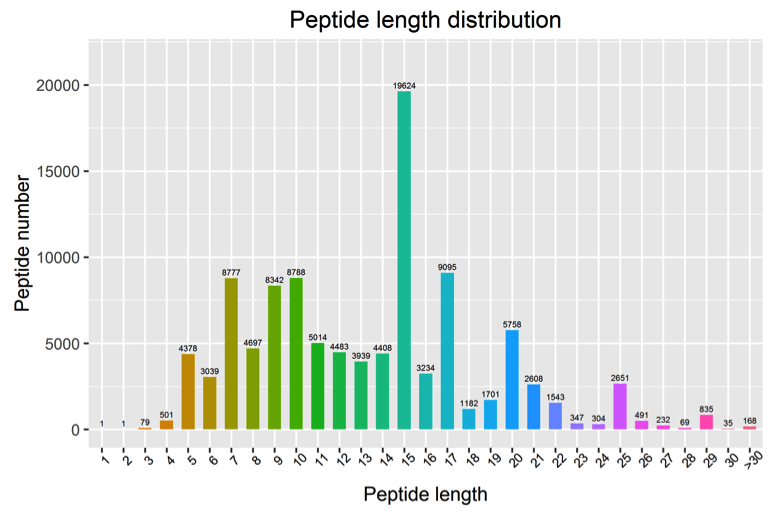 Figure 3. Peptide Length Distribution Chart
Note: The horizontal axis represents the length of peptides, and the vertical axis represents the number of peptides.
4. Analysis of Protein Molecular Weight Distribution
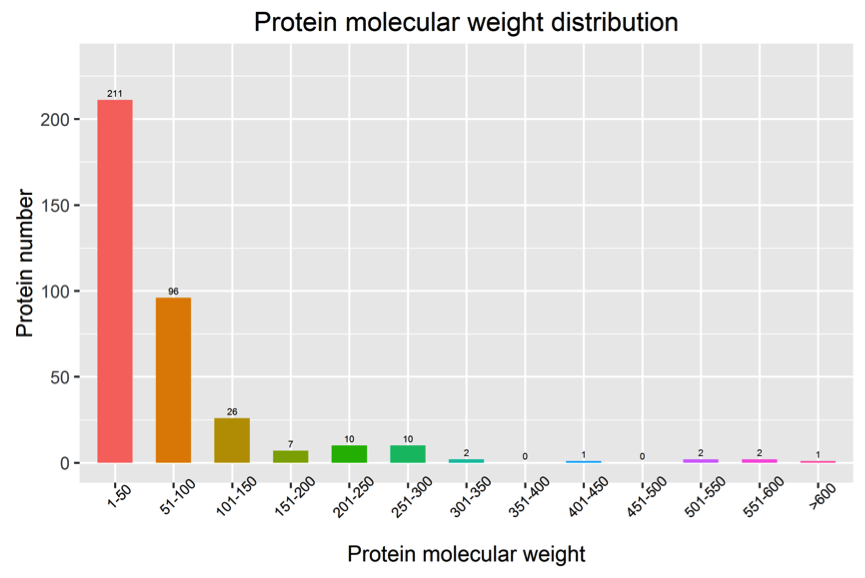 Figure 4. Protein Molecular Weight Distribution Chart
Note: The horizontal axis represents the molecular weight of proteins, and the vertical axis represents the number of proteins.
MtoZ Biolabs, an integrated chromatography and mass spectrometry (MS) services provider.
Related Services
How to order?

