






How to Read Biofluid Proteomics Results: Differential Proteins, Visualizations, and Pathways
Serum, plasma, and cerebrospinal fluid (CSF) proteomics can generate several layers of statistical and bioinformatics results. Differential protein analysis describes protein-level changes, while multivariate analysis, clustering, pathway analysis, and interaction networks provide broader views of the dataset.
Result interpretation should start with the research question. The main task is to determine which protein changes are supported by the data, whether broader patterns are consistent with the comparison, and which functional findings deserve further attention.
Define the Interpretation Goal
Proteomics results are easier to interpret when the expected outcome is defined before individual tables or bioinformatics outputs are reviewed. The analysis may focus on several questions:
- Do the samples show consistent group-level patterns?
- Which biological functions or pathways are associated with the observed protein changes?
- Which proteins or functional themes warrant further investigation?
The comparison used for each analysis should also be confirmed at the outset, including the reference group and the direction of change. Clear interpretation goals provide the basis for evaluating protein-level differences, broader data patterns, and functional results in the following analyses.
Evaluate Differential Protein Results
Differential protein results should be evaluated using several types of evidence together. Fold change describes the size of a difference, statistical analysis indicates the strength of support for that difference, and replicate-level values show whether the pattern is consistent across samples.
Direction and Magnitude of Change
Fold change indicates whether protein abundance increases or decreases and by how much. The magnitude helps identify proteins with more pronounced differences, but a larger fold change does not by itself make a protein more biologically relevant.
Statistical Evidence
Statistical results help assess whether an observed difference is supported across the samples included in the comparison. P-values or adjusted p-values, when reported, should be considered alongside fold change rather than used as a standalone ranking criterion.
No single fold-change or significance threshold is appropriate for every serum, plasma, or CSF proteomics study. Cutoffs should follow the statistical plan used for the specific project.
Consistency Across Replicates
Individual sample values provide important context for group-level results. A similar direction of change across biological replicates generally provides stronger support than a difference driven by only a few samples.
Reviewing replicate-level patterns can also reveal heterogeneous responses that may be masked by group averages. Differential proteins with consistent quantitative and statistical evidence are usually stronger candidates for further interpretation.
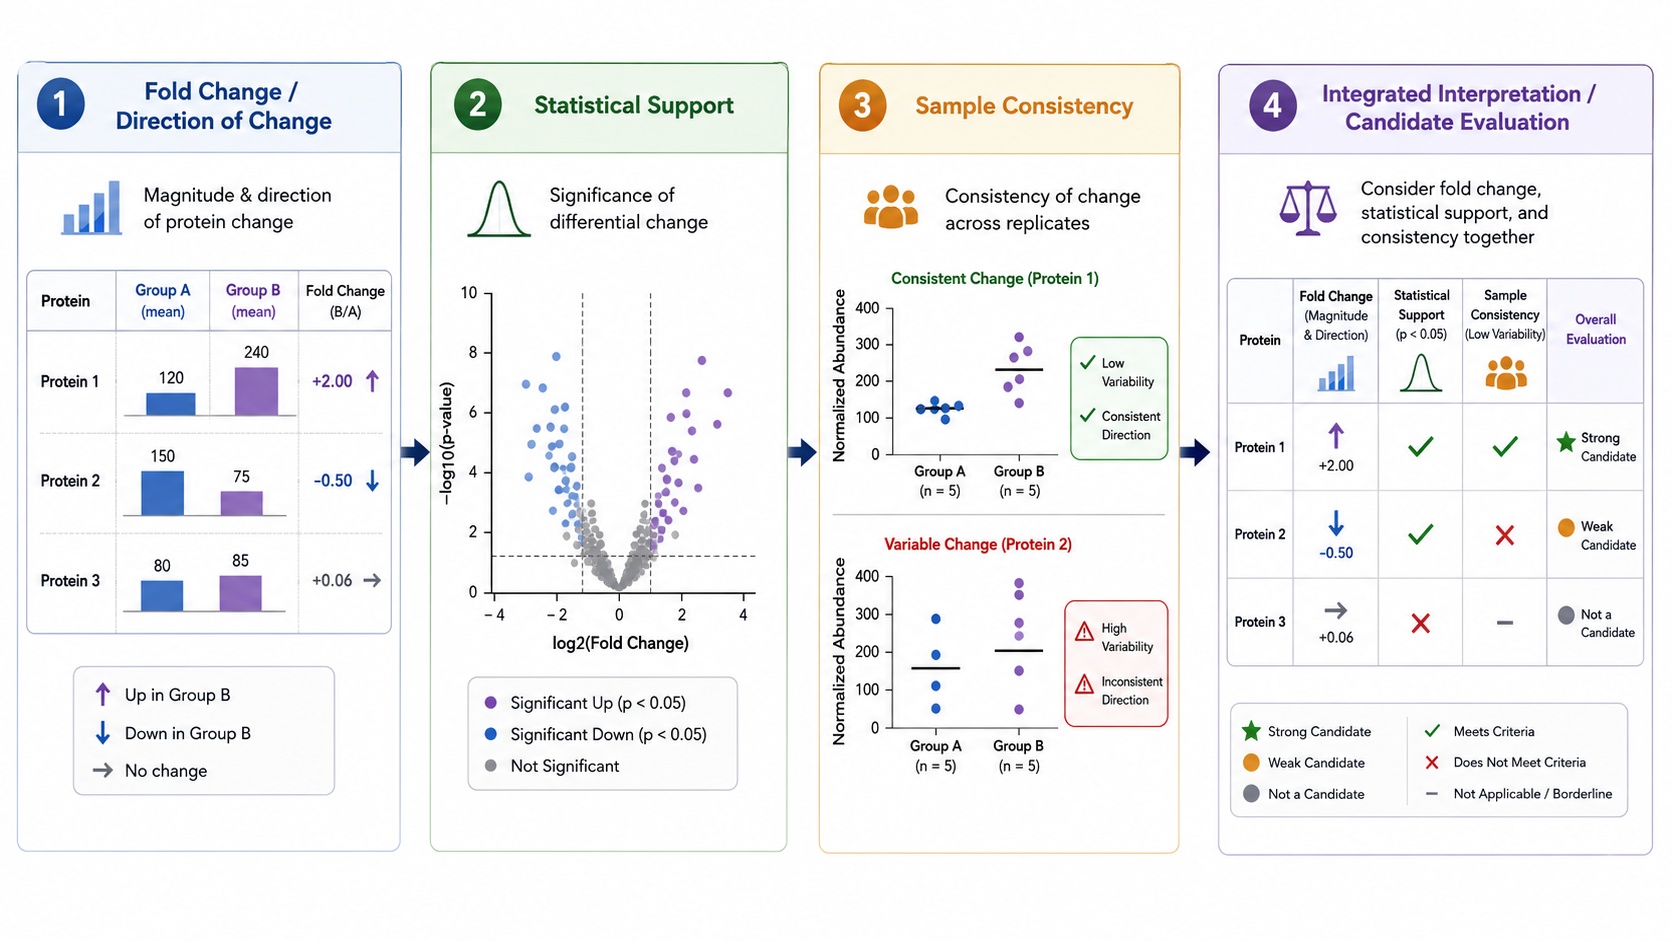
Figure 1. Interpreting Differential Protein Results.
Interpret Statistical and Expression Patterns
Statistical and expression-pattern analyses provide a broader view of the dataset beyond individual differential proteins. PCA, hierarchical clustering, heatmaps, and volcano plots each highlight a different aspect of sample relationships or protein-level variation.
Principal Component Analysis (PCA)
PCA reduces complex quantitative data into a small number of principal components that capture major sources of variation among samples.
PCA is mainly used to assess:
- whether biological replicates cluster together;
- whether predefined groups separate or overlap;
- whether any samples appear unusually distant from the rest of the cohort.
Group separation indicates differences in overall proteomic profiles along the displayed components. PCA does not identify which proteins drive the separation and does not establish a biological mechanism.
Hierarchical Clustering and Heatmaps
Hierarchical clustering groups samples or proteins according to similarities in their abundance patterns. Heatmaps display those patterns across many proteins and samples at the same time.
Useful features include sample clustering, coordinated protein changes, and differences between experimental groups. Heatmap colors should always be interpreted according to the scaling or normalization applied to the data, because the colors may represent standardized or relative values rather than absolute abundance.
Volcano Plot
A volcano plot summarizes differential analysis by displaying the magnitude of protein change together with statistical evidence.
The plot is useful for showing the overall distribution of differential proteins and for locating proteins with both larger abundance changes and stronger statistical support. Individual proteins should still be interpreted using the corresponding differential protein table and quantitative measurements.
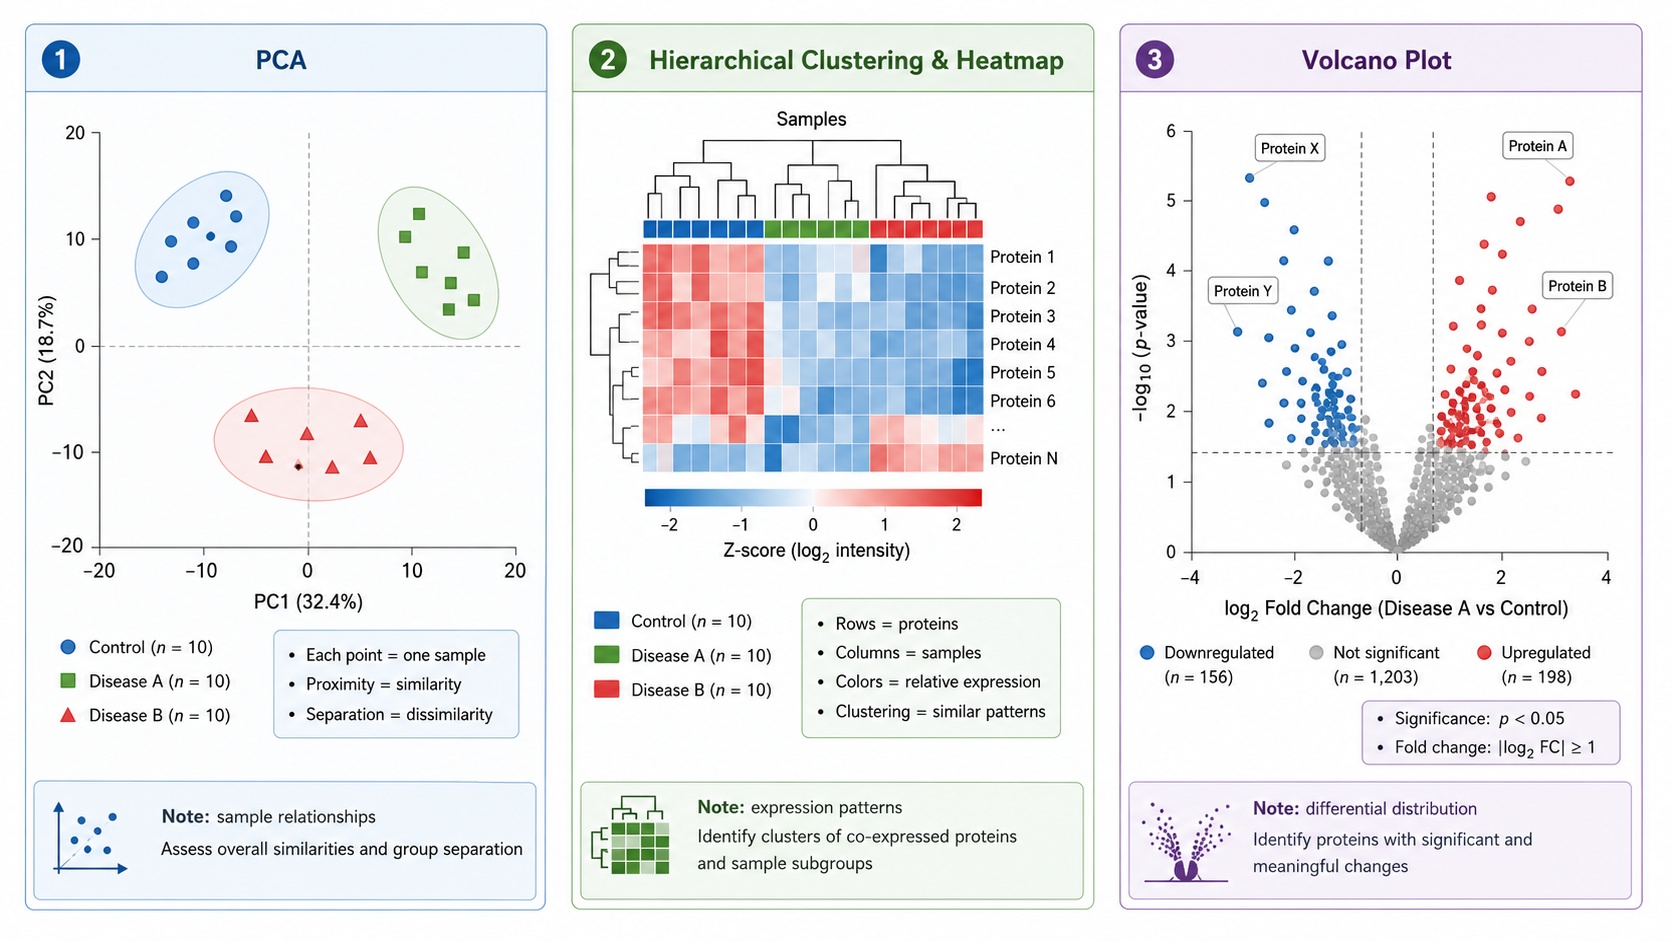
Figure 2. Statistical and Expression Pattern Analysis in Biofluid Proteomics.
Interpret Functional, Pathway, and Network Analysis
Functional annotation, pathway enrichment, and interaction-network analysis extend differential protein results beyond individual proteins. The three analysis types address different questions: functional annotation describes what the proteins are associated with, pathway analysis examines where the proteins occur in established biological pathways, and PPI analysis evaluates known or predicted relationships among proteins.
Functional Annotation and Classification
Gene Ontology (GO) is primarily a functional annotation system rather than a pathway database. GO analysis classifies proteins into three categories:
- Biological Process
- Molecular Function
- Cellular Component
GO enrichment can further identify functional terms that are overrepresented among the proteins of interest. COG analysis provides another level of functional classification by grouping proteins into broader functional categories.
GO or COG results describe known functional associations within the protein set. The presence or enrichment of a functional category does not by itself indicate that the corresponding biological process is activated or suppressed.
Pathway Analysis
KEGG and Reactome place proteins within established biological pathways and provide pathway-level context for differential protein changes.
Pathway results can be interpreted by examining the mapped proteins, their quantitative changes, and whether related pathways support a consistent biological theme. Enrichment indicates that pathway-associated proteins are overrepresented in the analyzed protein set; enrichment alone does not establish pathway activation or inhibition.
Reactome analysis has species limitations and is available only for organisms supported by the database and the project workflow. Species compatibility should therefore be confirmed before Reactome analysis is included in a biofluid proteomics project.
Protein-Protein Interaction Analysis
Protein-protein interaction (PPI) analysis organizes proteins according to known or predicted interaction relationships. Network results can show connected protein groups, functional modules, and proteins with multiple network associations.
PPI analysis provides additional context for understanding how differential proteins may relate within a biological network. A network edge does not confirm that a direct physical interaction occurred in the analyzed serum, plasma, or CSF samples.
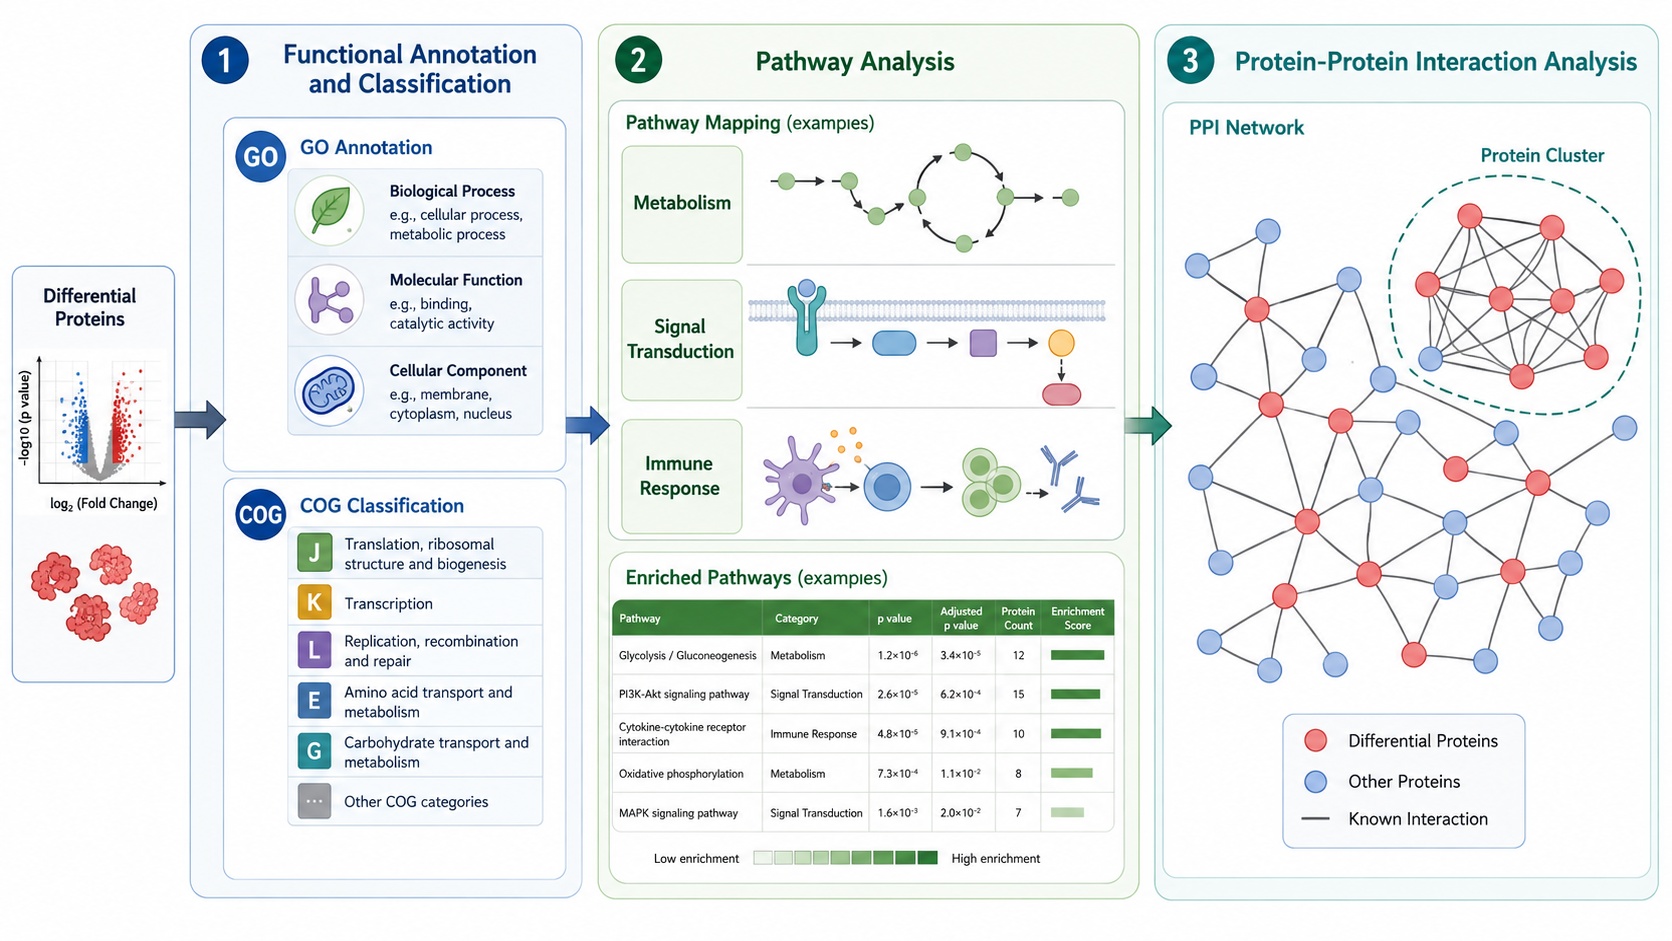
Figure 3. Functional and Network Interpretation of Differential Proteins.
Prioritize Findings for Follow-Up
Prioritization should narrow a broad proteomics result set to findings that are most relevant to the original research question and sufficiently supported for further study. Strong candidates usually have support from more than one level of analysis.
Useful priorities include:
- proteins with coherent quantitative and statistical evidence that directly relate to the research question;
- functional themes supported by several related differential proteins rather than a single isolated result;
- pathway or network findings that connect multiple protein changes into a plausible biological hypothesis;
- candidates that can be reasonably carried forward in subsequent research.
The aim is to produce a focused set of proteins, pathways, or biological themes for follow-up rather than rank every significant result. A prioritized protein remains a research candidate; proteomics evidence alone does not establish a validated biomarker or a causal biological role.
Avoid Common Interpretation Errors
Proteomics results should be interpreted according to the type of evidence each analysis provides. Statistical significance, multivariate patterns, pathway enrichment, and network relationships do not support the same conclusions.
|
Result |
Does Not Mean |
Supported Interpretation |
|
Large fold change |
Highest biological importance |
Large abundance difference |
|
Significant p-value |
Confirmed biological relevance |
Statistical evidence for a group difference |
|
PCA separation |
Mechanism is established |
Samples differ in overall proteomic patterns |
|
Pathway enrichment |
Pathway activation or inhibition |
Pathway-associated proteins are overrepresented |
|
PPI connection |
Direct interaction in the sample |
Known or predicted protein relationship |
|
Prioritized protein |
Validated biomarker |
Candidate for further investigation |
Protein non-detection also should not be treated as proof of biological absence. Interpretation of missing proteins requires separate assessment of data quality and analytical coverage.
Frequently Asked Questions
Q1: Can a differential protein still be important if it is not included in an enriched pathway?
A1: Yes. Pathway enrichment evaluates groups of proteins rather than the importance of every individual protein. A differential protein can still be relevant when the quantitative result is well supported and directly related to the research question.
Q2: Why do GO and KEGG results not always show the same biological themes?
A2: GO and KEGG organize biological information differently. GO describes functional terms such as biological processes, molecular functions, and cellular components, whereas KEGG maps proteins to defined pathways. Differences between the two analyses are therefore expected.
Q3: Why are some differential proteins missing from pathway or PPI results?
A3: Not every protein has the same level of pathway or interaction annotation. A differential protein may have limited database annotation or may not map to the pathway or interaction resources used in the analysis. Absence from a pathway or PPI result does not mean that the protein is unimportant.
Q4: What should be done when no pathway reaches the selected enrichment threshold?
A4: The differential protein results can still be interpreted at the protein and functional-annotation levels. Lack of significant pathway enrichment means that the analyzed protein set did not meet the selected criteria for pathway enrichment; it does not mean that no biological differences exist between the groups.
Q5: Should GO, pathway, and PPI results point to the same conclusion?
A5: Not necessarily. Functional annotation, pathway analysis, and PPI analysis describe different aspects of the protein set. Agreement across several analyses can strengthen a biological interpretation, but differences between the outputs are common and should be evaluated in relation to the proteins contributing to each result.
Conclusion
Biofluid proteomics results are most useful when protein-level changes, sample-level patterns, and biological context lead to a focused set of findings for further study. Clear interpretation also helps separate supported conclusions from results that still require additional evidence.
MtoZ Biolabs supports serum, plasma, and CSF proteomics projects with differential protein analysis, functional annotation, pathway analysis, PPI analysis, and result interpretation. Contact MtoZ Biolabs to discuss your dataset and the next steps for candidate or pathway follow-up. For a broader overview of sample planning, LC-MS/MS strategies, and result interpretation, see Serum, Plasma, and CSF Proteomics: From Biofluid Samples to Biological Insights.
How to order?




