






How to Interpret Differential Proteins in a Plant Proteomics Study
Differential proteins in a plant proteomics study are proteins showing statistically supported abundance differences between defined groups after LC-MS/MS quantification and comparison. They are candidate proteins linked to the contrast you designed—such as stress versus control, tolerant versus sensitive, or treatment A versus treatment B—not confirmed markers, causal regulators, or field-validated trait genes.
The most reliable interpretation starts with replicate behavior and phenotype context, then uses annotation and pathway views to organize candidates. Ranking by p-value or fold change alone often overstates weak or uneven changes.
If you are reviewing differential proteins from a plant proteomics project, check the comparison design, tissue context, harvest timing, and replicate consistency before converting the results into biological claims.
What the Differential Protein Output Contains
A standard quantitative plant proteomics comparison typically delivers:
-
Protein identification with accession or database mapping
-
Group-wise quantitative values or ratios
-
Statistical comparison results between predefined groups
-
Optional functional annotation and pathway organization
Standard bioinformatics reporting may include GO and KEGG views, protein interaction context, and Reactome analysis when the species is supported.
The output answers which proteins changed abundance under the submitted contrast. It does not by itself answer:
-
Which protein causes the phenotype
-
Whether the change will repeat across environments or independent experiments
-
Whether modification state changed when only abundance was measured
-
Whether a pathway is activated rather than merely enriched in changed proteins
Read differential proteins as prioritized candidates for the sampled tissue, time point, and contrast—not as final conclusions.
Evidence Types: What Each Signal Supports
Interpretation improves when evidence types are separated rather than collapsed into one rank score.
| Evidence type | What it supports | What it does not support | Review priority |
| Replicate consistency | Same direction across independent biological samples | Causal role or marker status | High |
| Phenotype linkage at harvest | Alignment with stress score, trait score, or treatment label | Mechanism proof without follow-up | High |
| Magnitude of fold change | Size of abundance shift in the contrast | Importance if replicates disagree | Medium |
| Statistical significance | Confidence that groups differ under the model used | Biological relevance in uneven samples | Medium |
| Detection frequency | Protein quantified in most replicates | Functional importance by itself | Medium |
| GO or KEGG annotation fit | Pathway or process context for interpretation | Proof that the pathway drives the trait | Supporting only |
| Reactome or PPI context | Network-level organization when species supported | Direct interaction proof in planta | Supporting only |
No single column in the output replaces sample-level review. A large fold change with poor replicate behavior is weaker than a moderate change that shows a consistent pattern across biological replicates.
Step 1: Anchor Interpretation to the Comparison Sentence
Every differential protein should be read against the contrast defined for the study.
Examples include drought-treated versus control leaf at 72 h, salt-tolerant versus salt-sensitive root at matched injury score, or high-quality seed line versus baseline line at maturity. If the comparison sentence is vague, the protein list becomes difficult to defend even when statistics look strong.
When interpreting the results, confirm that the intended contrast is based on comparable tissue, developmental stage, treatment conditions, sampling time, and independent biological replicates.
The purpose is not to redesign the experiment after analysis, but to determine whether the differential protein list reflects the biological comparison the study was intended to test.
Step 2: Review Replicate Behavior Before Shortlisting
Open replicate-level values before ranking the output by significance alone.
Prioritize proteins that show:
-
Consistent up- or downregulation across most biological replicates
-
Quantification in most samples rather than one or two runs only
-
Direction that matches the group labels without outlier-driven flips
Down-rank or hold proteins that are:
-
Driven by one outlier plant while other replicates are flat
-
Significant only after one replicate fails quality expectations
-
Changed in direction opposite to the phenotype notes collected at harvest
Replicate review is especially important in plant stress studies where sensitive lines reach injury earlier than tolerant lines at the same calendar time.
Step 3: Cross-Check Phenotype and Metadata Records
Differential proteins gain meaning when they align with records collected at harvest.
Use metadata such as wilting score, lesion index, relative water content, growth reduction, treatment label, genotype name, tissue position, and hours after stress or inoculation. Proteins showing consistent abundance patterns alongside measured phenotypes may represent stronger candidates for follow-up than proteins significant only in aggregate statistics.
When phenotype and protein direction conflict, review harvest timing and sample identity before forcing a stress or tolerance story. A protein elevated in collapsed tissue may reflect damage rather than adaptive biology.
Sample condition and metadata should also be considered when interpreting unexpected replicate behavior or unusually variable quantitative results.
Step 4: Use Pathway Views to Organize, Not to Prove
After shortlisting proteins at the sample level, use pathway organization to group candidates.
GO views help describe process and function themes. KEGG maps help place enzymes and transporters into metabolism or signaling context. PPI networks and Reactome views, when supported for the species, help review related proteins together.
Pathway enrichment or clustered themes support hypothesis formation. They do not prove that:
-
Any one enriched term controls the trait
-
The entire pathway is activated
-
A candidate is a breeding marker
-
A stress tolerance mechanism is solved
Keep wording at candidate protein and pathway theme level unless orthogonal validation exists.
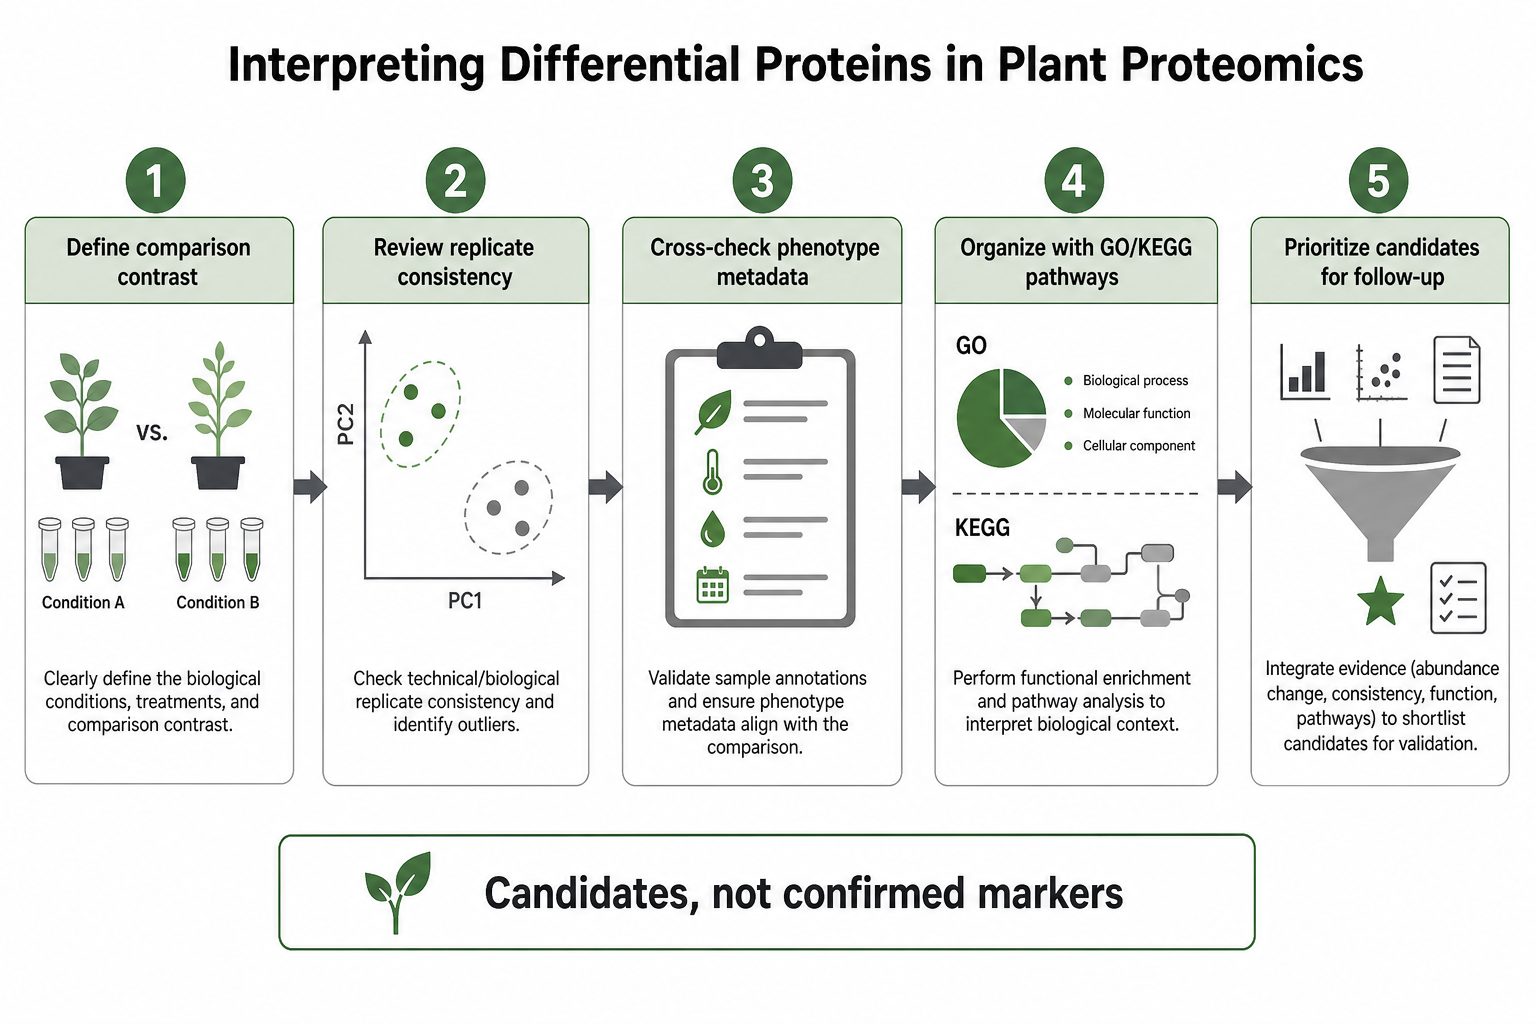
Figure 1. Anchor interpretation to the comparison, review replicate and phenotype consistency, then use pathway context to organize candidate proteins.
Comparing Interpretation Strategies: Stats-First vs Biology-First
Teams may interpret the same output differently. The table below compares common approaches and their risks.
| Approach | How it works | Best when | Main risk |
| Stats-first ranking | Sort by p-value or adjusted p-value, then scan top hits | Large clean datasets with even replicate behavior | Highlights outlier-driven changes with weak biology |
| Biology-first ranking | Filter by replicate consistency and phenotype fit, then review statistics | Stress, breeding, and genotype contrasts with scored phenotypes | May miss subtle but real changes if filters are too strict |
| Pathway-first review | Cluster by GO/KEGG/Reactome before protein prioritization | Exploratory theme discovery in complex contrasts | Pathway labels outrun sample-level support |
| Hybrid review | Shortlist by replicate and phenotype, then rank within that set | Plant trait and stress studies with informative phenotype data | Requires more manual review time |
A hybrid review is often useful in plant proteomics because it combines statistical evidence with replicate behavior and biological context rather than relying on a single ranking criterion.
What Claims Different Project Types Can Support
Match wording to the contrast type rather than using generic marker language.
| Project contrast | Supported wording example | Wording to avoid without follow-up |
| Stress versus control | Stress-responsive candidate proteins in the sampled tissue | Confirmed tolerance gene or field marker |
| Tolerant versus sensitive | Genotype-linked candidate differences under matched stress | Causal resistance mechanism |
| Trait line comparison | Candidate proteins associated with trait contrast at harvest stage | Gene-trait causation or breeding release claim |
| Treatment response | Treatment-associated abundance shifts in defined organ | Mechanism proven by proteomics alone |
| Time course | Time-window-specific candidate remodeling | Mixing time points into one marker set |
The appropriate analytical strategy depends on the study design, comparison structure, and level of quantitative evidence required. These choices affect how confidently differential proteins can be compared and interpreted, but they do not change the evidence limits described above.
Follow-Up That Changes Interpretation Confidence
Differential interpretation does not stop at the report output.
Orthogonal follow-up may include targeted measurement of priority proteins, phosphoproteomics when signaling modification is suspected, metabolomics when chemical products matter, RNA-seq comparison when transcriptional context is missing, or expanded genotype panels when one contrast was only a pilot.
Each follow-up answers a narrower question. None retroactively upgrades every differential protein to a validated marker.
When follow-up is planned, carry forward the same comparison logic: matched tissue, matched timing, and explicit claim wording.
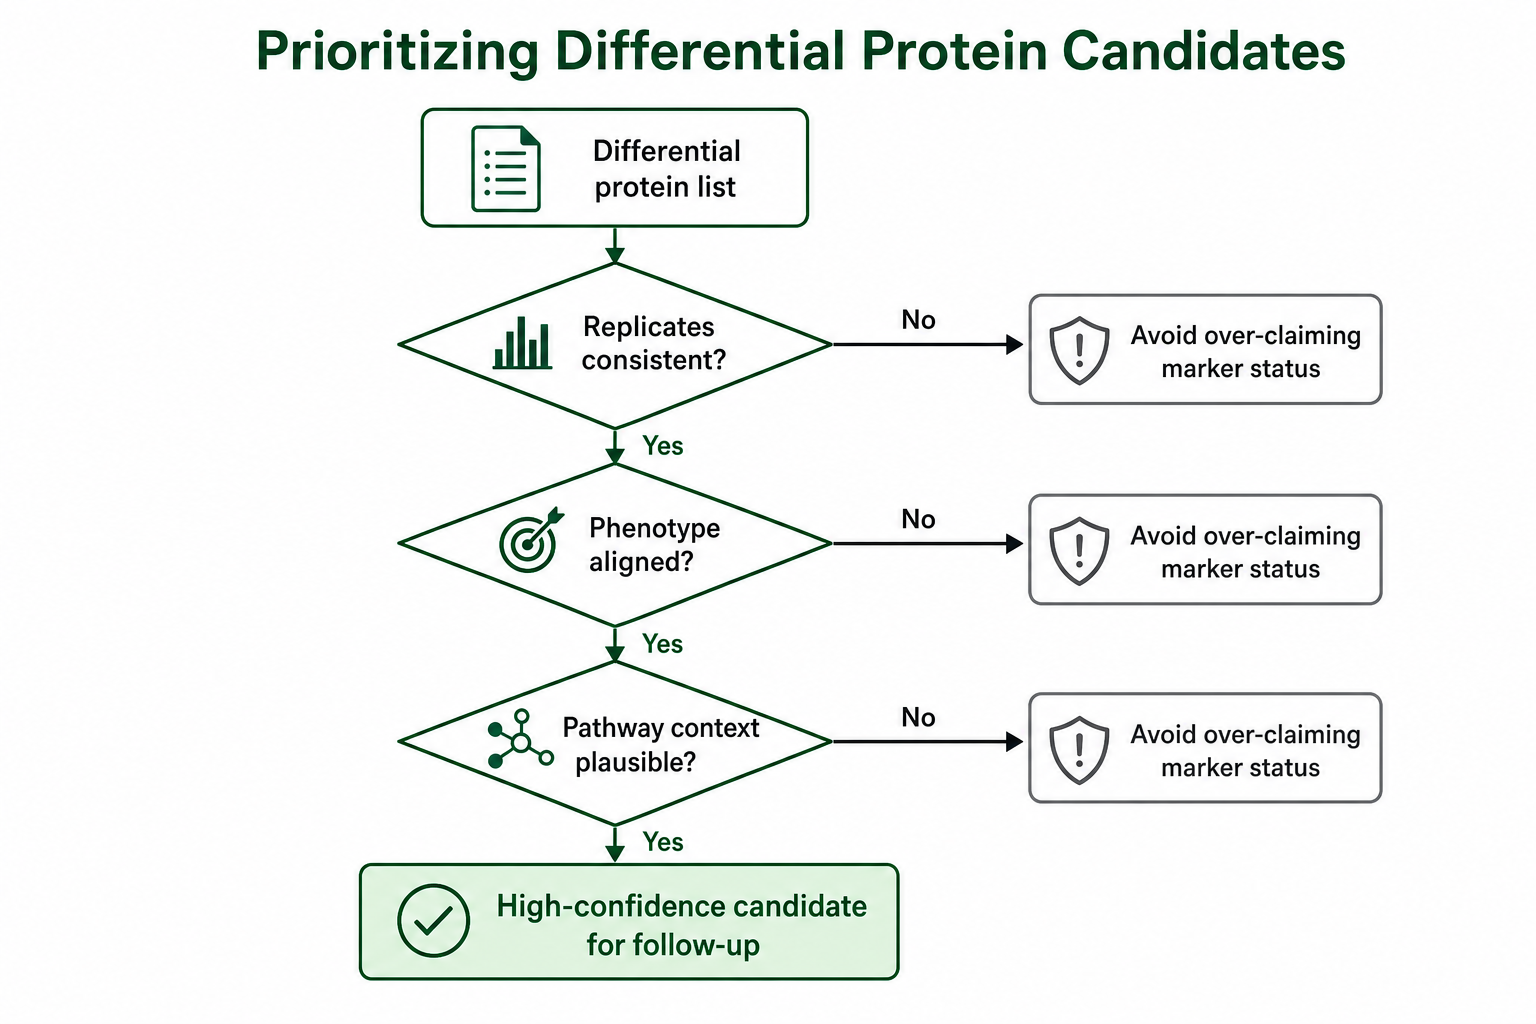
Figure 2. Replicate consistency and phenotype context help shortlist candidates before pathway themes guide next-step follow-up.
Common Misinterpretation Mistakes
-
Treating every significant protein as a marker or causal gene
-
Ignoring replicate-level values and relying on ranked tables alone
-
Using pathway enrichment as proof of mechanism
-
Mixing organs, time points, or injury stages in one contrast label
-
Overreading tolerant-versus-sensitive lists without phenotype notes at harvest
-
Expecting protein changes to match prior RNA-seq one-to-one without matched design
A Practical Interpretation Checklist
-
Restate the comparison sentence and sampled organ.
-
Review replicate values for top candidates.
-
Cross-check harvest phenotype or treatment metadata.
-
Separate high-confidence candidates from exploratory hits.
-
Use GO, KEGG, PPI, and Reactome views to organize themes when supported.
-
Match claim wording to contrast type and evidence level.
-
Plan targeted follow-up for a short prioritized list rather than every significant row.
When interpretation questions remain, review the comparison design, tissue type, phenotype records, and the biological question the differential protein list is expected to address.
Related Services
Proteomics Bioinformatic Analysis Service
Plant Phosphoproteomics Analysis Service
Frequently Asked Questions
1. Are all differential proteins important?
No. Priority should go to proteins with consistent replicate behavior and plausible links to the contrast and phenotype.
2. Is the smallest p-value always the best candidate?
Not necessarily. Statistical significance does not correct for outlier plants, wrong tissue, or mixed harvest stages.
3. Does pathway enrichment prove a mechanism?
No. It organizes candidates into themes. Mechanism claims still need sample-level support and follow-up.
4. Can differential proteins be called markers in breeding?
They are candidate markers until replicate, phenotype, and validation data support stronger use.
5. Should differential proteins match RNA-seq results?
They may overlap when design is matched, but discordance is common because transcripts and proteins report different biological layers.
6. What information helps interpret a differential protein list?
Share comparison design, tissue type, harvest timing, phenotype scores, replicate structure, and the biological question the analysis is intended to address.
Conclusion
Interpreting differential proteins in a plant proteomics study requires linking each candidate to the defined contrast, replicate behavior, and harvest context before pathway themes are used to organize follow-up. The differential output prioritizes plant proteins for review; it does not by itself establish causality, marker status, or field performance.
For project-specific plant proteomics data interpretation and follow-up planning, MtoZ Biolabs can evaluate the comparison design, quantitative results, and biological questions to help define an appropriate analysis strategy.
How to order?




