






How Mitochondrial Proteomics Reveals Mitochondrial Dysfunction in Neurodegenerative Disease
Mitochondrial proteomics maps disease-associated abundance changes in detectable mitochondrial and mitochondria-related proteins. These results provide a protein-level layer for investigating hypotheses involving energy metabolism, oxidative stress responses, protein import, quality control, and other processes relevant to mitochondrial dysfunction.
The analysis does not directly measure mitochondrial respiration, membrane potential, reactive oxygen species production, mitophagy flux, or organelle morphology. Differential proteins should therefore be interpreted as changes relevant to mitochondrial dysfunction hypotheses rather than as direct proof that mitochondrial function has failed. Functional, metabolic, or imaging experiments are needed when activity or morphology must be demonstrated directly.
What Proteomics Contributes to Mitochondrial Dysfunction Research
Mitochondrial dysfunction is a functional concept that may involve impaired respiration, altered membrane potential, oxidative stress, disrupted quality control, or abnormal organelle dynamics. Mitochondrial proteomics contributes a complementary protein-level view by measuring detectable proteins associated with these processes across defined study groups.
What proteomics can show:
- Abundance shifts in respiratory-chain and ATP synthase subunits
- Changes in proteins linked to import, assembly, and turnover
- Altered levels of redox-handling and stress-response proteins
- A ranked candidate list tied to the disease comparison
What proteomics cannot show on its own:
- Respiration rate or oxygen consumption
- Membrane potential or proton-motive force
- ROS production or enzyme activity
- Direct proof that organelle function failed
Keeping this distinction clear helps decide whether mitochondrial proteomics fits the neurodegenerative question, or whether a functional assay module should run in parallel.
A practical planning question is whether the intended conclusion concerns protein abundance or mitochondrial function. Proteomics can support statements about detectable protein changes and pathway annotations. Statements about respiration, ROS, membrane potential, organelle turnover, or morphology require independent measurements.
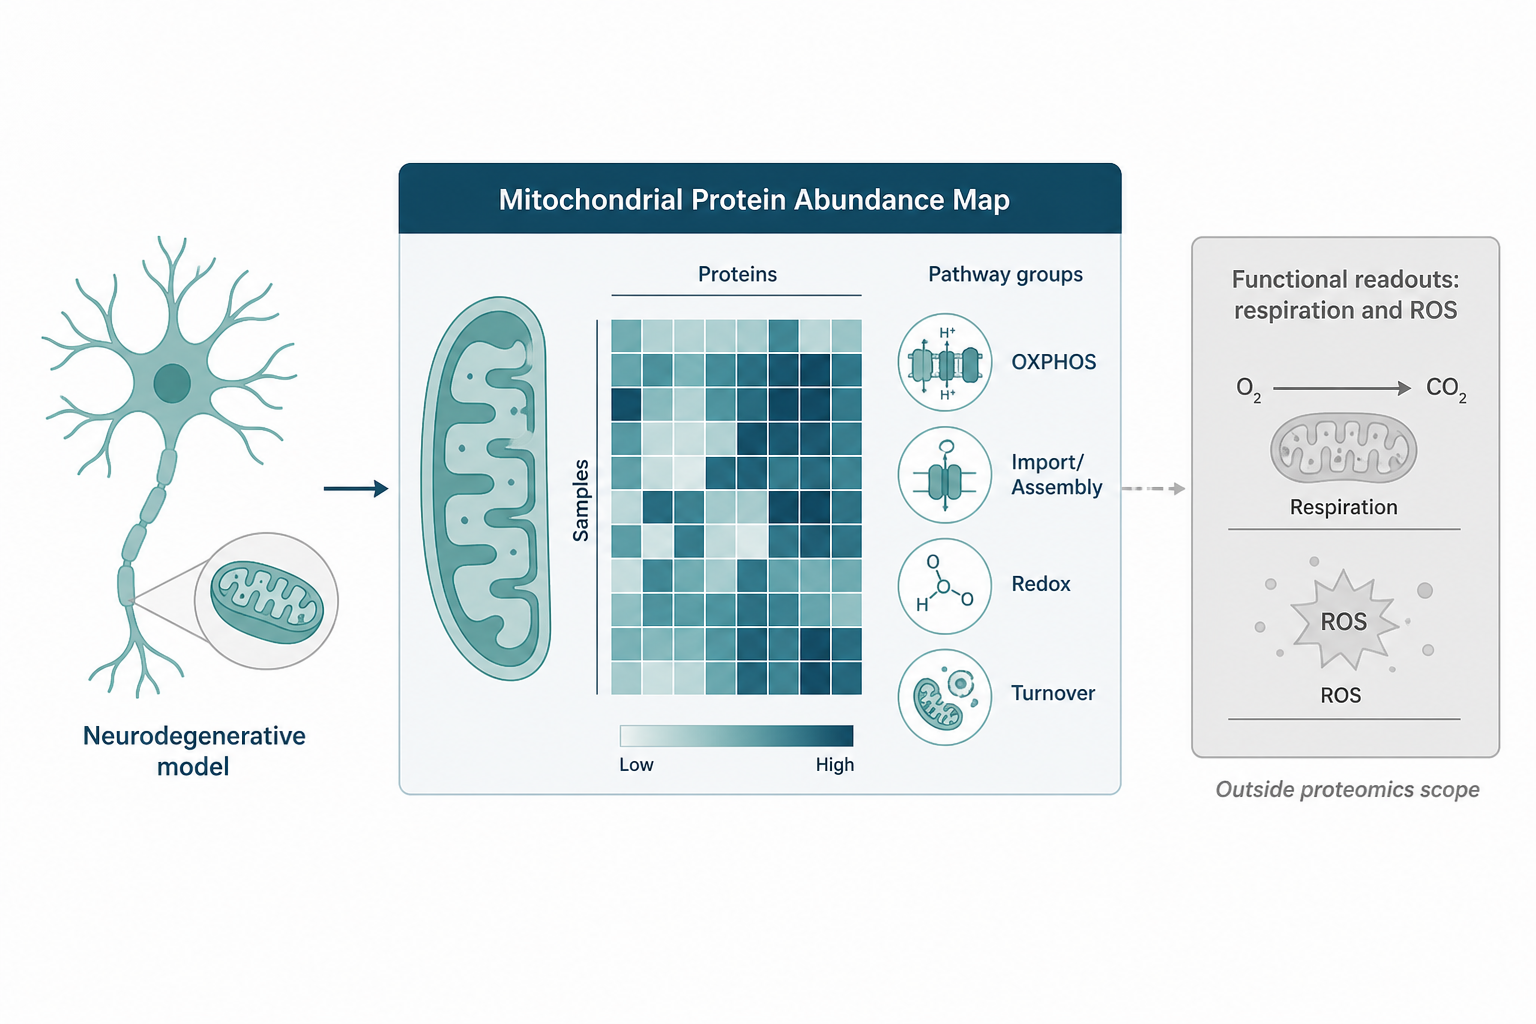
Figure 1. Proteomics maps abundance patterns of detectable mitochondrial and mitochondria-related proteins, while functional readouts require separate measurements.
When This Fits a Neurodegenerative Study
|
Research aim |
Fit for mitochondrial proteomics |
Design note |
|---|---|---|
|
Map mitochondrial protein changes in disease versus control |
High |
Prefer enrichment for organelle claims |
|
Compare models with different genetic or toxic triggers |
High |
Match handling across arms |
|
Rank dysfunction-related protein candidates |
High |
Quantitative route required |
|
Measure respiration or membrane potential |
Low |
Needs a functional assay module |
|
Confirm ROS or enzyme activity |
Low |
Plan phenotype work separately |
|
Infer clinical diagnosis from one screen |
Low |
Keep claims at exploratory research level |
Planning a neurodegenerative disease model study? Share your model type, sample source, brain region or cell type, study groups, and intended protein-level outputs through our Mitochondrial Proteomics Project Inquiry Form to discuss initial feasibility.
Pathway Groups Commonly Read in Neurodegenerative Models
Mitochondrial dysfunction in neurodegenerative disease is often discussed through several protein groups. Proteomics can describe abundance shifts in these groups at a descriptive level.
Energy and oxidative phosphorylation proteins include respiratory-chain subunits and ATP synthase components. Shifts here suggest remodeling of the energy machinery, but they do not by themselves prove lower respiration.
Import and assembly proteins include translocase components and assembly factors. Changes here can point to altered mitochondrial biogenesis or maintenance, which is a common theme in aging and neurodegeneration models.
Redox and stress-handling proteins include enzymes and chaperones linked to oxidative damage response. Abundance shifts may align with stress hypotheses, but they are not a direct ROS measurement.
Turnover and repair proteins include factors linked to mitochondrial removal and repair. Changes here can support a dysfunction narrative at the protein level, but they do not confirm autophagy flux without separate assays.
Reading these groups together helps build a coherent protein-level story. Each group should be reported as an abundance pattern, not as confirmed functional failure. When several groups shift in the same direction, the pattern is stronger as a descriptive signal, but it still stops at protein abundance until functional data are added.
Applications in Neurodegenerative Disease Research
Comparing disease and control tissue or models
Use mitochondrial-enriched material to compare disease and matched control arms. This fits questions about whether the mitochondrial proteome is broadly or selectively altered in the disease state.
Comparing genetic or toxic trigger models
Use defined model arms, such as mutation-bearing versus wild-type lines or toxin-exposed versus control, to rank proteins that track with the trigger. Treat the output as candidates for mechanism work rather than as confirmed drivers.
Building a candidate list for follow-up validation
Use quantitative screening to produce a ranked shortlist, then plan orthogonal validation as a separate module. Western blot or targeted follow-up can be discussed after candidates are set, but those steps are not automatic parts of the screening deliverable.
Study Design Notes
Before locking a route, state the dysfunction claim in plain terms. If the claim is organelle-specific, plan mitochondrial enrichment. If the claim is about abundance differences across arms, plan quantitative mitochondrial proteomics rather than identification alone.
Points worth locking early:
- Define arms clearly: disease versus control, or trigger-positive versus trigger-negative
- Match tissue type, dissection workflow, enrichment, and storage across arms
- Match protein amount, freeze history, and buffer across arms
- Decide whether Phase 1 is a pilot comparison and Phase 2 is a broader cohort or validation
Neurodegenerative samples often come from brain regions or cell models with high heterogeneity. Keeping dissection and enrichment rules matched across arms reduces protein differences that come from handling rather than from disease biology.
For post-mortem or biobank tissue, record collection interval, storage temperature, and any freeze-thaw history before enrichment is planned. These factors can affect recovery of membrane proteins and can complicate a disease comparison if they differ between arms.
Sample planning amounts for mitochondrial enrichment work:
- Cells: about 5 x 10^7 cells per sample
- Animal tissue: about 200 mg per sample
- Isolated mitochondrial protein: at least 50 ug, with 80 to 100 ug preferred when possible
- Isolated mitochondrial protein concentration: at least 0.5 ug/uL, with 1 ug/uL or higher preferred when possible
Acquisition mode follows cohort structure after quantification is chosen. DDA suits smaller pilots, with software direction commonly including MaxQuant or Proteome Discoverer. DIA suits broader matched cohorts, with software direction commonly including Spectronaut or DIA-NN. TMT suits predefined multiplexed group maps. Platform discussion can include Orbitrap Exploris 480, timsTOF Pro, and Orbitrap Astral once the route is set.
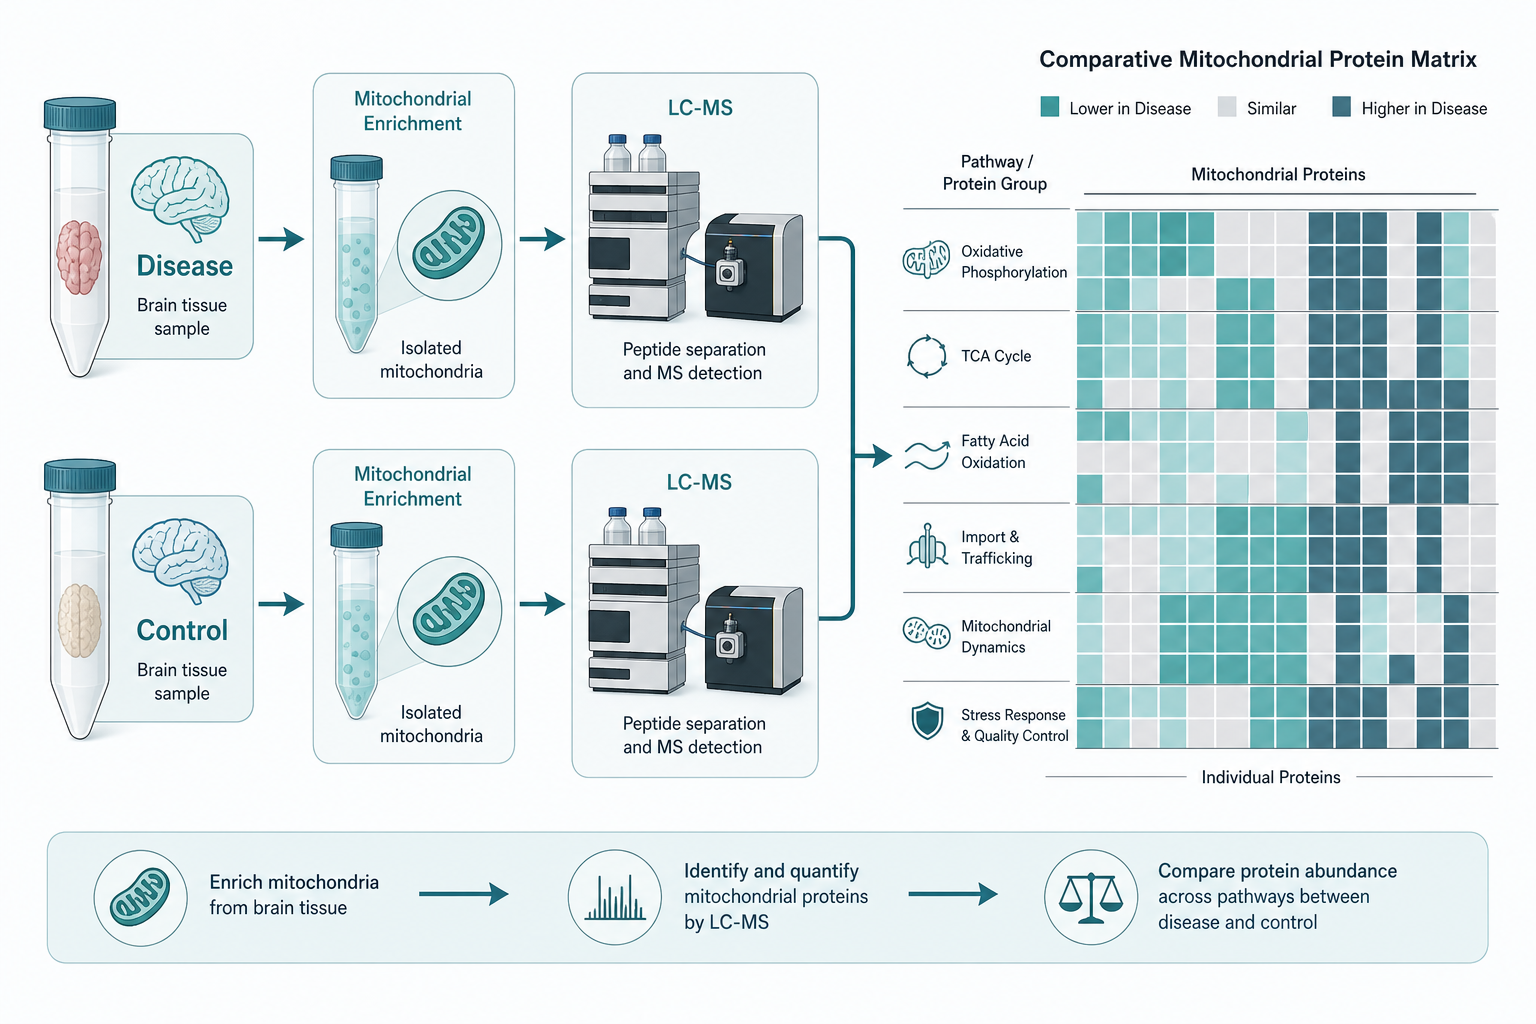
Figure 2. Matched disease and control arms support a comparative mitochondrial protein map for dysfunction-related interpretation.
Reading Results Without Overclaiming
A useful neurodegenerative proteomics report answers three practical questions.
Which mitochondrial proteins changed between arms.
Which pathway groups those proteins belong to at a descriptive level.
Which candidates deserve orthogonal or functional follow-up.
It does not answer whether respiration declined, whether ROS rose, or whether autophagy flux changed. Those conclusions need functional assays and independent evidence.
A practical way to read the report:
- Report results as protein abundance patterns linked to dysfunction hypotheses
- Keep organelle claims tied to enrichment quality and matched handling
- Separate broad abundance shifts that may reflect mitochondrial content from selective remodeling
- Plan respiration, ROS, or imaging modules separately when function or morphology must be shown
MtoZ Biolabs can review the neurodegenerative model, study arms, and expected claim before the analytical route is locked.
Decision Checklist
Confirm the question is about mitochondrial protein change, not functional readouts alone.
Choose enrichment when the claim is organelle-specific.
Choose quantitative mitochondrial proteomics when arms will be compared.
Match dissection, enrichment, and handling across every arm.
Group results by pathway category for descriptive interpretation.
Plan functional and imaging follow-up as separate modules when needed.
If the current goal is only to test whether mitochondrial proteomics fits a neurodegenerative direction, start with a clearly defined disease versus control comparison and a short candidate list rather than an open catalog.
Related Services
Mitochondrial Proteomics Service
Mitochondrial Isolation and Mitochondrial Protein Purification Service
Subcellular Proteomics Service
Frequently Asked Questions
1. Can mitochondrial proteomics reveal dysfunction in neurodegenerative disease?
Yes, at the protein level. It maps mitochondrial protein abundance changes across arms and supports dysfunction-related hypotheses, but it does not measure respiration or ROS directly.
2. Does it measure respiration or membrane potential?
No. Those are functional readouts that need separate assay modules.
3. What protein groups are usually reviewed?
Common groups include oxidative phosphorylation subunits, import and assembly factors, redox-handling proteins, and turnover-related proteins.
4. Does a protein decrease mean function failed?
Not necessarily. Abundance and activity are different measurements. Functional claims need separate assays.
5. What sample amounts should be planned?
Plan about 5 x 10^7 cells, about 200 mg animal tissue, or isolated mitochondrial protein of at least 50 ug, with 80 to 100 ug preferred when possible.
6. When should functional assays be added?
Add respiration, ROS, or imaging assays when the study must show dysfunction at the functional or morphological level, not only at the protein level.
Conclusion
Mitochondrial proteomics reveals mitochondrial dysfunction in neurodegenerative disease research as protein-abundance patterns across energy, import, redox, and turnover groups. Enrichment supports organelle-specific claims, and quantification supports comparison across disease and control arms.
Report these results as protein-level evidence linked to dysfunction hypotheses, keep functional endpoints as separate modules, and read differential proteins as ranked candidates. For project-specific review of a neurodegenerative design, contact MtoZ Biolabs with model type, study arms, and the expected analytical claim.
How to order?




