


Analyzing Data from PhIP-Seq Experiments
-
FASTQ files or equivalent sequencing read files.
-
Library reference with peptide identifiers and antigen annotations.
-
Input library or baseline sequencing data.
-
No-serum, bead-only, or other negative controls.
-
Biological group labels and technical replicate information.
-
Sample metadata, including collection and storage variables.
-
Peptide sequence and peptide identifier.
-
Parent antigen, protein, pathogen, or proteome region.
-
Library source and tiling position.
-
Sample group and control label.
-
Replicate and batch information.
-
Enrichment above input and negative-control background.
-
Agreement across technical replicates.
-
Consistency within a biological group.
-
Support from neighboring tiled peptides or related antigen regions.
-
A plausible relationship to disease status, exposure history, vaccination, or phenotype.
-
Low mapped read rate across many samples — possible reference mismatch or sequencing quality problem.
-
Very uneven input representation — possible library bottleneck or amplification bias.
-
High negative-control enrichment — possible nonspecific binding or bead background.
-
Poor replicate agreement — possible inconsistent capture, low signal, or batch variation.
-
Candidate hits found only in one outlier sample — possible sample-specific artifact.
-
Strong group separation by processing batch — possible confounding rather than biology.
Introduction
PhIP-Seq data analysis can decide whether a broad antibody screening experiment becomes a clear candidate list or an ambiguous table of peptide read counts. A serum or plasma cohort may contain biologically meaningful antibody signals, but sequencing output alone does not identify disease-associated epitopes, exposure signatures, or biomarker candidates. Raw reads must be mapped to the correct peptide library, normalized against input and controls, filtered for background, compared across sample groups, and interpreted with validation in mind.
The main difficulty is that PhIP-Seq data contain both biological signal and technical structure. Library representation can be uneven. Some phage clones may bind nonspecifically to beads or capture reagents. Sample handling can introduce batch effects. Sequencing depth can vary across samples. A high read count may reflect true antibody enrichment, but a high read count can also reflect input abundance or background carryover. Good analysis keeps these sources separate before biological conclusions are made.
For research teams analyzing antibody profiling, epitope discovery, vaccine response, or serological biomarker projects, MtoZ Biolabs can help connect the analysis workflow with experimental design, QC review, candidate prioritization, and downstream validation planning.
Related Services
| Research Need | Recommended Service |
| Need broad antibody reactivity profiling from serum or plasma | PhIP-Seq Antibody Analysis Service |
| Need peptide-level epitope discovery after screening | Antibody Epitope Mapping Service |
| Need targeted validation of candidate peptide regions | Peptide Array-Based Epitope Mapping Service |
| Need antibody sequence support for downstream discovery programs | Antibody Sequencing Service |
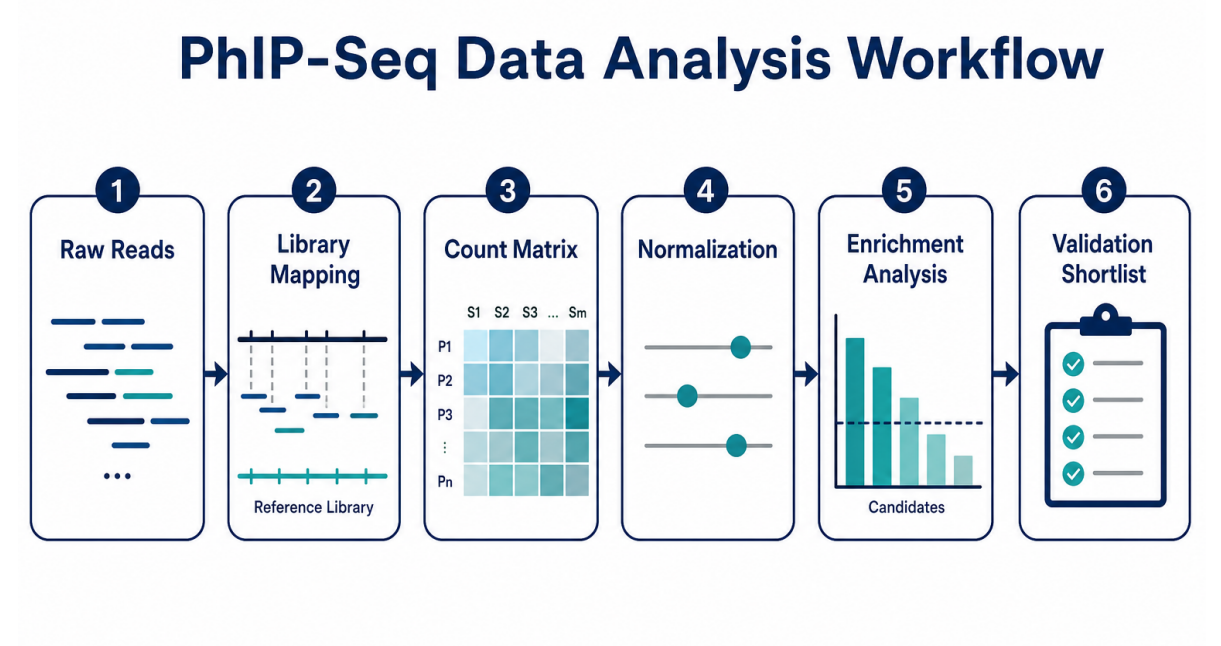
Figure 1. The analysis workflow converts raw sequencing reads into peptide enrichment, candidate ranking, and validation-ready outputs.
What the Analysis Starts with
The analysis begins with three inputs: sequencing reads, a peptide library reference, and experimental metadata. Sequencing reads usually come from enriched phage DNA after immunoprecipitation. The peptide library reference links each DNA barcode or insert sequence to a displayed peptide. Metadata describe sample group, control type, replicate status, batch, clinical label, time point, and sample handling details.
These inputs must be consistent. If the library reference does not match the actual library, read mapping becomes unreliable. If metadata are incomplete, group comparisons may be misleading. If negative controls are missing, background enrichment becomes difficult to estimate. A data table is only useful when the experimental context is attached to each sample.
Key inputs should include:
Step 1: Read Processing and Library Mapping
Read processing prepares the dataset for enrichment analysis. Low-quality reads, adapter contamination, short reads, or unexpected sequences should be removed or flagged. Clean reads are then mapped to the peptide library reference. The mapping step assigns each sequencing read to a peptide clone, peptide region, antigen, or library feature.
Mapping quality matters because downstream analysis assumes that read counts reflect peptide abundance. Low mapped read rates may suggest sequencing quality issues, incorrect reference files, library contamination, or unexpected insert sequences. Highly uneven mapping may indicate library bottlenecks or amplification bias.
| Checkpoint | What to Review | Why It Matters |
| Read quality | Base quality, adapter content, read length | Poor reads can reduce mapping accuracy |
| Mapping rate | Percentage of reads assigned to library peptides | Low mapping weakens enrichment estimates |
| Peptide coverage | Number of represented peptide clones | Missing clones can create false negatives |
| Input distribution | Starting abundance of library members | Input imbalance can mimic enrichment |
Step 2: Count Matrix Construction
After mapping, the analysis generates a count matrix. Rows represent peptides, peptide regions, or antigen annotations. Columns represent samples, controls, or input library runs. Each value represents the number of reads assigned to a peptide in a sample.
The count matrix is not the final result. Raw counts are affected by sequencing depth, starting library abundance, sample-specific recovery, and technical background. A peptide with many reads in one sample may not be enriched if the same peptide was abundant in the input library or negative controls.
A useful count matrix should be linked to annotation fields:
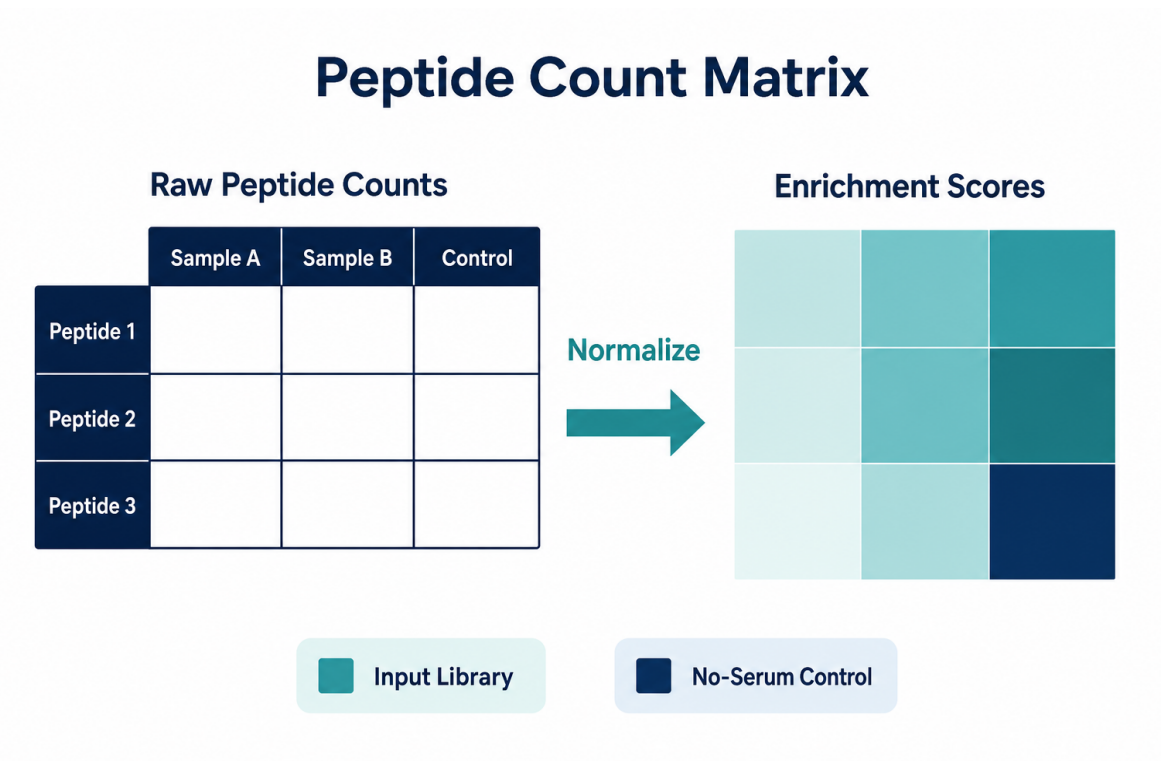
Figure 2. Raw peptide counts become interpretable only after normalization, control comparison, and annotation.
Step 3: Normalization and Background Filtering
Normalization makes samples more comparable. Common approaches adjust for sequencing depth, input library abundance, sample-specific read totals, or background levels from negative controls. The right strategy depends on library design, sample number, control structure, and research question.
Background filtering is equally important. Some peptide clones may bind nonspecifically to beads, antibodies, capture reagents, or phage particles. Some peptide sequences may repeatedly appear in negative controls. These background-prone peptides should be flagged before candidate interpretation.
| Analysis Goal | Practical Method | Interpretation Benefit |
| Adjust sequencing depth | Library size normalization or count scaling | Reduces sample-to-sample read depth effects |
| Account for input abundance | Compare enriched reads with input library reads | Separates true enrichment from library imbalance |
| Remove nonspecific binders | Filter peptides enriched in no- serum controls | Reduces false-positive candidates |
| Evaluate reproducibility | Compare technical replicates | Identifies unstable peptide signals |
| Support group comparison | Model disease, control, time point, or treatment groups | Links enrichment to biological questions |
Normalization should not hide poor experimental quality. If controls fail, if replicates disagree strongly, or if mapping rates are low, the dataset may need technical review before statistical comparison.
Step 4: Peptide Enrichment Analysis
Peptide enrichment analysis asks which peptides are overrepresented after antibody capture. Enrichment can be calculated relative to input library counts, negative controls, baseline samples, or matched comparison groups. The result may be expressed as fold enrichment, log enrichment, normalized score, statistical significance, or model-based effect size.
Strong enrichment results usually show several features:
Single-peptide hits should be interpreted carefully. A single enriched peptide may be real, but isolated hits require more scrutiny than enriched peptide regions supported by adjacent sequences. For tiled libraries, regional patterns often provide stronger evidence than one peak.
Step 5: Group Comparison and Candidate Prioritization
Many PhIP-Seq experiments are designed around comparison. Researchers may compare disease and control groups, pre- and post-vaccination samples, exposed and unexposed groups, responder and non-responder cohorts, or longitudinal time points. Group comparison transforms peptide enrichment into biological interpretation.
Candidate prioritization should combine statistical and biological evidence. A useful candidate should not be selected only because the candidate has the smallest p-value. A useful candidate should also show reproducibility, low background, interpretable annotation, and relevance to the study question.
| Candidate Feature | Stronger Evidence | Weaker Evidence |
| Enrichment pattern | Consistent across related samples | Driven by one outlier sample |
| Background behavior | Low in negative controls | Recurrent in no-serum controls |
| Regional support | Neighboring peptides support the same region | Single isolated peptide only |
| Biological context | Antigen or motif fits the study question | Poor annotation or unclear relevance |
| Validation feasibility | Candidate can be tested by peptide array, ELISA, or immunoassay | Candidate requires unavailable assay format |
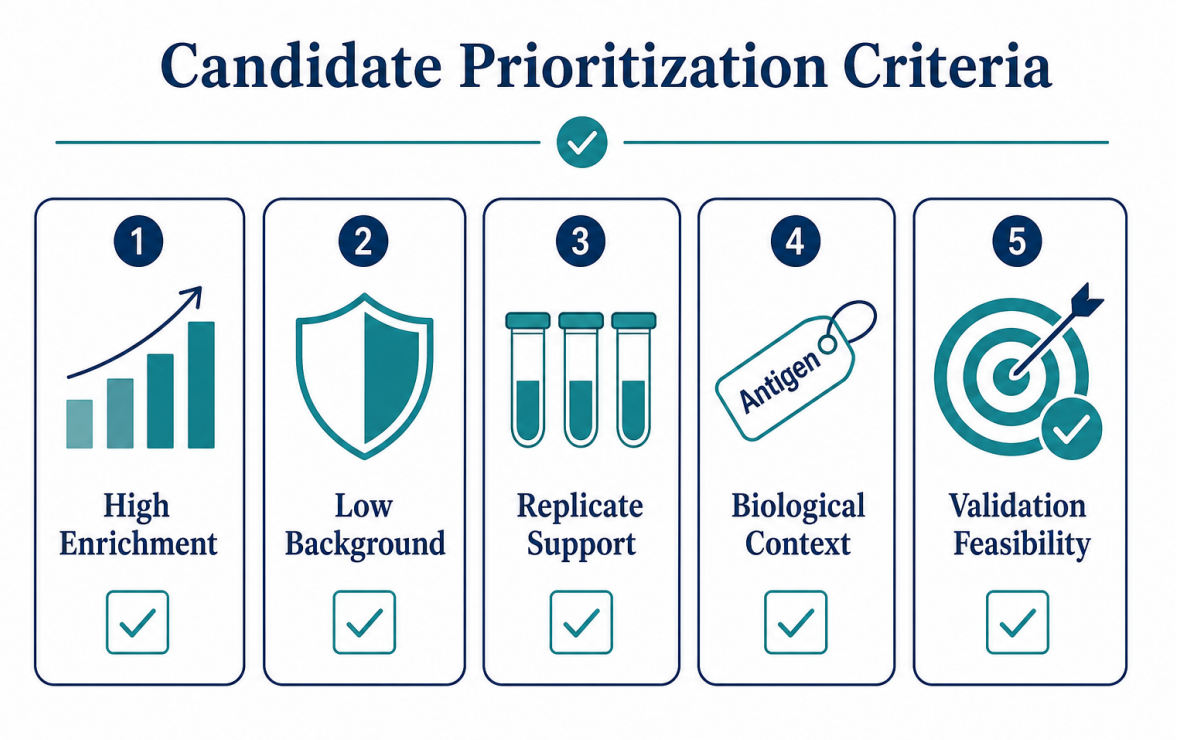
Figure 3. Candidate prioritization should combine enrichment strength, background behavior, replicate support, biological context, and validation feasibility.
Common Data Outputs
A strong data report should help researchers understand both data quality and biological meaning. A ranked peptide list alone is usually not enough. The report should show how reads were processed, how counts were normalized, which controls were used, and why candidates were prioritized.
Typical outputs include:
| Output Type | What It Shows | How Researchers Use the Output |
| QC summary | Mapping rate, read depth, peptide coverage, replicate agreement | Decide whether the dataset is technically reliable |
| Enrichment table | Peptide-level scores, fold changes, p- values, annotations | Review candidate antibody- reactive peptides |
| Heatmap | Enrichment patterns across samples and groups | Identify sample clusters or group- specific signals |
| Volcano plot | Effect size and significance | Prioritize differential peptide enrichment |
| Peptide coverage track | Enrichment across tiled antigen regions | Locate candidate epitope regions |
| Validation shortlist | Selected candidates with assay recommendations | Plan peptide array, ELISA, or targeted immunoassay follow-up |
Visualizations should support interpretation, not decorate the report. A heatmap is useful when the clustering pattern matches the study question. A volcano plot is useful when effect size and significance are both considered. A peptide coverage track is useful when the library contains tiled peptides from known antigen regions.
Quality Control Problems to Watch for
Data analysis should identify technical problems before candidate interpretation. Some problems can be managed by filtering or modeling. Other problems may require repeating part of the workflow.
Common warning signs include:
QC problems should be reported clearly. Hiding QC issues can lead to overinterpretation and wasted validation effort.
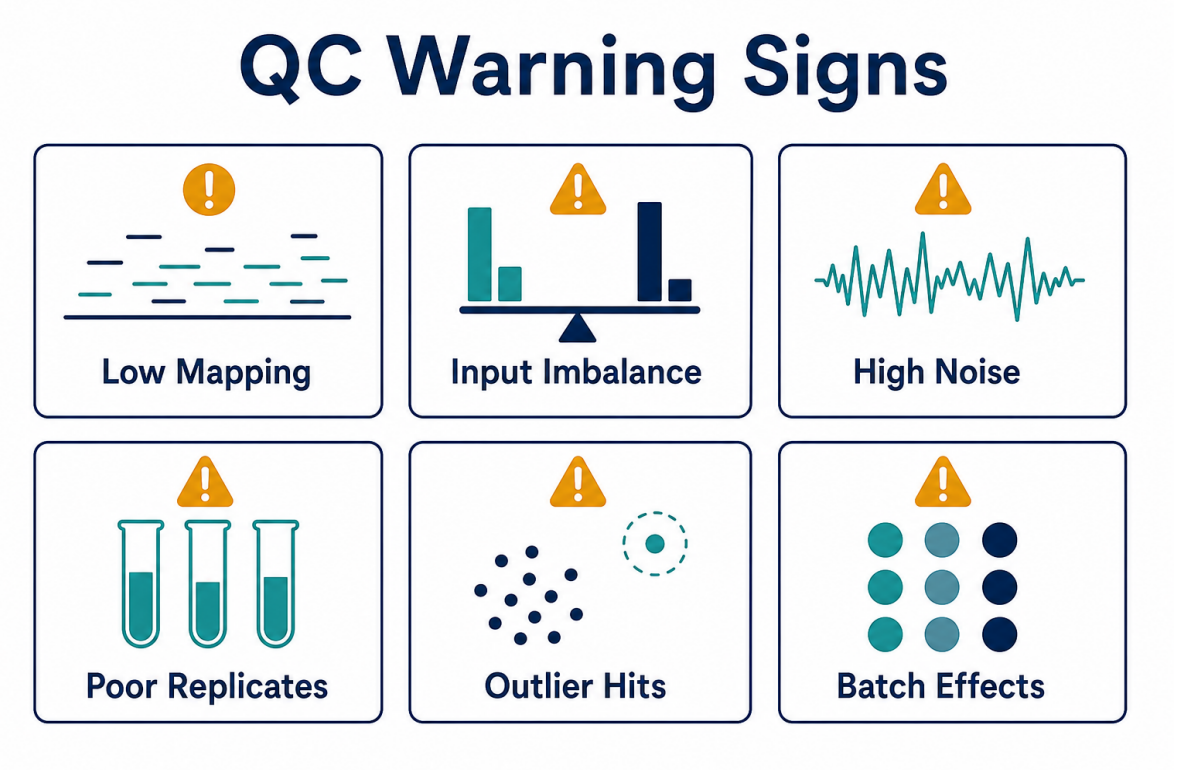
Figure 4. Data analysis should flag mapping, input, background, replicate, outlier, and batch- related warning signs.
Connecting Data Analysis to Validation
The analysis should end with a validation plan. Discovery results are candidate findings, not final biomarkers or confirmed epitopes. Validation design depends on the candidate type, sample availability, and final research goal.
Peptide arrays can test selected candidate regions across a larger sample set. ELISA or targeted immunoassays can evaluate specific antigen or peptide signals. Western blotting may provide protein-level context. Protein-based binding assays may be needed when a candidate appears structure-dependent.
The validation shortlist should include the reason each candidate was selected. Strong entries usually include enrichment score, group association, replicate support, background status, antigen annotation, and suggested validation method. This structure helps researchers move from a large discovery dataset to a focused follow-up experiment.
Frequently Asked Questions
1. What is the first step in data analysis?
The first step is to map clean sequencing reads to the correct peptide library reference. Accurate mapping is required before count construction, normalization, enrichment analysis, or candidate ranking.
2. Why are input library reads important?
Input library reads show the starting abundance of peptide clones before antibody capture. Input comparison helps distinguish true enrichment from library imbalance.
3. Can high read counts alone identify antibody targets?
No. High read counts must be compared with input libraries, negative controls, replicates, and biological groups. A high count without background control may not indicate true antibody binding.
4. What outputs should the data report include?
A useful report should include QC metrics, normalized counts, enrichment tables, group comparisons, visualizations, candidate ranking, and validation recommendations.
5. How are candidate peptides validated?
Candidate peptides can be validated with peptide arrays, ELISA, targeted immunoassays, Western blotting, or protein-based binding assays. The validation method should match the candidate and the research goal.
Conclusion
PhIP-Seq data analysis turns sequencing output into interpretable antibody profiling results. A reliable analysis workflow maps reads to the peptide library, builds an annotated count matrix, normalizes against input and controls, filters background, compares biological groups, prioritizes candidate peptides, and connects findings to validation.
For research teams working with antibody profiling data, epitope discovery datasets, or serological biomarker screens, careful analysis can reduce false positives and improve follow-up planning. Contact MtoZ Biolabs to discuss data analysis support, candidate interpretation, and validation strategy for the next screening project.
How to order?

