



A label-free quantitative proteomics (LFQ) project usually arrives at analysis with separate liquid chromatography-tandem mass spectrometry (LC-MS/MS) runs for each digest, a predefined group contrast, and raw files that still need to become a protein-by-sample matrix. Label-free quantification compares relative peptide abundance from mass spectrometry signals without isobaric or metabolic labels. On this page, LFQ refers to unlabeled digests where quantitative values come from MS1 chromatographic peak areas after data-dependent acquisition (DDA), or from extracted fragment traces when the same digests were acquired as data-independent acquisition (DIA). Spectral counting tallies MS/MS events and can rank detectability, but it is a weak substitute for a calibrated fold-change matrix when group statistics are required.
What LFQ Data Analysis Can Answer
LFQ analysis can support a same-protein relative comparison between predefined groups in one study. It can rank which proteins show consistent intensity shifts after identification confidence, cross-run alignment, normalization, and missing-value rules are declared. It cannot recover proteins that were never identified, cannot rank different proteins as copy numbers, and cannot support amount or concentration claims without a matched stable isotope-labeled internal standard (SIS).
The analysis plan has to match how the files were acquired. DDA label-free work extracts MS1 peak areas for peptides identified in each run, then aligns features across runs (Cox and Mann 2008). Unlabeled DIA extracts fragments from scheduled isolation windows using a spectral library or a library-free workflow; window placement and library provenance control the peptide set. Labeling and acquisition are separate decisions. In MtoZ Biolabs quantitative proteomics offerings, unlabeled digests are commonly processed as DDA-based label-free or as DIA. TMT workflows are typically acquired in DDA to read reporter ions and are not interchangeable with an LFQ matrix without a bridging design.
If the biological question is still an open protein inventory, analysis should stay on the discovery matrix. If a short peptide list is already closed, the next step belongs to a targeted assay rather than another round of LFQ statistics on the same table.
How LFQ Signals Are Turned into a Protein Matrix
A practical order is stable even when the search environment changes. Raw files are converted and searched or extracted against an appropriate protein database, with peptide and protein false discovery rate (FDR) thresholds declared. Quantitative values are extracted in a method-specific way. Features are aligned across runs so the same peptide maps to the same row. Samples are normalized so global loading or drift does not masquerade as biology. Peptides are summarized to proteins. Only then should group contrasts be tested.
LFQ intensities become comparable only after identification, extraction, alignment, and normalization are locked to the acquisition route.
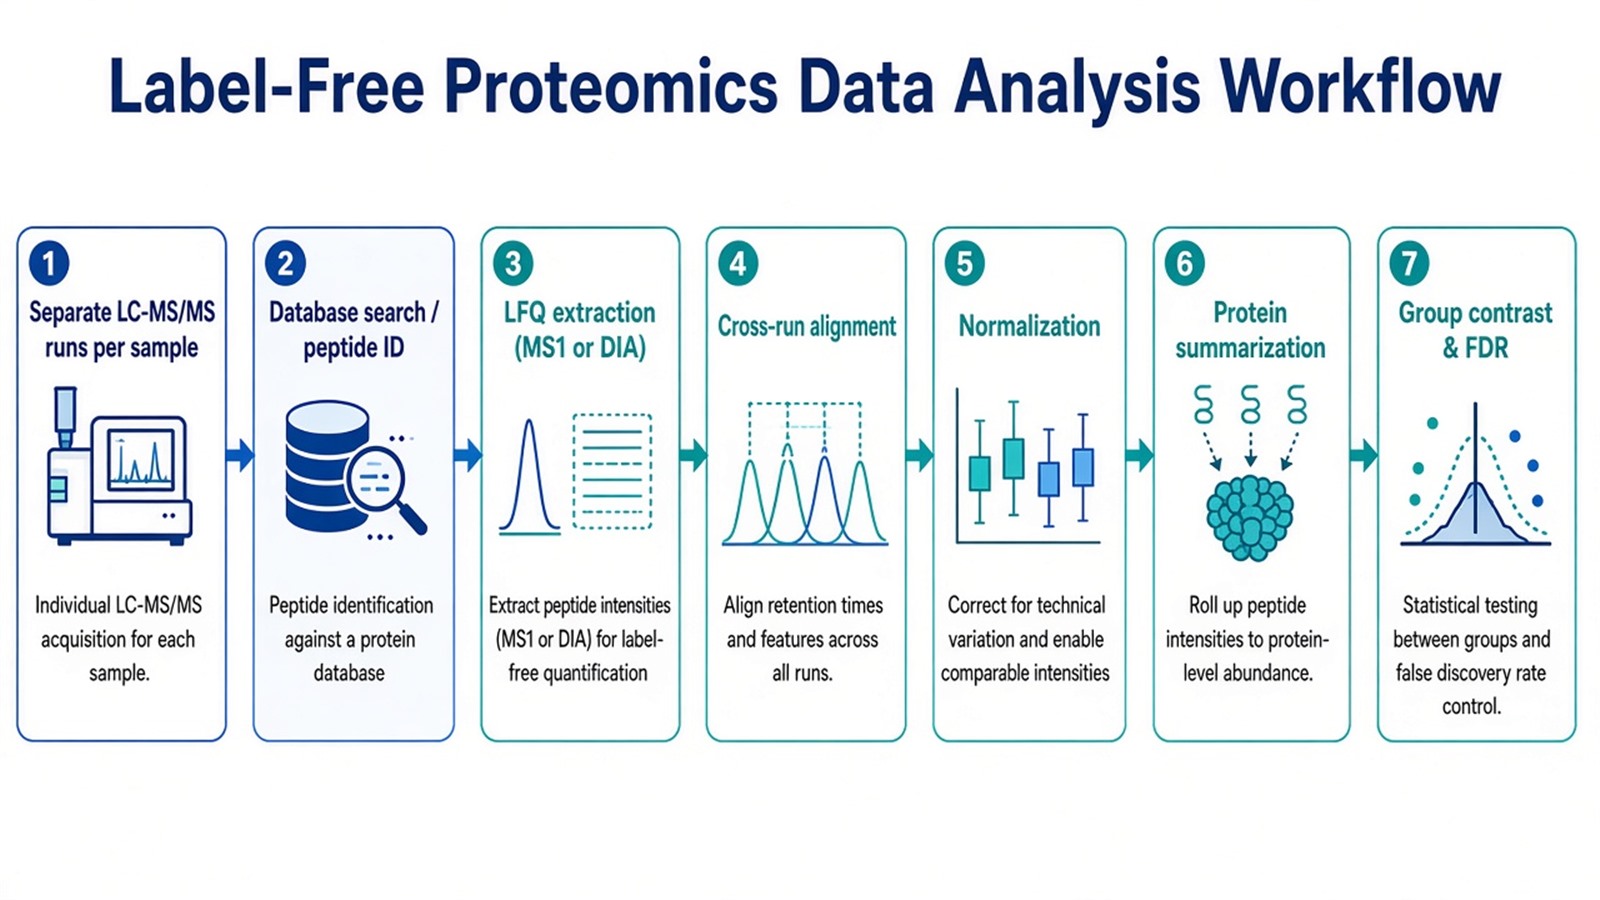
Figure 1. LFQ data analysis moves from separate injections to a protein matrix before any differential call is reviewed.
For DDA LFQ, the quantitative signal is commonly the MS1 chromatographic peak area of identified peptides. Match-between-runs can fill some identifications and can also transfer incorrect assignments if mass and retention-time tolerances are too open (Cox et al. 2014). MaxLFQ-style summarization uses pairwise peptide ratios to stabilize protein-level estimates when many runs are compared in the same experiment.
For unlabeled DIA, fragments are extracted from isolation windows. The matrix depends on library quality, precursor mapping, and empirically derived FDR control. Mixing DDA LFQ and DIA files in one statistical model without a bridging design creates contrasts the data cannot defend.
Database choice, enzyme specificity, variable modifications, and unique-peptide rules change protein inference. Shared peptides can pull homologs into the same group or split one gene product across several rows (Nesvizhskii and Aebersold 2005). Those settings should be reported with the matrix, because a later fold change is only as specific as the protein group it sits on.
Researchers can refer to How to Analyze Quantitative Proteomics Data for how generic protein-matrix statistics and enrichment boundaries are set after the LFQ table is built.
Parameters That Control Missing Values and Cross-Run Comparability
Each LFQ run is an independent injection. Loading, column age, spray stability, and batch structure can shift total signal. Normalization removes a global offset when a stated fraction of the proteome is expected to stay stable. It does not unmix a batch that is identical to the experimental factor. Interleaving groups in extraction and acquisition remains a design requirement, not a software fix.
Missing values are expected, especially at low abundance. Some missing cells are random. Many are abundance-dependent, so a peptide weak in one group drops out of detection (Lazar et al. 2016). Imputation inserts a model-based number. It can enable a test, and it can create a difference that was never measured. Proteins with high missingness in every group are poor candidates for a discovery claim. Missingness that copies one treatment arm should be treated as a design or detection problem, not as a number to complete.
Key analysis parameters to record with the matrix include the FDR thresholds, the quantification rule (MS1 area, MaxLFQ, or DIA extractor settings), the normalization method and its assumption, the missing-value rule, and the exact group contrast. Quality checks on identification depth, missingness patterns, and sample clustering belong before the ranked list is interpreted.
When chromatograms, load, or run order still explain most of the variance, researchers can refer to Quantitative Proteomics: Strategies, Advantages, and Challenges for how those failure patterns are traced before a new digest is queued.
Statistical Contrasts, QC, and What the Matrix Can Defend
A differential call needs a predefined contrast, biological replicates, and a test that matches the design. Unpaired two-group studies commonly use a moderated t-test or equivalent on log-transformed values. Multi-group designs need a model that names the factor of interest. Technical replicates describe injection noise. They do not replace biological replicates for a between-animal or between-patient claim.
Fold change describes the size of a same-protein difference. A p-value describes how unusual that difference is under the chosen null, given the available replicates. Because thousands of proteins are tested, an unadjusted p-value of 0.05 will generate many false positives. Benjamini-Hochberg adjustment controls the false discovery rate among the rejected tests (Benjamini and Hochberg 1995). An adjusted p-value still depends on sample size, variance, missing-value rules, and whether batch was modeled.
Thresholds such as fold change greater than 1.5 and adjusted p below 0.05 are conventions, not biological laws. They should be declared before the ranked list is inspected, or treated as sensitivity analyses if they are varied. Pathway enrichment is optional. It is useful when a coherent protein set exists and a quantified-protein background can be defined. It is premature when the contrast is underpowered or dominated by one abundant process.
How to Choose the Next Step When LFQ Analysis Stalls
The useful test is whether the matrix passed QC, whether missingness tracks biology or batch, and whether the protein list is still open.
Observed pattern |
Check first |
Next analysis step that often helps |
|---|---|---|
Thin IDs despite adequate load |
Search settings and chromatography |
Re-search with declared FDR; fix prep before re-imputation |
Missingness tracks one group |
Run order versus treatment labels |
Rebuild cohort order; do not impute structured holes |
Global shift after one batch |
Normalization and pooled controls |
Model batch if design allows; otherwise redesign |
DDA undersampling of low-abundance peptides |
Cycle time and dynamic exclusion |
Fractionation, more input, or unlabeled DIA extraction |
Names already exist and LFQ noise persists |
Assay type |
Move to PRM or MRM confirmation in a new digest |
Contrast underpowered |
Replicate count |
Add biological replicates before enrichment |
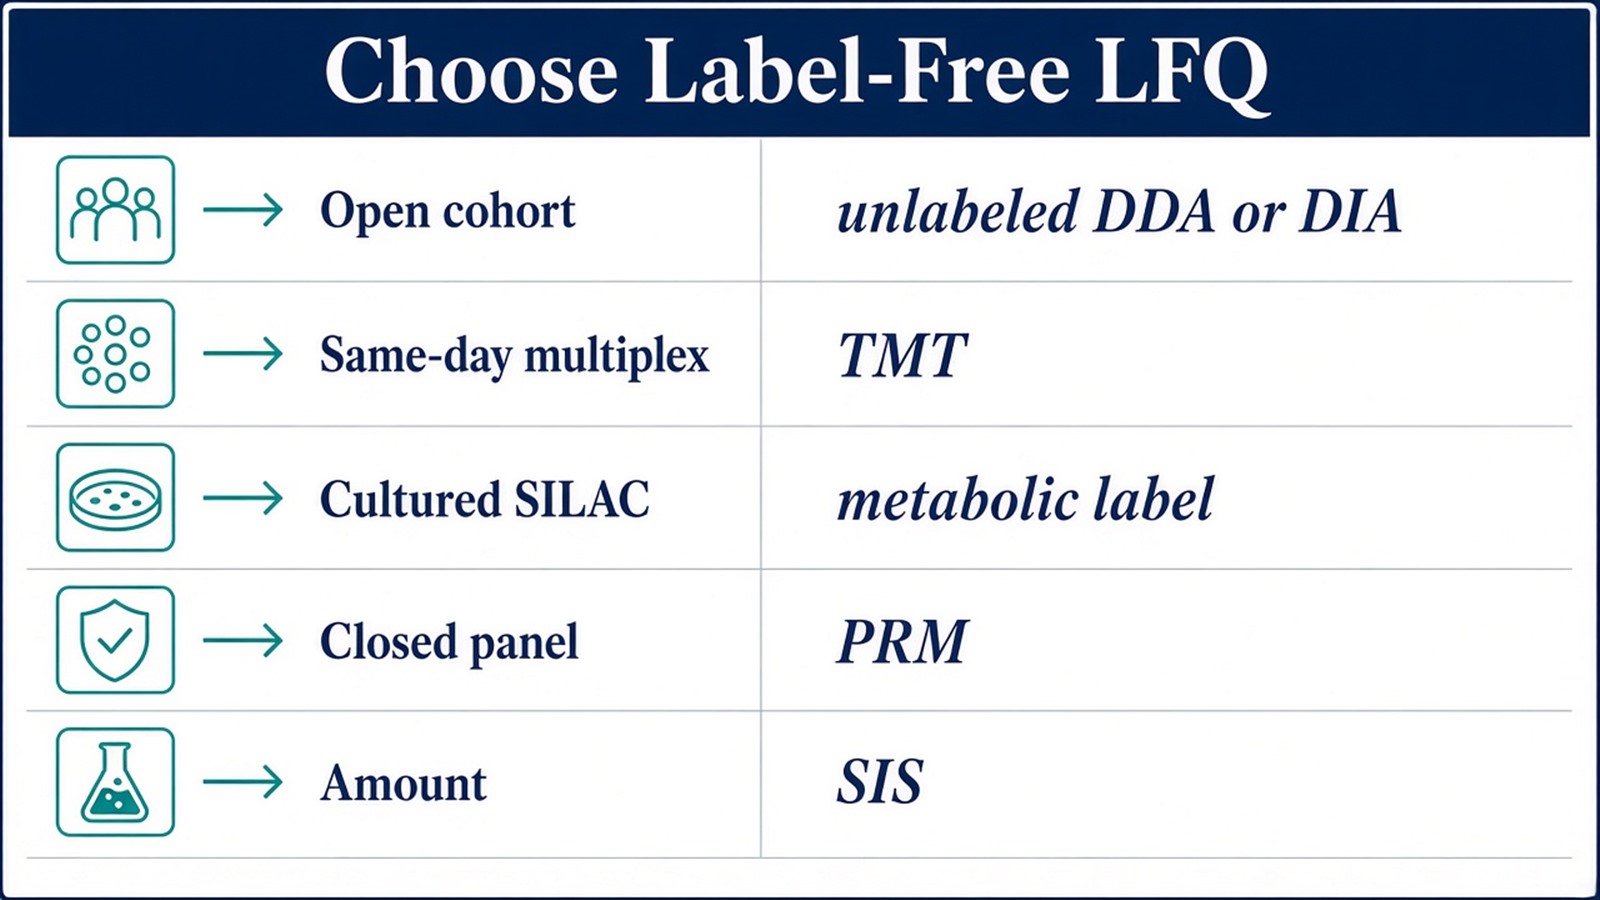
Figure 2. LFQ data analysis fits when digests were acquired unlabeled, the contrast is predefined, and QC precedes differential testing.
Acquisition quality still depends on matched extraction and digestion across the cohort. Researchers can refer to The Importance and Common Methods of Protein Quantification Analysis for more detailed sample-planning guidance when prep inconsistency is suspected.
Researchers who already have LFQ raw files, defined groups, and a requested contrast can also review the MtoZ Biolabs Label-Free Quantitative Proteomics Service for project-specific feasibility and analysis planning.
Frequently Asked Questions
1. Is spectral counting enough for LFQ group comparison?
Spectral counting ranks how often a protein received MS/MS identification. It is sensitive to proteome depth and acquisition time, and it is not a stable intensity matrix for moderated statistics across cohorts. Use MS1 peak areas or DIA fragment extraction when the study needs a defensible fold change.
2. Can DDA LFQ and unlabeled DIA files be analyzed as one matrix?
They use different extraction rules and missingness patterns. Combine them only when the study design includes an explicit bridge and the analysis plan documents how features were matched.
3. Should missing values always be imputed?
No. High missingness in every group is a weak discovery claim. Missingness that copies one group should trigger design review. Imputation can enable a test and can invent differences that were never measured.
4. Does normalization fix unequal loading from digestion?
Normalization adjusts global scale after peptides are quantified. It does not correct failed digestion or unequal protein input that occurred before injection. Bulk assays and prep records still matter.
5. When should LFQ discovery move to targeted MS?
Move when the protein list can be frozen and fragment-level confirmation is the remaining task. Keep LFQ discovery processing while new names are still required.
MtoZ Biolabs can provide label-free quantitative proteomics data analysis for unlabeled DDA and DIA projects, including protein-matrix generation, predefined group contrasts, and documented QC when project files and study design are available.
If further evaluation of search settings, normalization choice, missing-value rules, or targeted follow-up routing is needed, project details can be submitted for a feasibility review.
Reference
- Y. Benjamini, Y. Hochberg (1995). Controlling the false discovery rate: a practical and powerful approach to multiple testing. J. R. Stat. Soc. Series B, 57, 289-300. https://doi.org/10.1111/j.2517-6161.1995.tb02031.x
- J. Cox, M. Mann (2008). MaxQuant enables high peptide identification rates, individualized p.p.b.-range mass accuracies and proteome-wide protein quantification. Nat. Biotechnol., 26, 1367-1372. https://doi.org/10.1038/nbt.1511
- J. Cox, M.Y. Hein, C.A. Luber, I. Paron, M. Mann (2014). Accurate proteome-wide label-free quantification by delayed normalization and maximal peptide ratio extraction, termed MaxLFQ. Mol. Cell. Proteomics, 13, 2513-2526. https://doi.org/10.1074/mcp.M113.031031
- C. Lazar, S. Gatto, M. Ferro, M. Bruley, T. Burger (2016). Accounting for the multiple nature of missing values in label-free quantitative proteomics data sets to compare imputation strategies. J. Proteome Res., 15, 1116-1125. https://doi.org/10.1021/acs.jproteome.5b00981
- A.I. Nesvizhskii, R. Aebersold (2005). Interpretation of shotgun proteomic data: the protein inference problem. Mol. Cell. Proteomics, 4, 1419-1440. https://doi.org/10.1074/mcp.R500012-MCP200
