






Why Plant Proteomics Results Do Not Always Match RNA-Seq Data
Plant proteomics results do not always match RNA-seq data because the two layers measure different biological states at different points in gene expression. RNA-seq reports transcript abundance, whereas plant proteomics reports protein abundance in a defined tissue at a defined harvest time. Translation control, protein turnover, subcellular localization, and post-translational regulation can all allow mRNA and protein patterns to diverge even when both datasets are technically sound.
A mismatch is not automatically an error. In plant stress, development, and breeding studies, discordance can occur when transcription changes faster than protein accumulation, proteins persist after transcripts decline, or low-abundance proteins are not quantified by the proteomics workflow.
If RNA-seq and plant proteomics results disagree, first review whether tissue, harvest time, comparison design, replicate structure, and gene–protein mapping were matched before treating either dataset as wrong.
What Each Layer Is Actually Reporting
RNA-seq quantifies RNA abundance and transcript structure in the extracted RNA fraction. It is sensitive to transcriptional reprogramming and, in suitable study designs, isoform usage. It does not directly measure protein abundance, enzyme activity, protein half-life, or modification state.
Plant proteomics measures proteins recovered from the sampled tissue and analyzed by LC-MS/MS. Quantitative results reflect the detectable protein population under the selected extraction, acquisition, and data-analysis conditions.
The two outputs are most directly comparable when they refer to the same biological contrast, tissue, and harvest window. Comparing leaf RNA-seq from one experiment with root proteomics from another, or RNA at 6 h with protein at 7 d, can create apparent mismatch even when both experiments are valid independently.
Neither layer alone proves causal regulation or field performance. RNA-seq provides transcript-level evidence, while proteomics provides protein-level abundance evidence. Both require replicate review and evidence-appropriate interpretation.
Biological Reasons Protein and RNA Patterns Diverge
Several biological processes can separate transcript and protein responses in plants.
Translation control can delay or suppress protein accumulation after mRNA induction. Stress responses, developmental transitions, and tissue remodeling may alter RNA abundance before a corresponding protein-level change becomes detectable.
Protein turnover and stability can also create discordance. Some proteins remain abundant after their transcripts decline, whereas rapidly degraded proteins may not accumulate despite increased transcription.
Subcellular localization can influence apparent RNA–protein correspondence. Proteins in organelles, cell walls, or vacuoles may differ in turnover, local regulation, and extraction recovery compared with the whole-tissue transcript signal.
Post-translational regulation is not captured by standard RNA-seq. Phosphorylation, ubiquitination, and other modifications can alter protein activity, localization, or stability without changing transcript abundance. Standard quantitative proteomics measures protein abundance rather than modification state unless a dedicated PTM workflow is performed.
Multigene families and isoforms further complicate one-to-one mapping. RNA-seq may identify changes in a specific transcript, whereas proteomic peptides may map to a shared protein group representing several related gene products.
These mechanisms mean that RNA–protein discordance can reflect real biology rather than platform failure.
Technical and Design Reasons Results May Not Align
Not every mismatch is biological. Some discordance results from study design, analytical coverage, or mapping limitations.
| Mismatch source | What happens | How it appears |
|---|---|---|
| Unmatched tissue or time point | RNA and protein come from different organs or harvest windows | Apparent opposite or unrelated trends |
| Different replicate structure | RNA and protein datasets use different biological units or batches | Weak cross-layer correlation |
| Protein extraction bias | Some protein classes are recovered less efficiently | Transcript detected but protein missing or underrepresented |
| LC-MS/MS coverage | Low-abundance proteins may not enter the quantitative matrix | RNA significant, protein not quantified |
| Gene–protein mapping ambiguity | One protein group maps to several related genes | Transcript-level change appears unmatched |
| Normalization or filtering differences | Layers use different thresholds and missing-value rules | Rankings differ despite partial directional agreement |
| Sample-quality differences | One molecular layer is more affected by sample handling | Uneven replicate behavior or increased variability |
Missing protein measurements should therefore not automatically be interpreted as biological absence or lack of change.
When Discordance Is Expected vs When to Troubleshoot
Discordance can be expected in early stress responses, developmental transitions, and biological processes with strong post-transcriptional regulation. A large RNA change with a smaller or delayed protein response may still be biologically meaningful when tissue, timing, and analytical coverage are considered.
Troubleshooting is more appropriate when the two layers use different tissues, genotypes, treatment definitions, or harvest times; when replicate behavior is poor in one dataset; when gene–protein mapping is inconsistent; or when proteomics coverage is substantially lower than expected and accompanied by other quality concerns.
Do not expect one-to-one agreement across all genes. Integrative interpretation is more useful when asking which transcript-level changes are accompanied by protein-level changes in the same biological contrast, and which responses differ between the two regulatory layers.
Figure 1. Biological regulation, analytical coverage, and study-design mismatch can all contribute to differences between RNA abundance and protein abundance.
How to Interpret Non-Matching Results in Plant Projects
Start with the biological contrast rather than forcing identical gene rankings.
Ask four questions:
-
Were tissue, genotype, treatment, and harvest time matched between RNA-seq and proteomics?
-
Was the same biological replicate structure used across the two layers?
-
Could protein abundance, turnover, localization, or analytical coverage explain the observed difference?
-
Are replicate behavior and phenotype records consistent with the interpretation being proposed?
Use RNA-seq to describe transcript-level regulation and plant proteomics to describe protein-level abundance changes in the matched biological contrast. Neither dataset should automatically override the other.
A transcript change without a corresponding quantified protein remains evidence of transcript-level regulation. A protein change without RNA support may reflect protein stability, translational control, post-transcriptional regulation, or mapping limitations.
Integration is strongest when the same comparison definition and replicate logic are applied to both layers.
Designing Better Matched Comparisons Across Layers
Define the comparison before interpreting discordance. Examples include drought-treated versus control leaf at 48 h, salt-tolerant versus salt-sensitive root at matched injury score, or pathogen-inoculated versus mock leaf at 24 h.
When integrative analysis is planned from the start, collect RNA and protein material from the same biological replicate set whenever feasible. Using matched material reduces tissue, timing, and biological-unit differences between the two datasets.
Keep sampling and handling consistent across experimental groups and document harvest timing, treatment conditions, tissue identity, and replicate IDs.
Choose quantitative proteomics when the research question depends on the direction and magnitude of protein abundance changes rather than simply whether a protein can be detected.
If proteomics is added after RNA-seq has already been completed, first determine whether the available plant material, tissue type, storage history, and comparison structure remain compatible with the original RNA-seq study.
Figure 2. Confirm matched tissue, timing, comparison design, and replicate structure before interpreting RNA–protein discordance as biological or technical.
Use the following checkpoints before drawing integrative conclusions.
| Integrative planning checkpoint | RNA-seq side | Plant proteomics side |
|---|---|---|
| Contrast definition | Same treatment or genotype labels | Same treatment or genotype labels |
| Tissue | Same organ and developmental stage | Same organ and developmental stage |
| Harvest | Same time point or phenotype threshold | Same time point or phenotype threshold |
| Replicate unit | Defined independent biological replicate | Same independent unit where possible |
| Primary evidence | Transcript-level regulation | Protein-level abundance change |
| Follow-up | Transcript or pathway-level expansion | PTM or targeted protein follow-up when needed |
Matched design improves interpretability, but it does not guarantee that every differential transcript will have a quantifiable protein counterpart.
Common Mistakes When Comparing RNA-Seq and Proteomics
-
Expecting one-to-one fold-change agreement for every gene
-
Comparing RNA and protein datasets from different tissues, stages, or experiments
-
Treating missing proteins as proof of no biological change
-
Ignoring time lag between transcription and protein accumulation
-
Using pathway enrichment in one layer to override poor replicate behavior in the other
-
Treating discordance as laboratory failure without reviewing study design
-
Using proteomics only as confirmation of RNA-seq rather than as an independent protein-level evidence layer
Related Services
Integrative Transcriptomics-Proteomics Analysis Service
Transcriptome Sequencing (RNA-sequencing) Service
Frequently Asked Questions
1. Does mismatch mean the proteomics or RNA-seq experiment failed?
Not necessarily. Biological regulation, analytical coverage, and study-design differences can produce discordance even when both datasets are usable.
2. Should every induced transcript appear as an increased protein?
No. Translation control, protein turnover, analytical coverage, and mapping limitations prevent one-to-one correspondence.
3. Which layer should be trusted when results disagree?
Neither layer should automatically override the other. RNA-seq provides evidence of transcript-level change, while plant proteomics provides evidence of protein-level abundance change. Replicate quality, tissue matching, harvest timing, and mapping should be reviewed before interpreting the disagreement.
4. Can older RNA-seq data be compared with new proteomics samples?
Yes, but interpretation is strongest when tissue, biological contrast, developmental stage, and sampling conditions are comparable. Differences between the sample sets should be documented.
5. Does integration require the same harvest material?
Using material from the same biological replicate and harvest is preferred when integration is planned prospectively. When this is not possible, differences in tissue, timing, and replicate structure should be considered during interpretation.
6. What should be shared before planning an integrative plant study?
Provide the species, tissue type, comparison design, harvest timing, replicate structure, and information on whether RNA-seq data already exist or both molecular layers will be collected together.
Conclusion
Plant proteomics results do not always match RNA-seq data because transcripts and proteins represent different regulatory layers. Translation control, protein stability, subcellular regulation, analytical coverage, mapping limitations, and unmatched study design can all contribute to discordance.
Interpretation should begin by confirming tissue, timing, comparison design, and replicate structure. RNA-seq should then be interpreted as transcript-level evidence and plant proteomics as protein-level abundance evidence rather than expecting one layer to reproduce the other.
For studies combining existing RNA-seq data with plant proteomics, MtoZ Biolabs can help evaluate the comparison design and determine whether a matched proteomics and integrative analysis strategy fits the biological question.
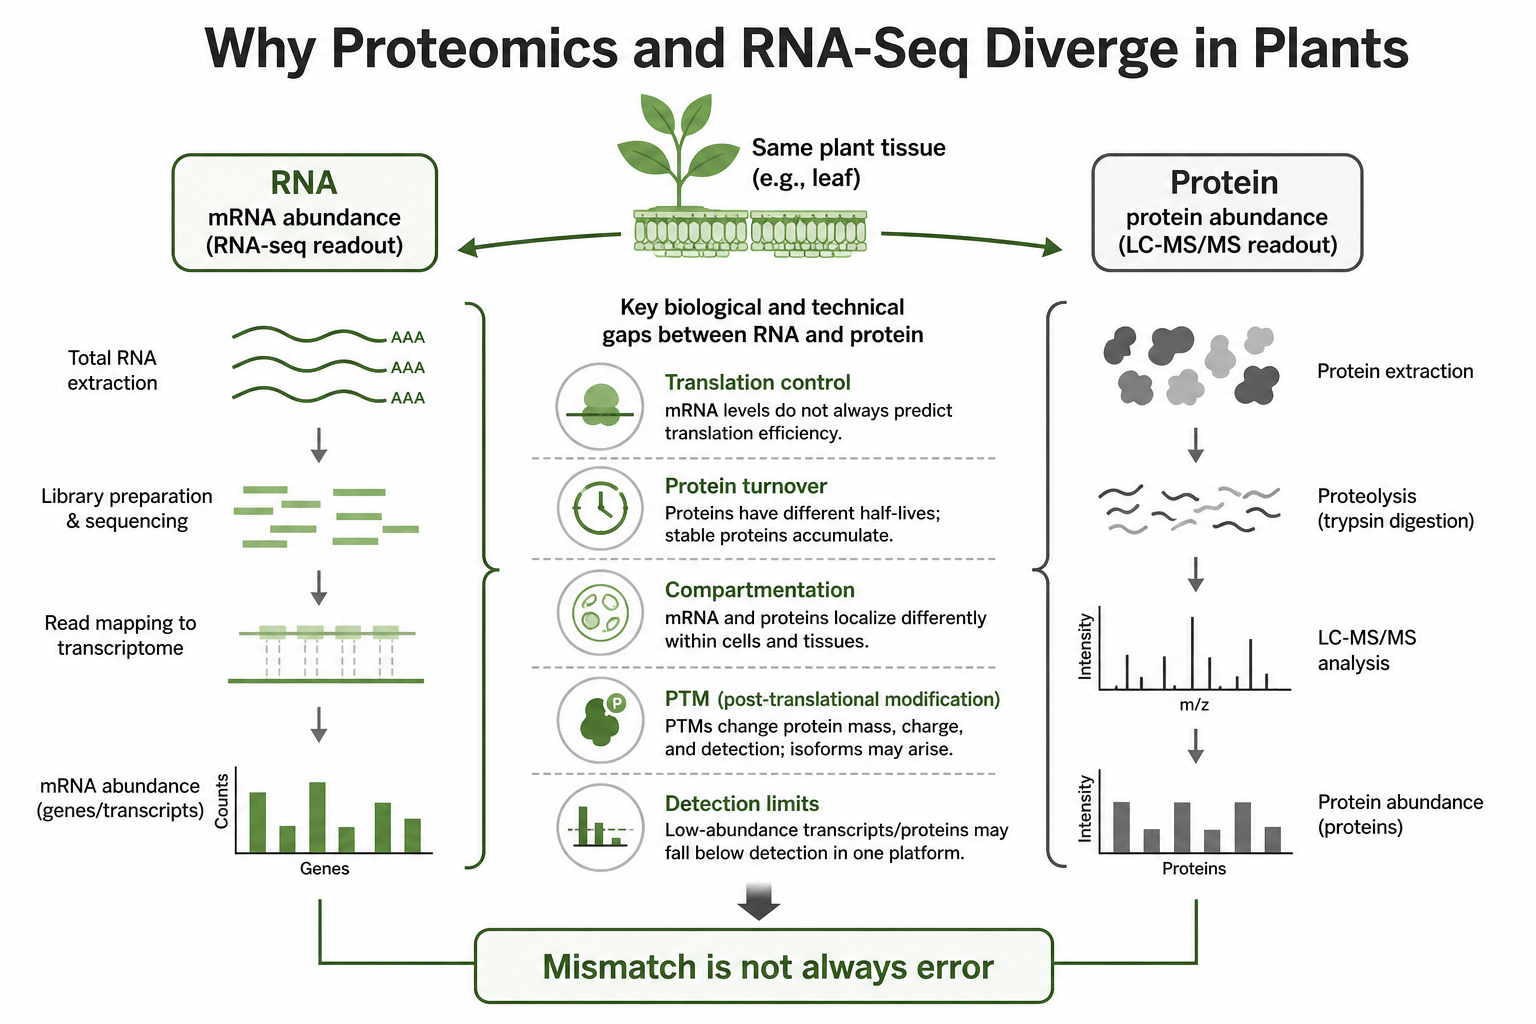
Figure 1. Translation, turnover, compartmentation, and design mismatch can all separate RNA abundance from protein abundance in plant studies.
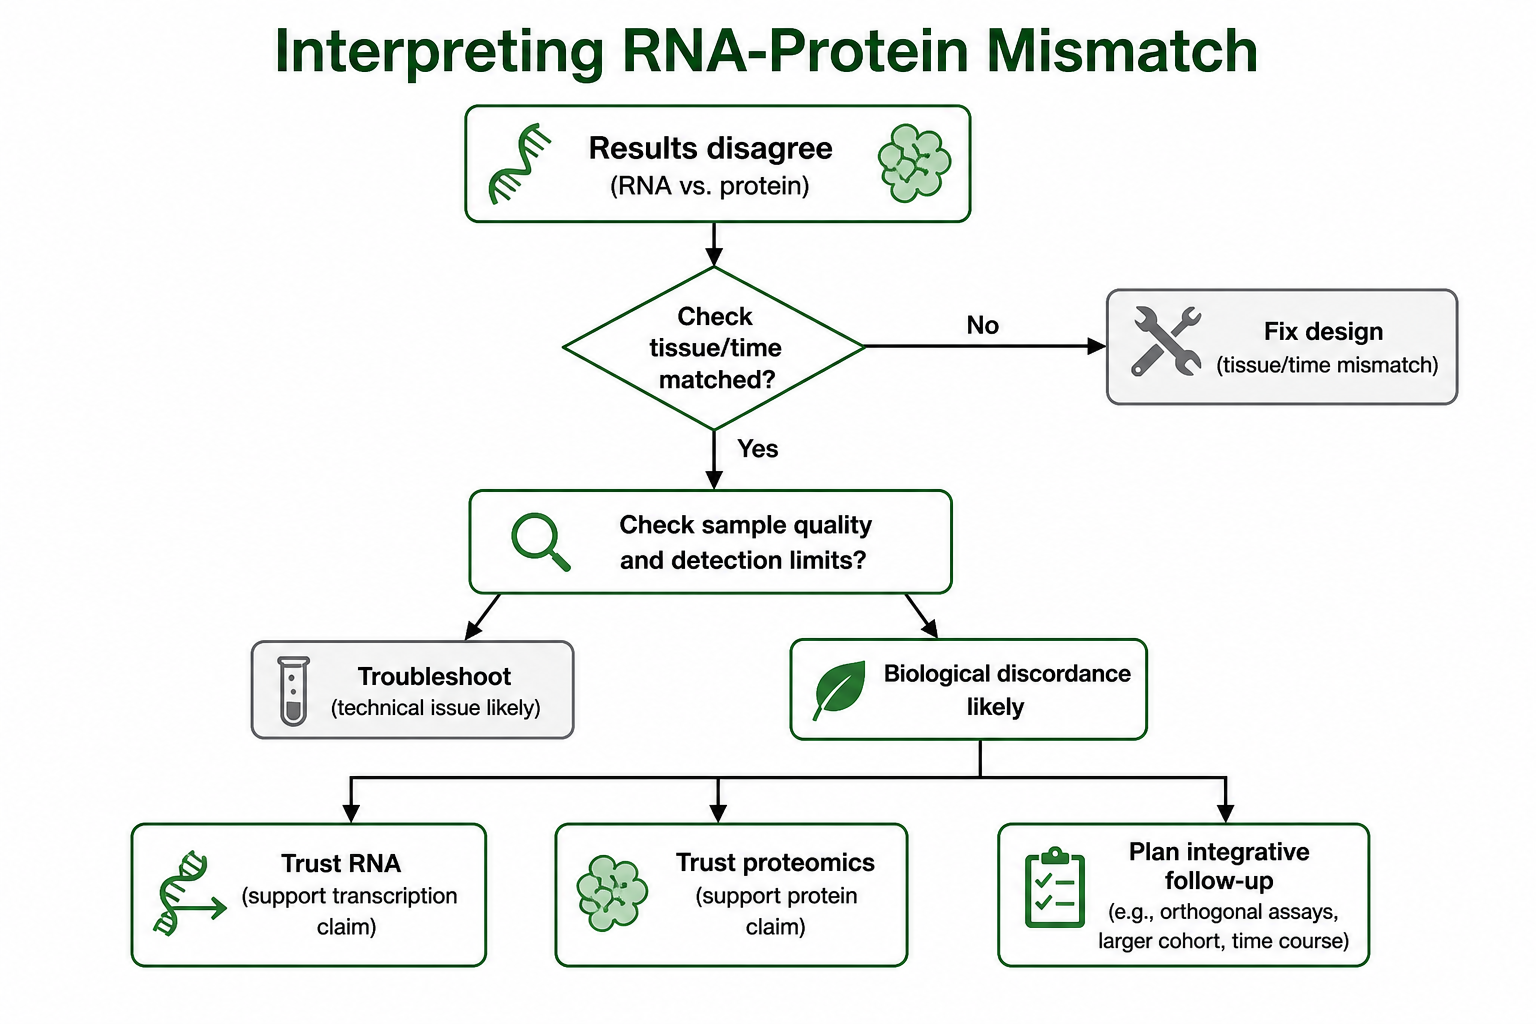
Figure 2. Confirm matched design before treating discordance as platform error or as biological confirmation.
How to order?




