


What Is Protein-Protein Interaction (PPI) Network Visualization? Recommended Tools and Software
- Identification of key regulatory nodes within signaling pathways
- Detection of disease-associated functional modules
- Construction of tissue- or disease-specific protein interaction network maps
- Integration of multi-omics data to identify potential therapeutic targets
- ClueGO: pathway enrichment analysis
- MCODE: module detection
- cytoHubba: hub gene identification
Protein-protein interaction (PPI) networks represent a fundamental analytical framework for elucidating cellular functions, signaling pathway regulation, and disease mechanisms. Protein-protein interaction visualization involves the graphical representation of complex interaction relationships, enabling researchers to intuitively identify key proteins, functional modules, and network topological features, thereby facilitating biological interpretation and discovery.
What Is Protein-Protein Interaction Visualization?
Protein-protein interaction visualization refers to the representation of physical or functional associations among proteins in the form of maps or network diagrams. These networks are typically composed of nodes, representing proteins, and edges, representing interactions between them.
1. Biological Significance and Applications
For instance, in tumor tissues, aberrant protein interactions may give rise to novel regulatory modules that influence cell proliferation or immune evasion. Visualization of PPI networks enables researchers to rapidly identify such abnormal network structures.
Commonly Used Protein-Protein Interaction Visualization Databases and Tools
The following tools and databases are widely employed by researchers in proteomics and systems biology for PPI visualization and analysis:
1. STRING
(1) Integrated PPI database with network visualization and multi-species support.
(2) Provides known and predicted PPI information covering more than 2,000 species.
(3) Allows users to input gene or protein names to automatically generate interactive network visualizations.
(4) Supports pathway enrichment analysis and functional annotation.
(5) Seamlessly integrates with Cytoscape, facilitating downstream customized analyses.
2. Cytoscape
(1) Open-source platform for network visualization with extensive plugin support.
(2) One of the most widely used visualization platforms in network biology.
(3) Enables interactive exploration and layout optimization of large-scale PPI networks.
(4) Supports integration of numerous plugins, including:
(5) Allows the import of user-defined datasets, such as quantitative proteomics data and differential expression results
Suitable for advanced users, Cytoscape supports modular construction and visualization tailored to complex experimental designs.
3. NAViGaTOR (Network Analysis, Visualization & Graphing Toronto)
(1) Designed for large-scale network rendering with support for 3D visualization.
(2) Capable of visualizing ultra-large networks containing millions of nodes and edges.
(3) Provides both 2D and 3D network visualization, making it suitable for presentations and educational purposes.
(4) Supports multi-level network filtering and annotation of node and edge attributes.
NAViGaTOR requires substantial graphical computing resources and is therefore less suitable for lightweight tasks; however, it demonstrates strong performance in visualizing large-scale protein interaction networks.
4. Gephi
(1) Provides graph-theoretical analysis and computation of network topology parameters.
(2) Although not specifically developed for biological applications, it is well suited for topological analysis of PPI networks, including metrics such as degree centrality and clustering coefficient.
(3) Offers highly flexible layout customization and supports generation of publication-quality figures.
(4) Commonly used for gaining insights into network structure and identifying key nodes.
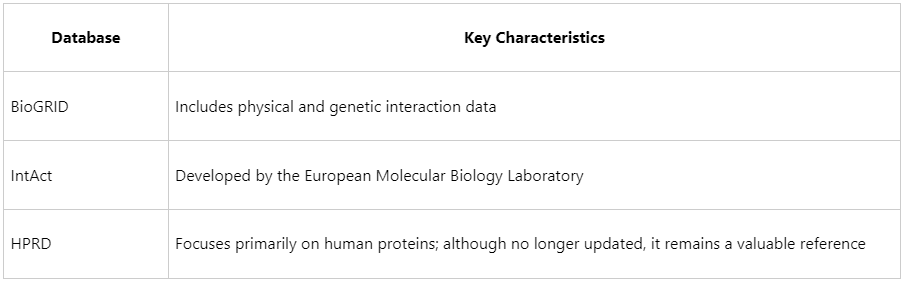
5. BioGRID, IntAct, HPRD, and Other PPI Databases
Although these databases do not offer advanced visualization capabilities, they are frequently used to obtain high-confidence protein interaction data, which can subsequently be integrated into platforms such as Cytoscape for in-depth visualization and analysis.
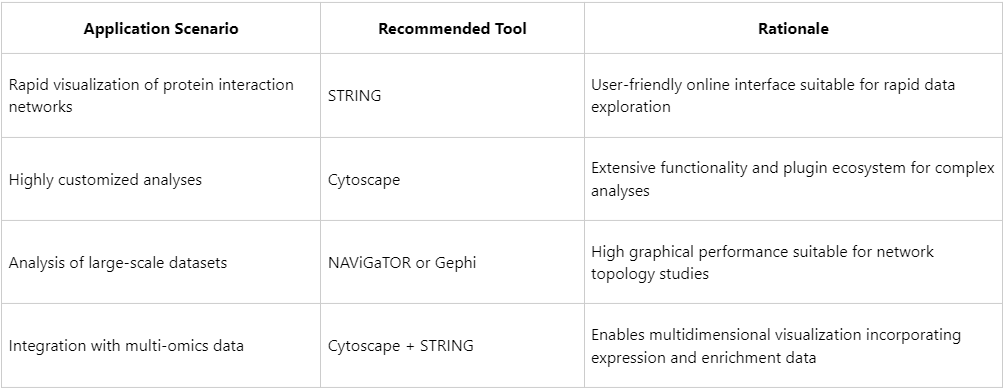
How to Select Appropriate Protein-Protein Interaction Visualization Tools?
Advancing from PPI Visualization to In-Depth Biological Interpretation
Visualization represents an initial step in PPI analysis; the extraction of biologically meaningful insights is of greater importance. Common integrative analytical strategies include:
(1) Differential protein identification combined with PPI network construction to detect regulatory modules
(2) Hub protein identification coupled with functional enrichment analysis to identify core regulatory factors
(3) Integration of clinical data to construct prognosis-associated protein interaction networks
At MtoZ Biolabs, we provide comprehensive proteomics data analysis services, integrating PPI network construction, enrichment analysis, and scientific visualization to support research workflows from raw data processing to biological discovery.
Protein-protein interaction visualization has become an indispensable analytical approach in life sciences research. Appropriate tool selection not only enhances research efficiency but also facilitates the identification of key regulatory principles underlying complex biological systems. For projects involving proteomics data integration, interaction network construction, or functional annotation, researchers are encouraged to collaborate with MtoZ Biolabs to obtain customized, high-quality PPI network analysis and scientific visualization solutions that support advanced research outcomes.
MtoZ Biolabs, an integrated chromatography and mass spectrometry (MS) services provider.
Related Services
How to order?

