



Proteomics from quantification to functional insights only works when a defensible quantitative matrix comes first. Pathway maps, gene ontology summaries, and protein-protein interaction views interpret contrasts that already passed sample, acquisition, and matrix quality checks (Bantscheff et al. 2012). The guide below is a comprehensive map from LC-MS/MS quantification to bounded functional follow-up. It is not a structural biology catalog, not a clinical diagnostics promise, and not a second method-definition encyclopedia.
Functional insight still depends on labeling chemistry, acquisition mode, and claim type chosen upstream. Unlabeled digests can be acquired as data-dependent acquisition (DDA) or data-independent acquisition (DIA). Isobaric tandem mass tag (TMT) work reads relative reporters after mixing. Named proteins are typically followed by parallel reaction monitoring (PRM) or multiple reaction monitoring (MRM) / selected reaction monitoring (SRM). In MtoZ Biolabs offerings, unlabeled discovery is commonly run as DDA label-free or DIA, multiplexed isobaric work is typically evaluated as TMT, and closed lists are typically followed by PRM, with MRM when a scheduled triple-quadrupole panel already exists.
What Must Be True Before Functional Interpretation Starts
Functional layers answer a different question than quantification. Quantification asks how peptide signals change between predefined groups. Functional interpretation asks which annotations or networks are over-represented among proteins that already passed contrast and quality rules.
Three prerequisites usually gate insight work.
A declared contrast. Treatment, genotype, time, or dose groups must be fixed before acquisition. Post hoc regrouping of files turns enrichment into a fishing exercise.
A quantitative object with rules. MS1 areas, DIA fragment traces, TMT reporters, or targeted peaks must be extracted under stated false discovery rate (FDR) and missing-value policies (Cox et al. 2014; Gillet et al. 2012).
A quality-checked matrix. Batch effects, load bias, and run-order confounding must be reviewed before pathways are drawn. Enrichment cannot unmix biology from design failure (Lazar et al. 2016).
Functional insight is downstream interpretation of a quantitative contrast, not a substitute for matched quantification design.
Researchers who need signal-type definitions before insight planning can refer to What Are the Quantitative Methods for Proteomics?.
Quantitative Routes That Feed Insight-Ready Matrices
Open discovery returns many proteins with relative intensities per group. Unlabeled label-free quantification (LFQ) and unlabeled DIA fit open lists and separate injections when enrollment may still grow.
Multiplexed relative designs freeze several arms into one run. TMT fits when channel maps are written before mixing (Thompson et al. 2003). Insight steps still use the same contrast declared at labeling.
Targeted confirmation remeasures a closed peptide list when decisions depend on named proteins (Lange et al. 2008; Peterson et al. 2012). Stable isotope-labeled internal standard (SIS) peptides support amount claims on those targets only when calibration is declared (Gerber et al. 2003).
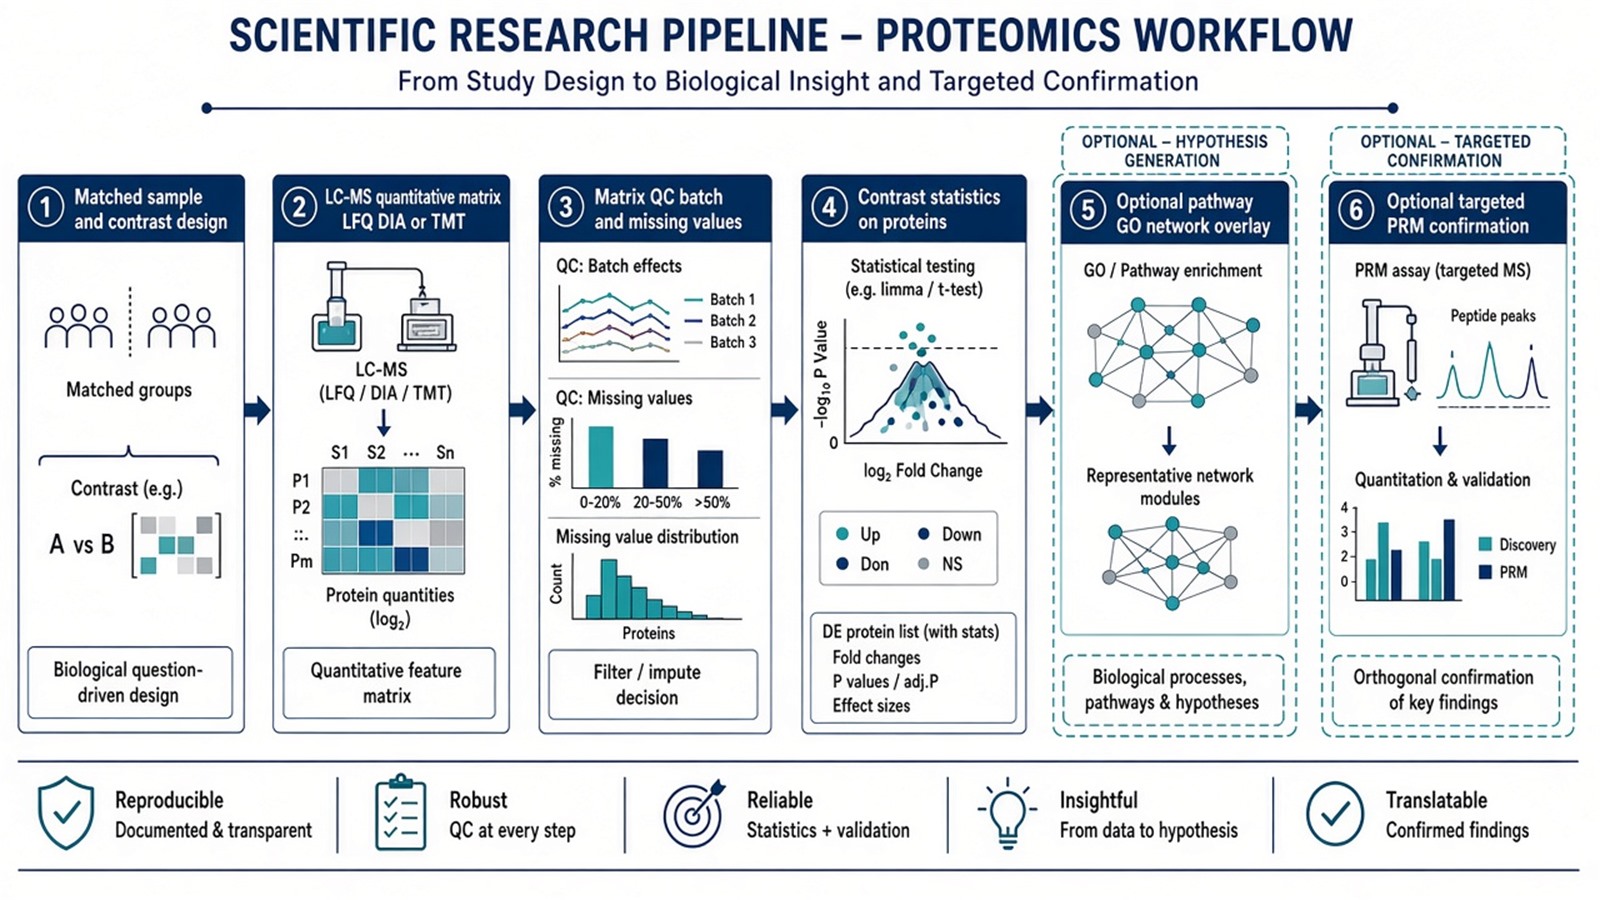
Figure 1. Functional insight sits after a quality-checked quantitative matrix; targeted confirmation follows when names must be remeasured.
A cross-route technique map is covered in Quantitative Proteomics Techniques. This page stays on how quant outputs connect to interpretation choices.
Shared Workflow From Contrast Design to Candidate Context
A practical quant-to-insight spine usually runs as follows.
- Confirm matrix, contrast, and relative versus SIS amount claim.
- Prepare matched digests and acquire under one declared quantitative route.
- Build the protein matrix with FDR, unique-peptide, normalization, and missing-value rules.
- Test the predefined contrast and document failed features or batch flags.
- Optionally rank proteins for follow-up using the same contrast statistics.
- Run pathway, ontology, or network overlays only on the reviewed list.
- Freeze short lists for targeted remeasurement or orthogonal assays when decisions require it.
Where projects stop depends on the decision. Some teams end at step 4 with a relative table and figure set. Others add step 6 for hypothesis generation. Fewer projects need step 7 when discovery statistics already match a closed panel size.
Order matters. Running enrichment on an unfiltered identification list inflates annotation hits. Skipping quant QC and jumping to network graphics creates plausible stories from unstable intensities.
Parameters and Limits on Functional Claims
Stage |
Parameter that must be declared |
Failure mode if ignored |
|---|---|---|
Quant design |
Contrast and replicate structure |
Post hoc pathway fishing |
Matrix QC |
Batch and missing-value review |
Enrichment on artifact lists |
Statistics |
FDR and effect-size rules on proteins |
Every identified protein treated as changed |
Enrichment |
Background list and ontology version |
Inflated pathway p-values |
Networks |
Edge evidence and list input |
Hairball graphs without contrast link |
Follow-up |
Targeted or orthogonal plan |
Pathway arrows treated as mechanism proof |
Limits follow the same table. Pathway enrichment suggests shared annotation among changed proteins. It does not prove causal direction, drug target validity, or clinical utility. Protein-protein interaction databases summarize prior evidence. They do not replace measured binding in the study system. Multi-omic overlay can align protein ratios with transcript or metabolite layers. It does not make units interchangeable.
Functional language such as mechanism, target, or biomarker only holds when the quantitative layer supports the predefined groups. Discovery candidates are not validated biomarkers without a separate confirmation design. Drug target lists from one contrast remain hypotheses until orthogonal evidence is planned.
Researchers who need application framing for disease or drug contrasts can refer to Quantitative Proteomics in Disease and Drug Discovery. For unlabeled matrix construction details, see A Guide to Label-Free Quantitative Proteomics: From Experiment to Data Analysis.
How to Choose Quantification Depth and Insight Steps
Use list status, decision type, and claim unit together.
Project need |
Quant and insight plan that often fits |
Recheck before committing |
|---|---|---|
Open inventory with one group contrast |
Unlabeled DDA or DIA matrix, then optional enrichment |
Enrichment before QC |
Freezable multi-arm panel |
TMT relative matrix, then same contrast overlays |
Pathway on full ID list |
Short list for a go or no-go decision |
Targeted PRM or MRM after names freeze |
Open discovery stats only |
Amount on named targets |
SIS-supported targeted assay |
Pathway map as concentration proof |
Hypothesis generation only |
Relative matrix plus ontology overlay |
Mechanism claim without follow-up |
Regulatory or transfer decision |
Quant matrix plus targeted validation plan |
Discovery enrichment alone |
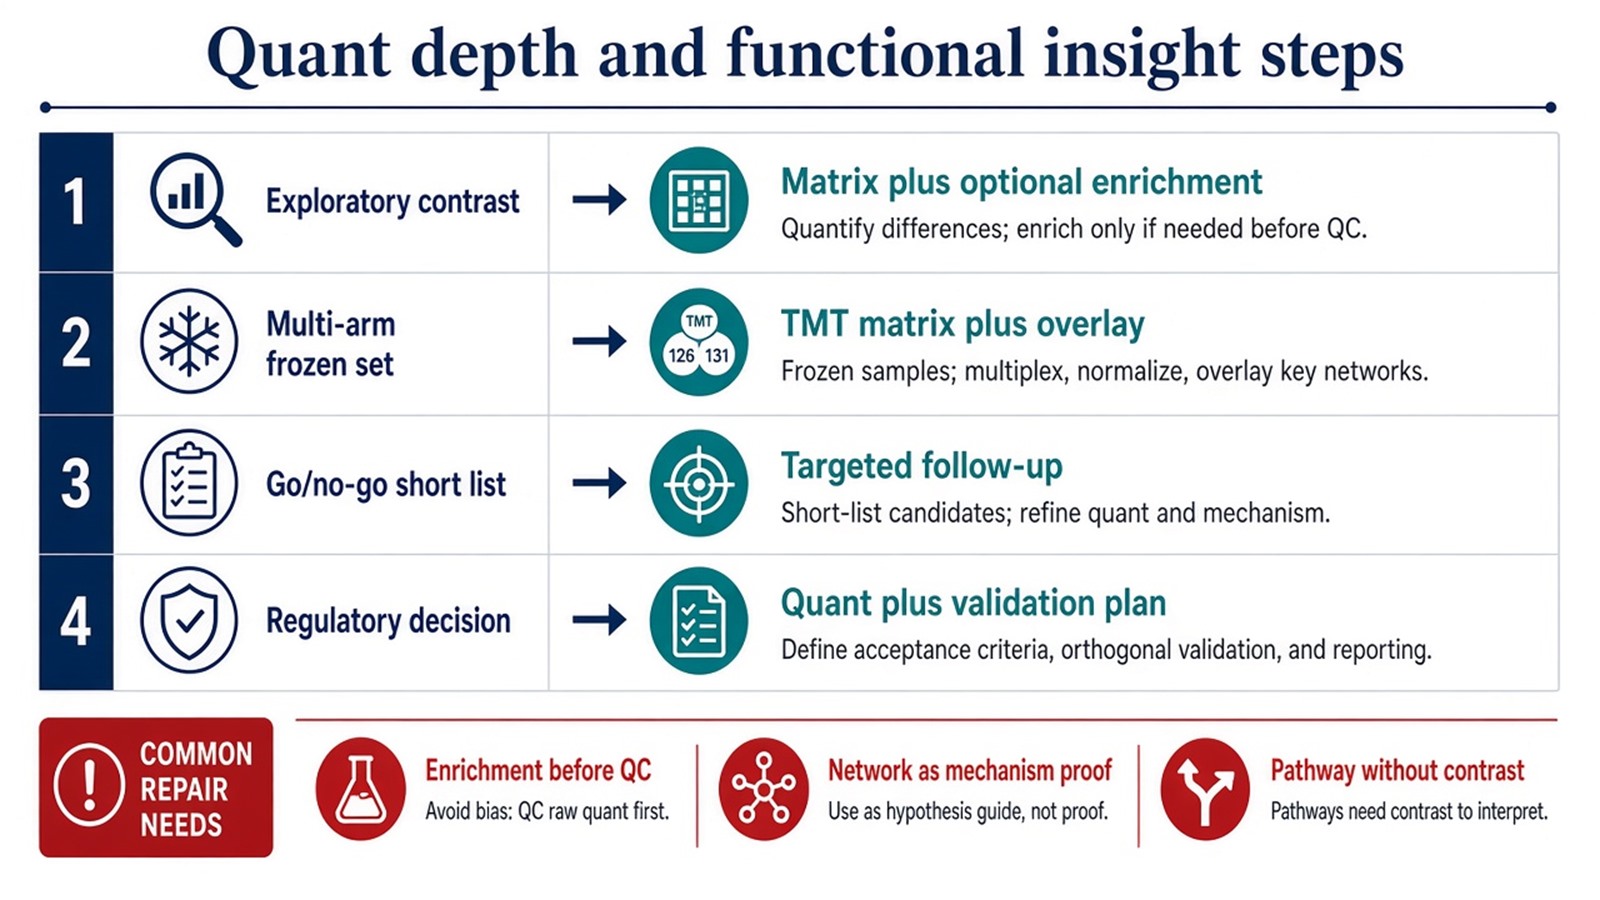
Figure 2. Match insight depth to the decision: QC and contrast first, enrichment optional, targeted confirmation when names must hold.
Open unlabeled quantification more often fits exploratory insight on growing cohorts. TMT more often fits multi-arm contrasts that were frozen at labeling. Targeted confirmation more often fits when functional stories must collapse to a short measured list. Exceptions exist when a tiny panel never needed open discovery, or when enrichment is explicitly exploratory on a pilot only.
Researchers who need three-axis route selection before insight work can refer to Protein Quantification Method. Teams that already have contrast, matrix type, and follow-up goal can also review the MtoZ Biolabs Quantitative Proteomics Service for project-specific quant-to-insight planning.
Frequently Asked Questions
1. Can pathway enrichment replace quantitative quality control?
No. Enrichment interprets a protein list. It cannot repair batch effects, missingness, or undefined contrasts.
2. Does a large identification list automatically support functional insight?
No. Insight steps need a contrast-tested subset or explicit rules for which proteins enter enrichment. Untested IDs inflate pathway hits.
3. When should targeted methods follow discovery quantification?
When names freeze and the next decision needs scheduled remeasurement or an SIS amount on a closed list.
4. Are network graphs proof of protein interaction in my samples?
No. Database networks summarize prior reports. Measured interaction or targeted confirmation is a separate claim.
5. Is absolute quantification required before functional interpretation?
No. Most insight workflows start from defensible relative contrasts. Amount claims need SIS-supported assays on named peptides.
MtoZ Biolabs can support quantitative proteomics workflows from unlabeled DDA or DIA discovery and TMT relative plexes through optional interpretation planning and targeted PRM or MRM follow-up when sample type, study design, and the intended claim are available.
If further evaluation of matrix QC before enrichment, contrast design, or confirmation after discovery is needed, project details can be submitted for a feasibility review.
Reference
- M. Bantscheff, S. Lemeer, M.M. Savitski, B. Kuster (2012). Quantitative mass spectrometry in proteomics: critical review update from 2007 to the present. Anal. Bioanal. Chem., 404, 939-965. https://doi.org/10.1007/s00216-012-6203-4
- J. Cox, M.Y. Hein, C.A. Luber, I. Paron, M. Mann (2014). Accurate proteome-wide label-free quantification by delayed normalization and maximal peptide ratio extraction, termed MaxLFQ. Mol. Cell. Proteomics, 13, 2513-2526. https://doi.org/10.1074/mcp.M113.031031
- S.A. Gerber, J. Rush, O. Stemman, M.W. Kirschner, S.P. Gygi (2003). Absolute quantification of proteins and phosphoproteins from cell lysates by tandem MS. Proc. Natl. Acad. Sci. U.S.A., 100, 6940-6945. https://doi.org/10.1073/pnas.0832254100
- L.C. Gillet, P. Navarro, S. Tate, H. Rost, N. Selevsek, L. Reiter, R. Bonner, R. Aebersold (2012). Targeted data extraction of the MS/MS spectra generated by data-independent acquisition: a new concept for consistent and accurate proteome analysis. Mol. Cell. Proteomics, 11, O111.016717. https://doi.org/10.1074/mcp.O111.016717
- V. Lange, P. Picotti, B. Domon, R. Aebersold (2008). Selected reaction monitoring for quantitative proteomics: a tutorial. Mol. Syst. Biol., 4, 222. https://doi.org/10.1038/msb.2008.61
- C. Lazar, L. Gatto, M. Ferro, C. Bruley, T. Burger (2016). Accounting for the multiple natures of missing values in label-free quantitative proteomics data sets to compare imputation strategies. J. Proteome Res., 15, 1116-1125. https://doi.org/10.1021/acs.jproteome.5b00981
- A.C. Peterson, J.D. Russell, D.J. Bailey, M.S. Westphall, J.J. Coon (2012). Parallel reaction monitoring for high resolution and high mass accuracy quantitative, targeted proteomics. Mol. Cell. Proteomics, 11, 1475-1488. https://doi.org/10.1074/mcp.O111.013698
- A. Thompson, J. Schafer, K. Kuhn, S. Kienle, J. Schwarz, G. Schmidt, T. Neumann, R. Johnstone, A.K. Mohammed, C. Hamon (2003). Tandem mass tags: a novel quantification strategy for comparative analysis of complex protein mixtures by MS/MS. Anal. Chem., 75, 1895-1904. https://doi.org/10.1021/ac0262560
