






Plant Proteomics for Nutrient Deficiency and Fertilizer Response Studies
Plant proteomics for nutrient deficiency and fertilizer response studies compares protein abundance between defined nutrition treatments—such as nitrogen-limited versus replete plants, low-phosphorus versus control root systems, or graded fertilizer doses—after matched sample preparation and LC-MS/MS quantification. It helps reveal candidate transport, uptake, and metabolic remodeling proteins linked to the nutrition contrast, not direct proof of tissue nutrient concentration or field yield response.
The useful output is a treatment-matched set of candidate proteins and pathway themes for the sampled organ and harvest window. Elemental analysis, ion content, or growth measurements still define whether deficiency or fertilizer response was actually achieved.
If you are planning plant proteomics for nutrient deficiency or fertilizer response work, share the nutrient treatment, sampled tissue, deficiency severity or dose level, and comparison design with MtoZ Biolabs while the nutrition protocol is still open.
What Nutrient-Related Plant Proteomics Can Reveal
Quantitative plant proteomics under nutrition contrasts can highlight:
-
Protein abundance shifts linked to low or excess supply of nitrogen, phosphorus, potassium, or other defined treatments
-
Genotype-dependent differences in response to the same fertilizer regime
-
Remodeling themes in transport, primary metabolism, photosynthesis-related processes, or stress-adjacent adjustment when supported by annotation
-
Time-dependent responses when harvest windows are defined separately
Standard analysis may include differential screening, functional annotation, GO and KEGG pathway views, protein interaction context, and Reactome analysis when the species is supported.
Plant proteomics for nutrition studies does not by itself:
-
Measure tissue nutrient concentration or fertilizer use efficiency
-
Replace soil or hydroponic chemistry monitoring
-
Prove which transporter or enzyme controls uptake without follow-up validation
-
Predict agronomic fertilizer recommendations from one controlled treatment alone
Results should be read as candidate proteins and pathway priorities tied to the nutrition contrast until phenotype, ion data, and replicate behavior support stronger claims.
Deficiency Studies vs Fertilizer Response Studies
Nutrition projects use different comparison logic even when the same crop is studied.
Deficiency-focused designs compare low-nutrient or withheld-nutrient conditions against a defined control under otherwise matched growth. The claim is usually about adaptation to shortage, early stress signaling, or remobilization in the sampled tissue.
Fertilizer response designs compare graded fertilizer doses, recovery after re-supply, or variety responses to the same application protocol. The claim is often about dose-dependent remodeling or line-specific utilization rather than severe deficiency damage alone.
| Study Focus | Typical Comparison | Tissue Often Sampled First | Interpretation Emphasis |
| Nitrogen deficiency | Low N vs control at matched stage | Leaf for canopy response; root for uptake remodeling | Photosynthesis and transport in leaf; uptake-related adjustment in root |
| Phosphorus deficiency | Low P vs control | Root or leaf depending on the question | Transport and membrane remodeling; root may capture early responses |
| Potassium deficiency | Low K vs control | Leaf for visible growth-related phenotypes | Transport and stress-related adjustment |
| Fertilizer dose response | Low, medium, and high doses under one protocol | Organ tied to the measured response | Dose-linked abundance trends across matched replicates |
| Re-supply after deficiency | Re-fertilized vs continued-deficient plants | Same organ across time points | Recovery responses analyzed by separate harvest windows |
| Genotype by nutrition | Two lines under the same nutrient treatment | Organ matching the biological question | Genotype response under comparable nutrition severity |
These rows are planning examples, not rules for every species or growth system.
Match Nutrition Treatments Across Compared Groups
Nutrition comparisons fail when treatment labels are vague or chemistry drifts between experimental units.
Define before harvest:
-
Nutrient omitted or reduced, or fertilizer dose applied
-
Delivery method such as hydroponic solution change, soil treatment, or foliar application
-
Duration of deficiency or time after fertilizer application
-
Developmental stage at treatment start and harvest
-
Sampled organ and tissue position
-
Growth medium, pot size, pH where relevant, and watering schedule
Record phenotype and chemistry context at harvest when available:
-
Visible chlorosis, stunting, or necrosis score
-
Measured ion or element data if collected
-
Biomass or growth reduction notes
-
Solution or soil test result tied to the harvest date
Match non-nutrition factors across groups, including light, temperature, planting date, and genotype background. Sensitive genotypes may show stronger deficiency symptoms earlier at the same nominal treatment time. Phenotype notes help distinguish treatment biology from unequal injury stages.
Planning examples for tissue collection in standard plant proteomics projects include:
-
Soft tissues such as leaves, flowers, grasses, algae, ferns, or fleshy fungal tissue: approximately 2 g per biological replicate as a recommended collection amount
-
Hard tissues such as roots, bark, twigs, fruits, or seeds: approximately 5 g per biological replicate as a recommended collection amount
-
Pollen: approximately 100 mg per biological replicate as a recommended collection amount
These are recommended collection amounts rather than fixed minimum requirements. Project-specific requirements should be confirmed before submission. Degraded, contaminated, or repeatedly freeze-thawed material is not recommended, and infectious plant material cannot be accepted.
Independent biological replicates should represent independently treated experimental units, such as separate pots, hydroponic vessels, or field plots. Individual plants count as independent replicates only when treatment is applied independently.
Tissue and Time Point Choices in Nutrition Proteomics
Organ choice shapes which nutrition response the proteome reflects.
Root proteomics often fits uptake limitation, root-zone deficiency exposure, and early responses before strong shoot symptoms appear. Leaf proteomics often fits canopy chlorosis, photosynthesis-related remodeling, and visible deficiency scoring. Seed or grain may fit quality or storage-protein responses when nutrition affects filling.
Do not mix root and leaf in one treatment-versus-control group without explicit design intent. Parallel organ sampling from the same replicate set is valid when the question compares organ coordination under one nutrition protocol.
Harvest timing matters because deficiency and fertilizer responses unfold over time. Early sampling may capture signaling and transport adjustment, whereas later sampling may reflect established remodeling or damage-associated changes. Separate time-point groups rather than pooling early and late samples in one nutrition arm.
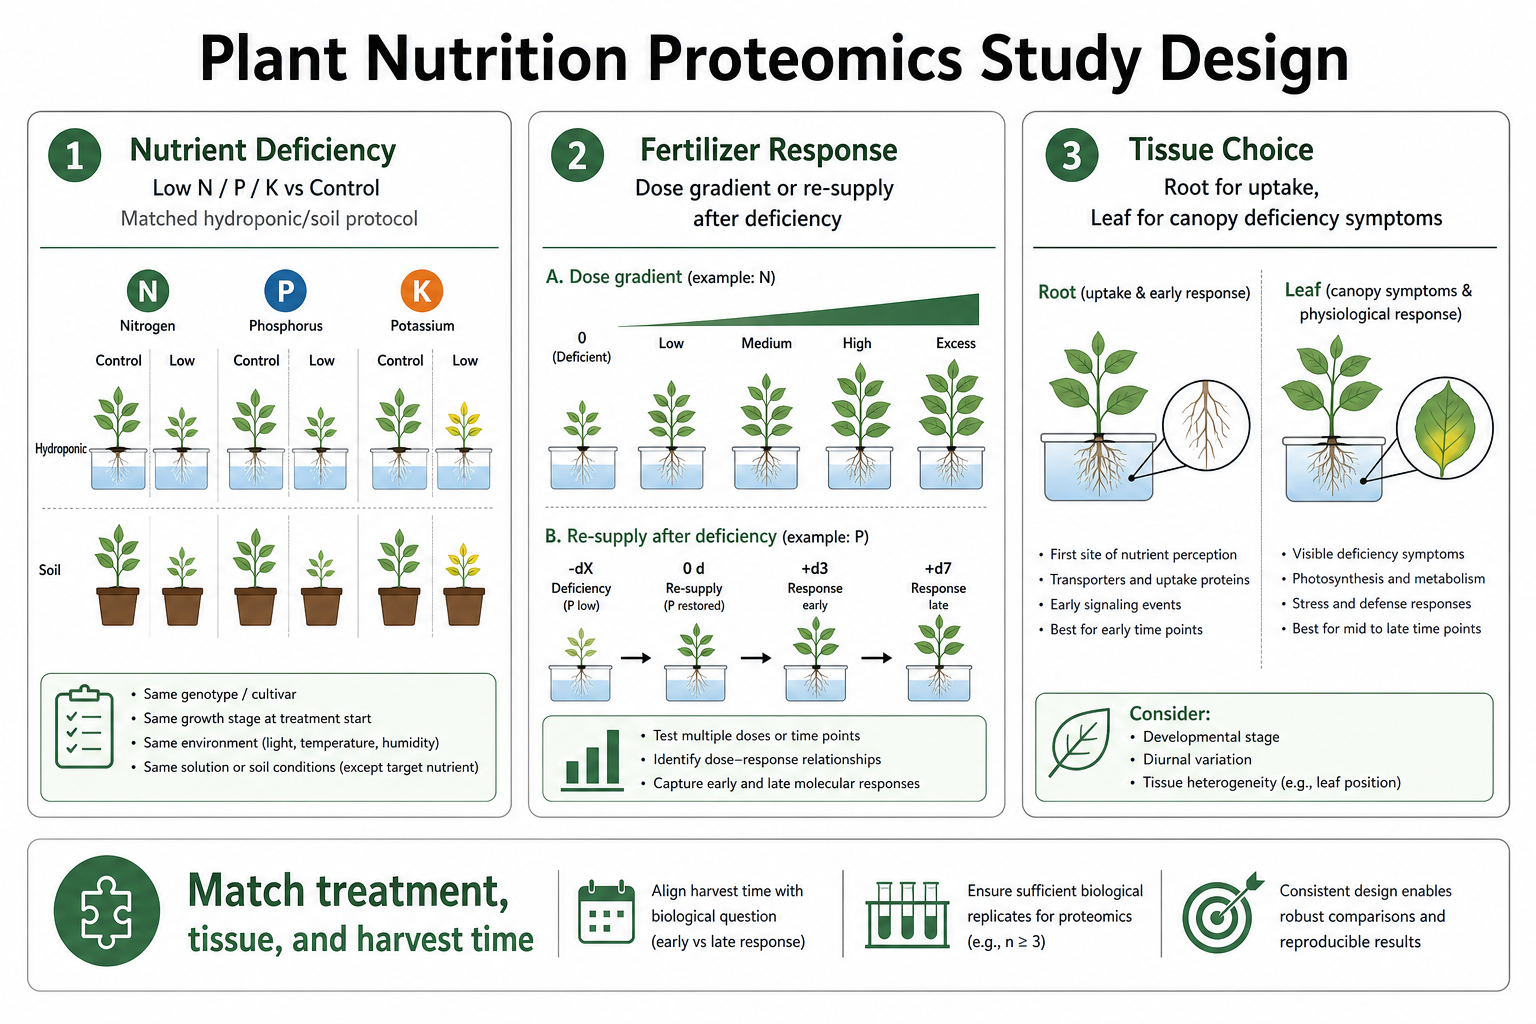
Figure 1. Plant Nutrition Proteomics Study Design
From Differential Proteins to Nutrition-Linked Pathway Themes
After LC-MS/MS and quantitative comparison, interpret proteins against the nutrition record and sampled organ.
Prioritize proteins with:
-
Direction consistency across biological replicates in the same organ and time window
-
Alignment with deficiency score, growth response, or fertilizer dose at harvest
-
Annotation support in transport, metabolism, or related response processes when present in the dataset
-
Stable detection across most samples in the group
Use GO, KEGG, PPI, and Reactome views to organize candidates when the species is supported. Enriched metabolism or transport themes can support hypothesis formation. They do not prove a nutrient transport mechanism or fertilizer recommendation by themselves.
Cross-check against chemistry or phenotype data when available:
-
Agreement between proteomic changes and phenotype or nutrient measurements can strengthen interpretation when biologically expected
-
Discordant results should be evaluated in the context of tissue, timing, nutrient homeostasis, and treatment severity rather than automatically deprioritized
-
Proteins appearing mainly in severely damaged tissue may reflect tissue injury rather than adaptive deficiency responses
-
Fertilizer response proteins should be interpreted at the dose and time point where the response was measured
When ion or element measurements are part of the study, keep proteomics interpretation separate from chemistry claims unless both support the same contrast.
Analytical Workflow Options
Once the nutrition protocol, organ, and groups are stable, choose the workflow according to the quantitative goal and study design.
Quantitative comparison is required when the project depends on abundance differences between deficiency, control, or fertilizer-dose groups. Identification-first work may fit early feasibility checks in a new crop or tissue.
Workflow options include:
-
DDA for discovery-oriented and quantitative workflows across different study sizes
-
DIA when consistent quantitative comparison and reduced missing measurements across matched samples are important
The final acquisition strategy should consider study design, sample complexity, quantitative goals, and platform availability.
Plant proteomics service scope typically includes protein extraction or purification, enzymatic digestion, LC-MS/MS analysis, and bioinformatics reporting. Standalone gel imaging or similar preparation-only work is generally outside this workflow.
Related Services
Plant Nutrient Metabolomics Analysis Services
Frequently Asked Questions
1. Can plant proteomics measure nitrogen or phosphorus levels in tissue?
No. Proteomics reports protein abundance patterns. Element or ion concentration requires separate analytical measurement.
2. Which tissue is best for nutrient deficiency proteomics?
Root fits uptake and root-zone deficiency questions. Leaf fits canopy deficiency symptoms and photosynthesis-related remodeling. Match the tissue to the biological question.
3. Can fertilizer dose response be studied with quantitative proteomics?
Yes, when dose groups are defined, independently replicated, and harvested under a matched protocol with phenotype or chemistry records where available.
4. Should deficient and re-fertilized plants be in one group?
No when the goal is to distinguish deficiency from recovery. Use separate groups for deficiency and re-supply harvest windows.
5. Do differential proteins prove a fertilizer recommendation?
No. They are candidate proteins linked to the tested contrast until validation and field context support stronger conclusions.
6. What should be shared before starting a nutrition proteomics project?
Share species, nutrient treatment, tissue type, harvest timing, group design, phenotype or chemistry records, and planned biological replicates.
Conclusion
Plant proteomics for nutrient deficiency and fertilizer response studies supports candidate protein and pathway review when nutrition treatment, tissue choice, and harvest timing are matched to the biological question. Proteomics complements—but does not replace—element analysis and growth phenotyping in nutrition research.
To plan a nutrition-related proteomics comparison before harvest, contact MtoZ Biolabs with the treatment protocol, tissue choice, and comparison the study must support.
How to order?




