






How to Compare Plant Varieties Using Quantitative Proteomics
Quantitative plant proteomics compares protein abundance between defined variety or line groups after matched sample preparation, digestion, and LC-MS/MS. It fits breeding, germplasm, and trait studies when the decision depends on whether Variety A and Variety B differ in protein levels—not merely on whether the same proteins can be detected in both.
A defensible variety comparison requires matched tissue, developmental stage, environment, and biological replication. Without those anchors, abundance differences can reflect harvest timing or handling rather than variety biology.
If you are planning a quantitative proteomics comparison across plant varieties, share line names, trait or treatment context, tissue type, replicate plan, and expected readout with MtoZ Biolabs while the comparison design is still open.
When Quantitative Comparison Is Required for Variety Studies
Identification-only proteomics asks which proteins are present in a sample. Quantitative comparison asks which proteins differ in abundance between predefined groups.
Choose quantitative proteomics for variety work when:
-
The claim compares elite versus baseline lines, tolerant versus sensitive cultivars, or quality-high versus quality-low materials
-
Breeding or trait decisions depend on direction and stability of abundance shifts
-
Stress, treatment, or developmental context is matched across varieties and abundance change is the readout
-
Follow-up prioritization needs a ranked differential list rather than a presence table alone
Identification-first work may fit early feasibility checks in a new tissue or crop, but variety decisions usually need quantitative comparison once the contrast is stable.
Standard plant proteomics reporting may include differential screening, GO and KEGG pathway views, protein interaction context, and Reactome analysis when the species is supported. Results are candidate proteins linked to the variety contrast until validation supports stronger claims.
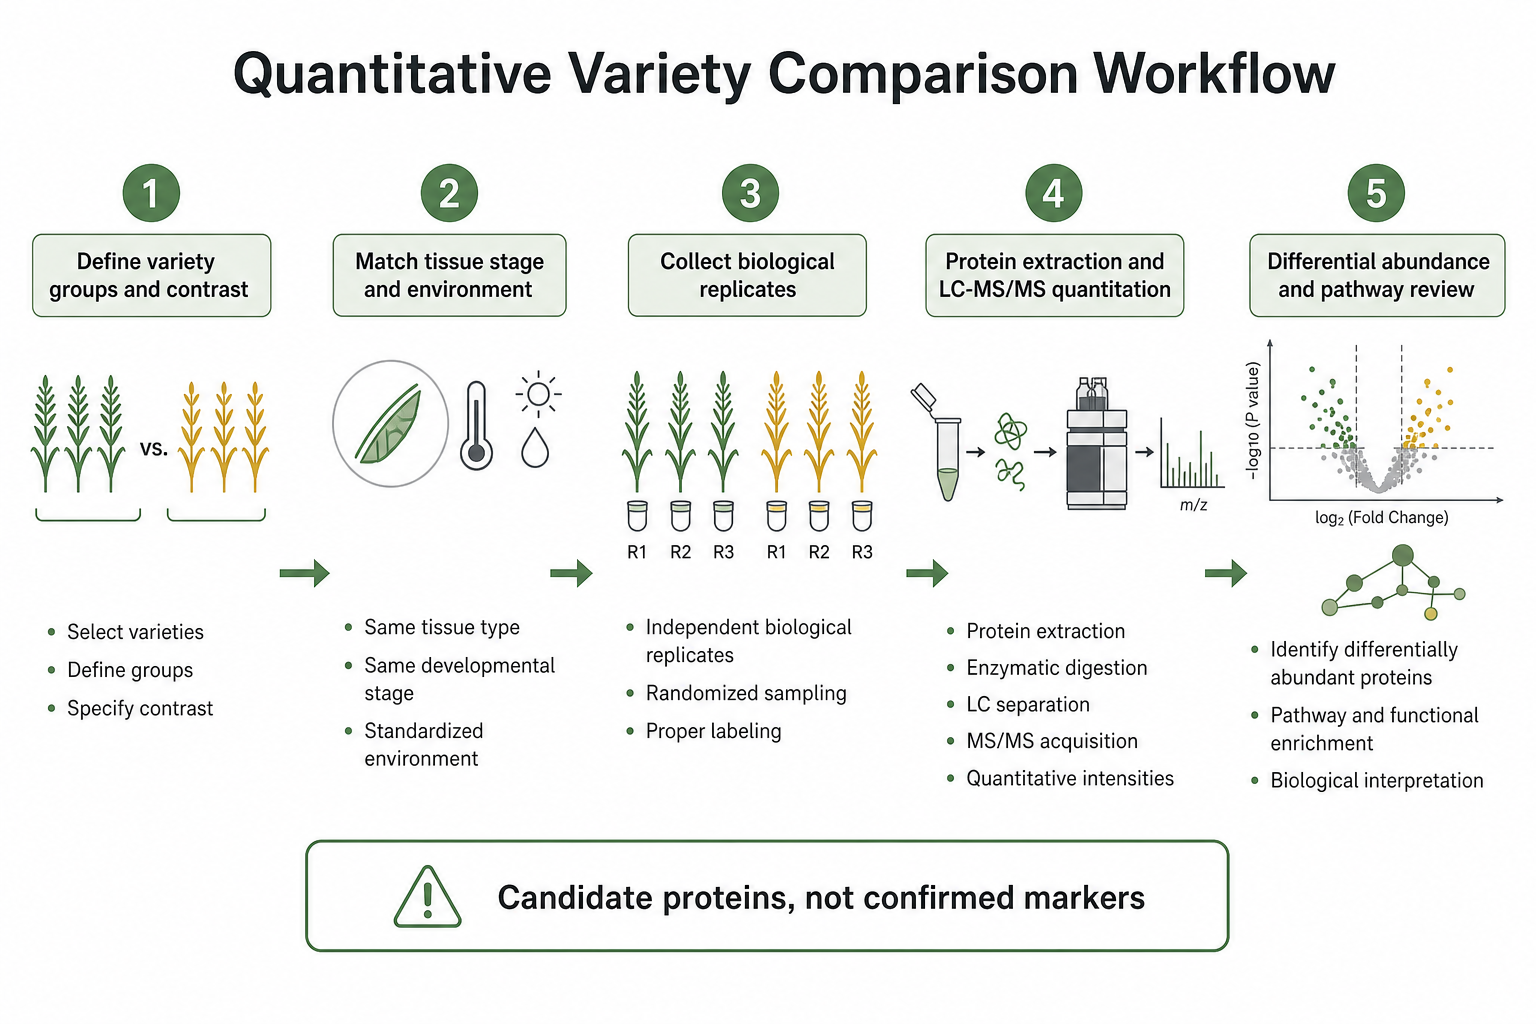
Figure 1. Quantitative Variety Comparison Workflow
Define the Variety Contrast Before Harvest
Trait-linked variety comparisons are difficult to interpret when the phenotype or treatment contrast is not clearly defined. Write the comparison in one sentence.
Examples include:
-
High-protein seed line versus low-protein seed line at maturity
-
Drought-tolerant wheat cultivar versus sensitive cultivar after matched soil drying
-
Two rice varieties under the same salinity protocol at 72 h in root tissue
Then specify:
-
Variety or breeding line identifiers
-
Whether the comparison is constitutive or treatment-linked
-
The phenotype rule used to justify the contrast when trait language is involved
-
Sampled organ and developmental stage
-
Harvest timing or stress window
Constitutive variety comparisons reveal baseline abundance differences under defined control conditions. When the goal is to compare variety-specific treatment responses, matched control and treatment groups should be included for each variety. Comparing treated varieties alone identifies differences under that condition but cannot fully separate baseline genotype effects from treatment-induced responses.
Variety Comparison Design Elements
The table below lists planning elements that shape a quantitative variety comparison.
| Design Element | What to Fix Before Collection | Why It Matters for Quantitative Proteomics |
| Variety groups | Named lines or cultivars in each arm | Sets the statistical comparison groups |
| Contrast type | Constitutive or treatment-linked with matched controls when needed | Separates baseline from response comparisons |
| Tissue and stage | Seed, leaf, root, flower, or other organ | Determines which proteome reflects the trait |
| Environment match | Pot size, nutrition, planting date, light | Reduces non-genotype drift between varieties |
| Stress protocol | Dose, duration, and harvest criteria if treatment-linked | Keeps treatment context comparable across lines |
| Replicate unit | Independently treated experimental units | Prevents pseudoreplication in line-level comparisons |
| Harvest rule | Clock time or phenotype threshold | Prevents unequal injury stage between varieties |
These rows are planning guides. They do not guarantee a specific number of differential proteins for any crop.
Planning examples for tissue collection in standard plant proteomics projects:
-
Soft tissues such as leaves, flowers, grasses, algae, ferns, or fleshy fungal tissue: about 2 g per biological replicate as a recommended collection amount
-
Hard tissues such as roots, bark, twigs, fruits, or seeds: about 5 g per biological replicate as a recommended collection amount
-
Pollen: about 100 mg per biological replicate as a recommended collection amount
These are recommended collection amounts rather than fixed minimum requirements. Project-specific requirements should be confirmed before submission. Degraded, contaminated, or repeatedly freeze-thawed material is not recommended for submission, and infectious plant material cannot be accepted.
Biological replicates should represent independently treated experimental units. The replicate number should reflect biological variability, study design, and project goals.
Match Conditions Across Varieties
Quantitative variety comparison assumes non-genotype factors are held steady wherever practical.
Match across lines:
-
Developmental stage at harvest
-
Tissue position such as leaf rank or root zone
-
Growth medium, pot size, and nutrition
-
Planting or sowing date
-
Time of day at collection
-
Stress dose and exposure clock when treatment-linked
Sensitive varieties may show stronger wilting or injury earlier than tolerant ones under the same calendar protocol. Record phenotype status at harvest and avoid comparing advanced damage in one line with mild symptoms in another unless that difference is the explicit research question.
Do not mix organs inside one variety-versus-variety group. Seed-quality comparisons should use seed. Canopy stress comparisons should use leaf. Root uptake questions should use root.
Quantitation Routes for Multi-Variety Comparison
Quantitative variety studies can use label-free or isobaric labeling strategies, with DDA or DIA acquisition selected according to study design and quantitative goals.
Label-free quantification can use DDA or DIA. DDA supports flexible discovery and quantitative workflows, whereas DIA is often considered when consistent measurement and reduced missing values across matched samples are important.
TMT or iTRAQ may fit when several variety groups can be balanced into a multiplexed plex design and protein input supports labeling chemistry.
The final quantitation and acquisition strategy should follow study design, sample number, quantitative goals, and platform availability rather than variety number alone.
The LC-MS/MS platform should be selected according to sample type, study design, and quantitative requirements.
Plant proteomics service scope typically includes protein extraction or purification, enzymatic digestion, LC-MS/MS analysis, and bioinformatics reporting.
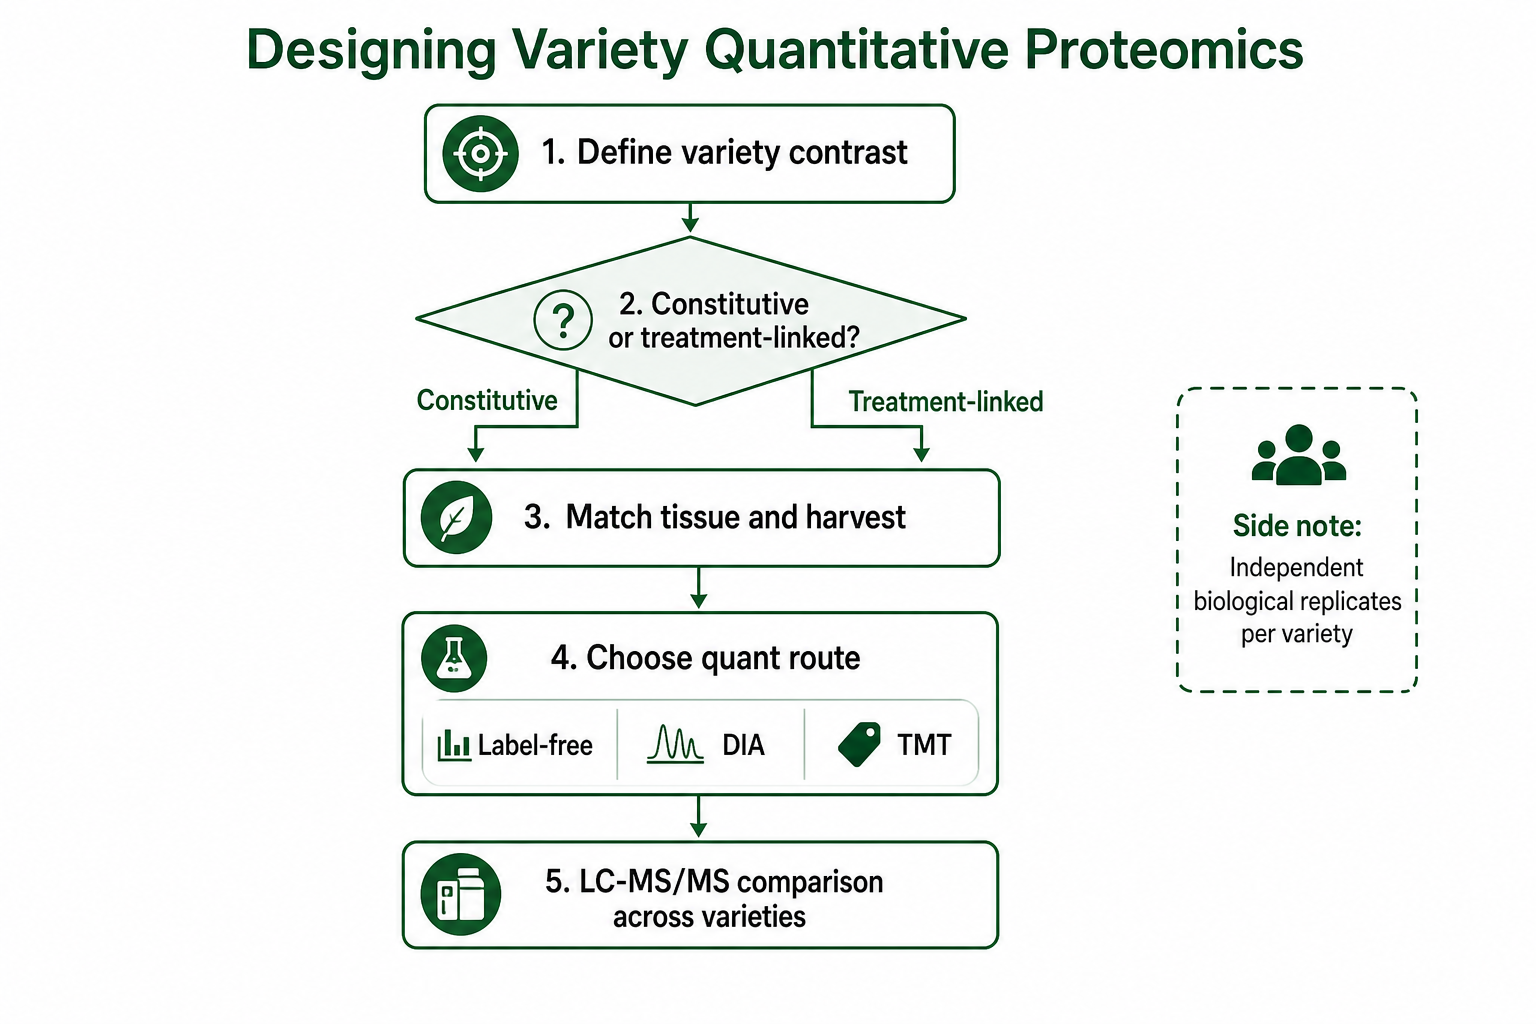
Figure 2. Matched variety groups, tissue-appropriate collection, and LC-MS/MS quantitation form the core comparison path.
From Abundance Differences to Variety-Linked Candidates
After quantitative comparison, interpret proteins as variety-linked candidates rather than confirmed markers.
Prioritize proteins with:
-
Consistent abundance direction across biological replicates in each variety group
-
Clear linkage to the phenotype or treatment rule when trait language is used
-
Detection in most samples rather than one outlier plant
-
Pathway or annotation fit that supports cautious biological wording
Use GO, KEGG, PPI, and Reactome views to organize candidates when the species is supported. Pathway themes help prioritize follow-up. They do not prove that any one protein controls variety performance.
Cross-check the differential list against harvest records:
-
Proteins that track the measured trait score across replicates are stronger leads
-
Proteins appearing only in one outlier plant should not drive the main story
-
Proteins elevated in collapsed or over-stressed tissue may reflect damage rather than variety advantage
Quantitative variety comparison does not replace field trials, genetic mapping, or marker validation when those are the breeding decision tools.
Related Services
Quantitative Proteomics Service
Plant and Animal Multi-Omics Analysis Service
Frequently Asked Questions
1. How many varieties can be compared in one quantitative proteomics project?
Sample number depends on contrast design, replicate plan, and quantitation route. Pilots often start with one focused pair or small set before scaling.
2. Is quantitative proteomics needed for every variety comparison?
Yes when the decision depends on abundance differences. Identification-only work is insufficient for line-level quantitative claims.
3. Should varieties be compared with or without stress treatment?
Both designs are valid. Constitutive comparisons use defined control conditions. Treatment-linked comparisons should include matched controls for each variety when the goal is to distinguish variety-specific treatment responses.
4. How many biological replicates are needed per variety?
Independent biological replicates are required, and the number should reflect biological variability, experimental design, and the comparison being tested.
5. Can leaf and seed varieties be compared in one group?
No when the goal is one variety-versus-variety contrast. Organ choice should match the trait or treatment claim.
6. What should be shared before starting a variety comparison?
Share variety names, tissue type, contrast type, treatment protocol if applicable, harvest timing, replicate plan, and the biological claim the data must support.
Conclusion
Comparing plant varieties with quantitative proteomics requires matched groups, tissue-appropriate collection, independent biological replicates, and a quantitative strategy aligned with the study design and biological question. The output prioritizes variety-linked candidate proteins for review, not automatic marker or causal claims.
To plan a quantitative variety comparison before harvest, contact MtoZ Biolabs with the line names, tissue choice, group design, and comparison the study must support.
How to order?




