






Drought-Tolerant vs. Drought-Sensitive Plants: What Can Comparative Proteomics Reveal?
Comparative proteomics between drought-tolerant and drought-sensitive plants can reveal protein abundance patterns linked to contrasting responses under water deficit. It asks which proteins and pathways differ between tolerant and sensitive cultivars, breeding lines, or accessions evaluated under a defined and monitored water-deficit protocol.
The useful output is a prioritized set of candidate proteins and pathway themes that track the tolerance contrast, not an automatic list of drought marker proteins.
If you are planning drought stress proteomics across contrasting plant materials, share the genotype or line names, drought scoring rule, tissue type, and comparison design with MtoZ Biolabs while the drought protocol is still open.
What Drought-Tolerant vs Drought-Sensitive Proteomics Can Reveal
Quantitative proteomics compares drought-tolerant and drought-sensitive plants to identify:
- Baseline protein differences before drought
- Shared and genotype-specific drought responses
- Coordinated changes in antioxidant defense, osmotic adjustment, photosynthesis, transport, and stress signaling
- Candidate proteins and pathways for further validation
Comparative drought proteomics does not by itself:
- Prove that any one protein controls tolerance
- Replace field drought trials across seasons and environments
- Separate tolerance from delayed wilting if harvest timing or stress severity is uneven across lines
Discovery results should be read as candidate proteins and pathway priorities until phenotype linkage and independent validation support stronger claims.
Define the Drought Contrast Before Harvest
Drought comparisons fail when tolerance is named but not measured. Write the contrast in one sentence.
Examples include:
-
Tolerant versus sensitive wheat lines at a defined soil-moisture or plant-water-status point
-
Two breeding parents with contrasting drought scores at the same leaf water status
-
Medicinal plant accessions with different survival or recovery under controlled water deficit
Then define the phenotype rule used to separate materials:
-
Visual wilting score
-
Relative water content threshold
-
Survival after defined drought duration
-
Yield retention under drought
-
Another accepted drought index for that crop
Choose the comparison type:
-
Tolerant challenged versus sensitive challenged under the same drought protocol
-
Matched well-watered controls for both lines when drought-induced, constitutive, or genotype-dependent responses are being studied
-
Optional recovery sampling when the question includes rehydration response
A drought-only comparison describes differences under drought but cannot separate baseline genotype effects from drought-induced responses.
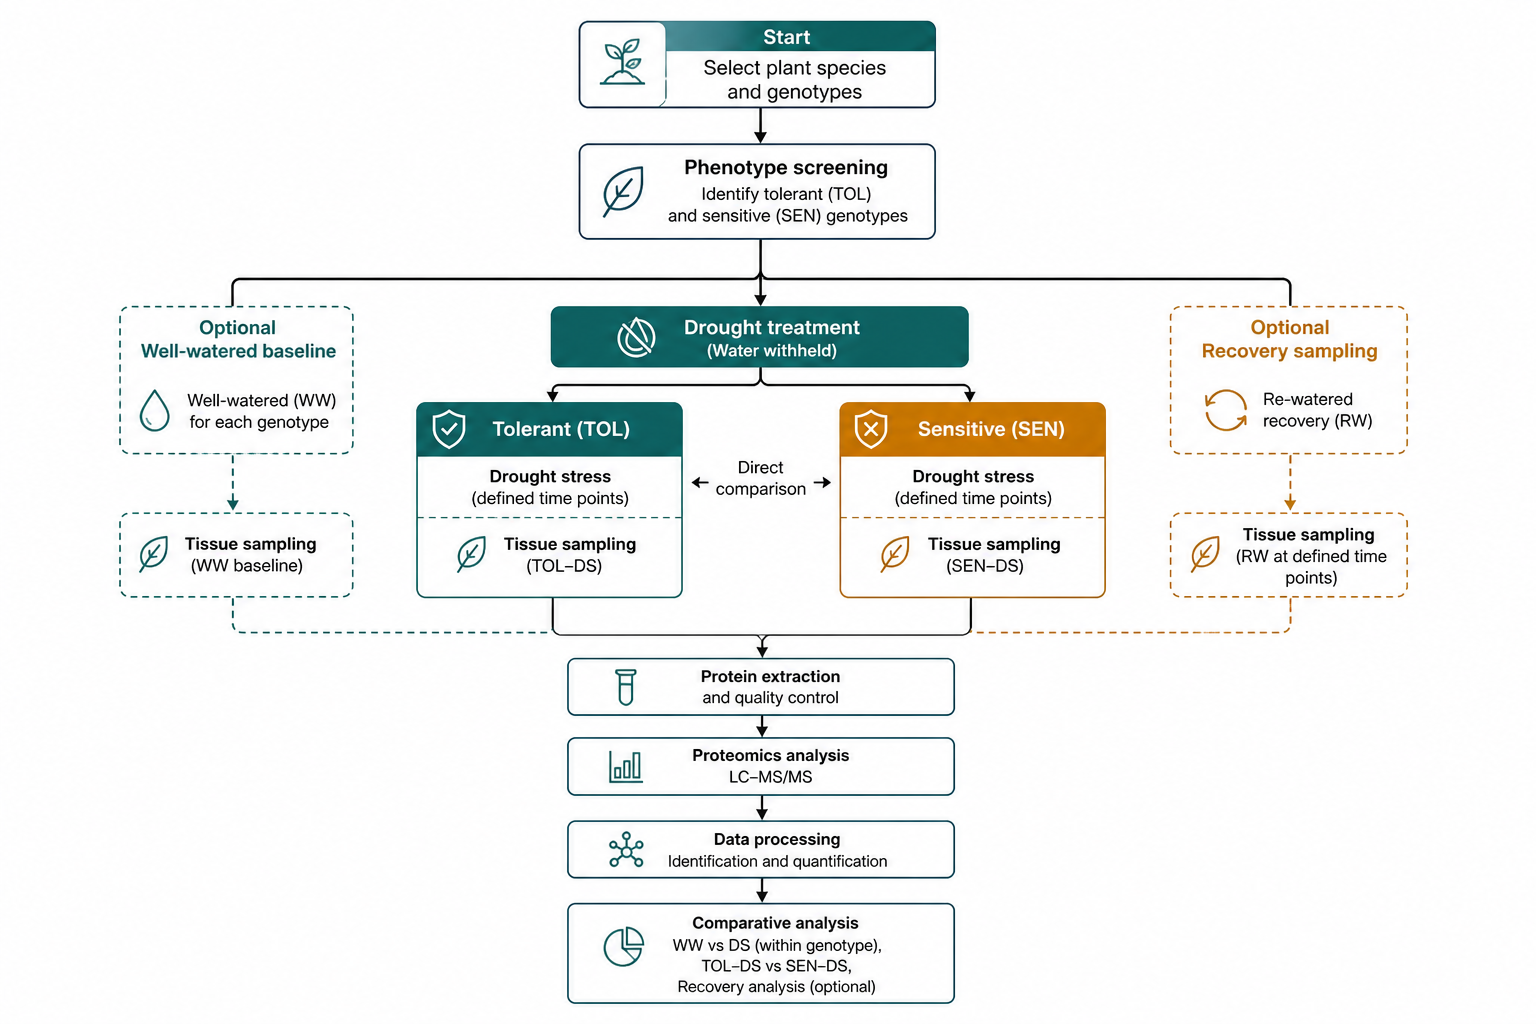
Figure 1. Tolerant versus sensitive comparison, matched well-watered controls, and recovery groups answer different drought questions.
For breeding-oriented projects, drought dose, pot size, soil type, developmental stage, and harvest timing should be matched. Equal withholding duration may still produce unequal stress because lines differ in size, transpiration, and water use. Do not compare collapsed sensitive tissue with less-damaged tolerant tissue as an equivalent contrast.
| Design Element | What to Define Early | Why It Matters for Drought Proteomics |
| Tolerance contrast | Tolerant vs sensitive line or accession | Sets the biological claim |
| Water-deficit definition | Duration plus soil moisture, pot weight, or plant water-status criteria | Shows whether stress is comparable |
| Phenotype scoring | Wilting score, RWC, survival, yield retention | Links proteins to measured drought response |
| Control groups | Well-watered controls for each line when treatment responses are inferred | Separates genotype and drought effects |
| Tissue and stage | Leaf, root, seed, or other organ | Determines which response is captured |
| Harvest window | Early stress, severe stress, or recovery | Separates acclimation from damage |
| Replicate unit | Independent plants or pots | Supports defensible comparison |
Match Drought Conditions Across Lines
The cleanest design applies a standardized drought protocol to every line and records soil or plant water status and phenotype at harvest.
Equal treatment duration compares chronological exposure; a matched soil- or plant-water-status threshold compares more similar effective stress. State which design is used.
Match non-drought factors whenever possible:
-
Plant age and developmental stage
-
Pot size, soil medium, and pre-stress watering history
-
Light cycle, temperature, and growth environment
-
Sampled organ and leaf rank or root zone
-
Time of day at harvest
Use independent biological replicates rather than subsamples from one plant. Replicate number should reflect phenotype variability; plant position, preparation, and LC-MS/MS run order should be randomized or balanced.
Avoid these design problems:
-
Assuming equal withholding time means equal drought severity
-
Mixing leaf and root samples without a defined question
-
Pooling early acclimation with late damage-stage samples
-
Comparing lines at different maturity stages
Sample requirements vary by species, tissue, extraction difficulty, and workflow. Confirm amount, preservation, and condition with MtoZ Biolabs rather than applying one universal requirement. Poor preservation or repeated freeze-thaw may compromise comparison.
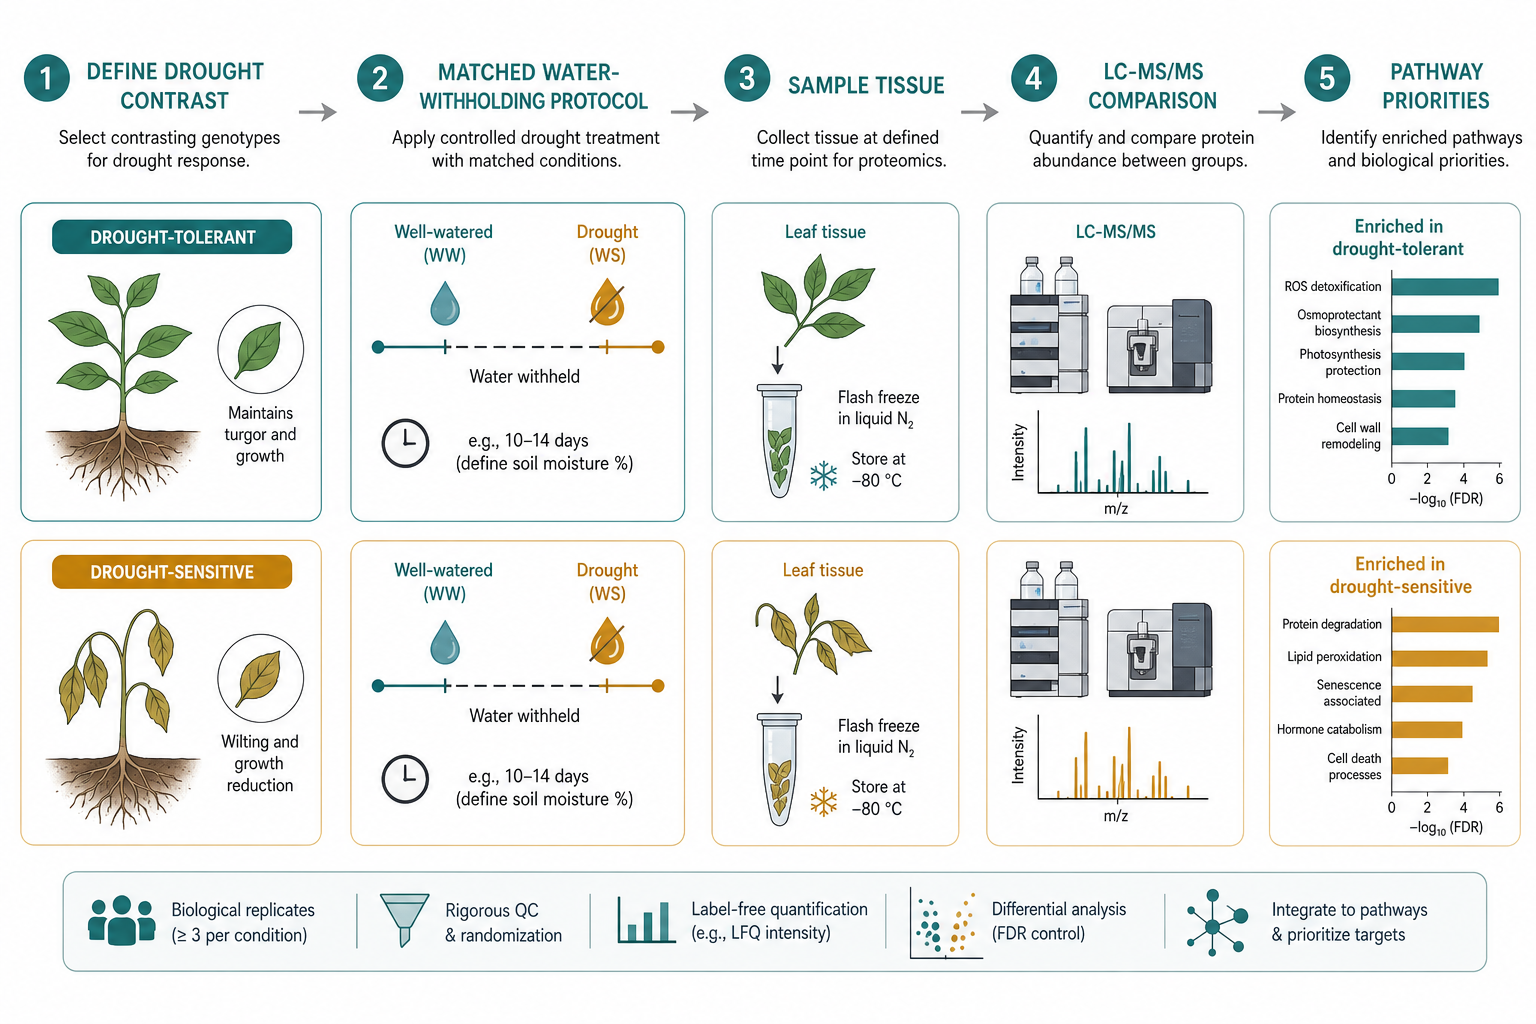
Figure 2. Define the drought contrast, monitor actual stress status, then prioritize proteins and pathways that track tolerance.
From Differential Proteins to Drought-Related Pathways
After LC-MS/MS and quantitative comparison, ask which protein changes track the tolerance contrast rather than uneven drought progress.
Distinguish genotype effects, drought effects, genotype-by-treatment interactions, and predefined comparisons. Prioritize proteins with:
-
Consistency across biological replicates
-
Meaningful effect size, statistical support, and multiple-testing control
-
Linkage to phenotype records collected at harvest
-
Relevant pathway context
-
Stable detection across most samples
Use GO, KEGG, and supported pathway or network resources to organize candidates. An enriched antioxidant or stress-response pathway can support hypothesis formation, but it does not prove that any single protein controls tolerance.
Cross-check the differential list against phenotype records:
-
Proteins that track lower wilting scores or higher survival are stronger follow-up leads.
-
Proteins found mainly in severely damaged sensitive plants may reflect collapse rather than tolerance biology.
-
Proteins present in only one outlier plant should not drive the main story.
-
Baseline genotype differences should not be described as drought-induced without matched controls.
Review missing values, batches, clustering, and outliers. Treat pathway enrichment as prioritization, not proof of mechanism.
Analytical Choices for Drought Comparison Studies
Choose the workflow after confirming groups, drought protocol, and tissue suitability.
Protein identification fits early characterization. Quantitative proteomics is required when abundance differences drive the project.
Workflow options include:
-
DDA when it matches the sample set, coverage goal, and analysis plan, commonly processed using MaxQuant or Proteome Discoverer
-
DIA when consistent quantification across matched samples is a priority, commonly supported by Spectronaut or DIA-NN
-
Orbitrap Exploris 480, timsTOF Pro, or Orbitrap Astral, depending on the confirmed workflow
Both DDA and DIA can support comparison. Selection should consider complexity, consistency, depth, and downstream analysis rather than project size alone.
A common drought proteomics path is:
-
Quantitative comparison of one tolerant and sensitive pair with matched controls when drought responses are inferred
-
Optional recovery time points once the main contrast is stable
-
Follow-up metabolomics, phosphoproteomics, or expanded line panels after candidate prioritization
Plant proteomics projects typically include protein extraction, digestion, and LC-MS/MS. The final scope should be confirmed for the sample type and project objective.
Common Mistakes in Drought-Tolerant vs Drought-Sensitive Proteomics
-
Assuming the same drought duration creates the same stress severity
-
Comparing only drought-treated lines while claiming drought-induced or tolerance-specific changes
-
Using tolerance labels without phenotype scores at harvest
-
Treating every differential protein as a tolerance marker
-
Mixing organs, developmental stages, or stress phases
-
Reading pathway enrichment as proof of mechanism
-
Ignoring genotype-by-treatment effects or batches
-
Scaling up before the protocol is stable
A Practical Planning Checklist
-
Write the tolerant versus sensitive contrast and drought scoring rule.
-
Define the water-withholding protocol and water-status criterion.
-
Choose tissue and developmental stage.
-
Add matched well-watered controls when drought-induced or genotype-dependent responses are the target.
-
Match pots, soil, watering history, and environment.
-
Plan independent biological replicates and record phenotype plus water status at harvest.
-
Balance plant position, preparation, and LC-MS/MS run order.
-
Decide whether recovery groups are needed.
-
Choose quantitative comparison when abundance differences drive the question.
Related Services
Integrative Proteomics-Metabolomics Analysis Service
Frequently Asked Questions
1. What can comparative proteomics reveal between drought-tolerant and drought-sensitive plants?
It can reveal candidate proteins and pathway themes linked to contrasting drought response under a defined and monitored water-deficit protocol.
2. Should drought stress proteomics compare lines under the same drought treatment?
Yes, but the same withholding duration may not produce the same effective stress severity. Soil or plant water status should also be recorded.
3. Which tissues are commonly sampled in drought proteomics studies?
Leaves are common for canopy drought response. Roots may fit questions focused on water uptake or root-zone stress.
4. Do differential proteins prove a drought tolerance gene or marker?
No. They are candidate proteins until phenotype linkage and follow-up validation support stronger claims.
5. Are well-watered control groups needed?
Yes when identifying drought-induced, constitutive, or genotype-by-treatment responses. Without them, conclusions should be limited to differences between lines under drought.
6. What should be shared before starting a drought comparison?
Share line names, drought scoring rule, water-withholding protocol, water-status measurements, tissue type, group design, and planned replicate number.
Conclusion
Drought-tolerant versus drought-sensitive proteomics is most informative when stress severity, phenotype scoring, tissue, and harvest timing are matched. Matched well-watered controls separate baseline genotype differences from drought and genotype-dependent responses. The analysis prioritizes proteins and pathways that track tolerance; it does not make every significant change a marker.
To plan drought-tolerant plant proteomics across contrasting materials, contact MtoZ Biolabs with the line pair, drought protocol, water-status criteria, tissue choice, and the comparison the study must support.
How to order?




