


Circular Dichroism Spectrum Analysis Service
Circular dichroism spectrum analysis is a spectral analysis technique based on the differential absorption of left circularly polarized light (LCP) and right circularly polarized light (RCP) by molecules. When circularly polarized light passes through a chiral sample, the absorption of LCP and RCP is different; this absorption difference, known as circular dichroism (CD), reflects the sample's secondary structure and conformational information. By measuring the absorption differences at various wavelengths, circular dichroism spectrum analysis service can reveal detailed information about a molecule's helical structures, β-sheet structures, and random coil structures. Circular dichroism spectrum analysis is widely applied in the study of biological macromolecule structures, such as the secondary structures, conformational changes, and interactions of proteins, nucleic acids, and their complexes. Its high sensitivity and non-destructive nature make CD spectrum analysis an ideal choice for elucidating the structures of complex biological systems.
Miles A J. et al., Chem. Soc. Rev., 2016.
Proteins exhibit asymmetric secondary conformations, such as α-helices, β-sheets, β-turns, and other stereostructures, which result in differential absorption of LCP and RCP. When LCP and RCP passes through a protein, it becomes elliptically polarized light. This phenomenon is known as protein CD. Circular dichroism spectrum analysis service utilizes protein CD to elucidate their secondary and tertiary conformations, making it an important tool for studying the relationship between protein molecular structure and function. MtoZ Biolabs provides professional circular dichroism spectrum analysis service for analyzing and determining the spatial conformation of proteins.
Service Advantages
1. Advanced Analysis Platform: MtoZ Biolabs established an advanced circular dichroism spectrum analysis service platform, guaranteeing reliable, fast, and highly accurate analysis service.
2. One-Time-Charge: Our pricing is transparent, no hidden fees or additional costs.
3. High-Data-Quality: Deep data coverage with strict data quality control. AI-powered bioinformatics platform integrates all circular dichroism spectrum analysis service data, providing clients with a comprehensive data report.
4. Advantages of circular dichroism spectrum analysis service: The determination process is quick, straightforward, and highly efficient. It requires only an extremely small amount of sample and can be measured in dilute solutions.There are no restrictions based on molecular weight or size.Capable of detecting subtle changes in secondary and tertiary structures.
Services at MtoZ Biolabs
MtoZ Biolabs, an integrated Chromatography and Mass Spectrometry (MS) Services Provider, provides advanced proteomics, metabolomics, and biopharmaceutical analysis services to researchers in biochemistry, biotechnology, and biopharmaceutical fields. MtoZ Biolabs has established a circular dichroism spectrum analysis platform for studying the secondary structures of proteins and peptide-based bioproducts. Our instruments are equipped with temperature control and titration modules, which enable further investigation into the effects of factors such as temperature, pH, and ionic strength on protein folding states and stability. If you are interested in our circular dichroism spectrum analysis service, please feel free to contact us. Welcome to learn more details.
FAQ
Q1. How does sample purity affect circular dichroism spectrum analysis?
CD spectrum analysis primarily relies on the chiral structural features within molecules, such as the secondary structures of proteins or the secondary conformations of DNA. Any impurities or non-pure substances can interfere with the spectrum, potentially leading to the following issues:
Interference with Spectral Peaks: Impurities or non-target molecules may generate absorption peaks within the same spectral range or affect existing spectral features, thereby impacting the structural analysis of the target molecule.
Reduced Signal-to-Noise Ratio: A high level of impurities in the sample can weaken the spectral signal, decreasing the signal-to-noise ratio and affecting the accuracy of the data.
Quantitative Analysis Errors: If impurities possess similar absorption characteristics to the target molecule, it may lead to incorrect structural inferences or misleading quantitative results.
Therefore, ensuring sample purity is essential before performing CD spectrum analysis. It is generally recommended to use HPLC or other purification techniques to remove impurities from the sample.
Q2. Can circular dichroism spectrum analysis distinguish between different secondary structures of proteins?
Yes, CD spectrum can effectively distinguish and quantify different secondary structures of proteins. CD spectrum is based on the distinct light absorption characteristics of various secondary structure elements within proteins (such as α-helices, β-sheets, and random coils) in the ultraviolet range (typically between 190-250 nm). These structural elements interact differently with circularly polarized light at different wavelengths, allowing CD spectra to reflect the overall secondary structure information of proteins.
α-Helix: Typically exhibits prominent absorption bands around 208 nm and 222 nm. The intensity and shape of these peaks provide qualitative and quantitative information about the α-helix content.
β-Sheet: Characterized by a minimum around 215-220 nm and a small peak around 195-200 nm. The β-sheet structure generates a distinctive absorption pattern in the CD spectrum that differs from that of α-helices.
Random Coil: Displays a broad minimum in the absorption spectrum, usually between 195-210 nm.
Deliverables
1. Comprehensive Experimental Details
2. Materials, Instruments, and Methods
3. Total Ion Chromatogram & Quality Control Assessment (project-dependent)
4. Data Analysis, Preprocessing, and Estimation (project-dependent)
5. Bioinformatics Analysis
6. Raw Data Files
Case Study
Researchers conducted experimental assessments of the secondary structure of the active candidate antimicrobial peptides (c_AMPs) using circular dichroism spectrum analysis, thereby providing a foundation for subsequent assessments of the antimicrobial properties of c_AMPs.
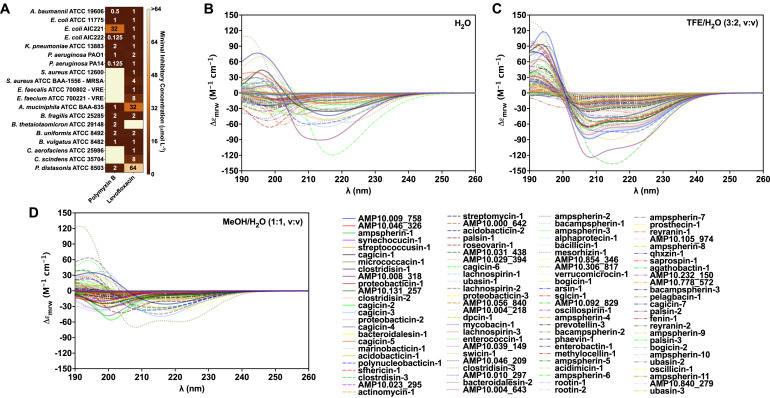
Santos-Júnior, Célio Dias et al., Cell, 2024.
MtoZ Biolabs, an integrated chromatography and mass spectrometry (MS) services provider.
Related Services
Protein Structure Identification Service
X-Ray Crystallography Protein Structure Determination Service
How to order?

