


Circular Dichroism Spectroscopy Analysis Service
Circular dichroism spectroscopy analysis service provides a unique optical fingerprint for studying molecular structures, serving as a powerful tool for analyzing the secondary structure, folding stability, and conformational changes of biomolecules such as proteins and nucleic acids. By measuring the difference in absorption of left- and right-circularly polarized light by chiral molecules, circular dichroism (CD) spectroscopy generates characteristic spectral signals closely linked to the molecule's geometric configuration, secondary structure, and environment. Circular dichroism spectroscopy is widely applied in structural biology, drug development, and materials science. MtoZ Biolabs offers circular dichroism spectroscopy analysis service to investigate the secondary structure of proteins and peptides. Additionally, the service enables further exploration of how factors such as temperature, pH, and ionic strength influence protein folding states and stability.

Miles A J. et al. Chem Soc Rev. 2016.
Analysis Workflow
1. Sample Preparation
Prepare protein samples according to experimental requirements, ensuring appropriate purity and concentration.
2. Spectral Scanning
The sample is scanned over a wavelength range (usually 190-260 nm) using a high-sensitivity CD spectrometer and the spectral data are recorded.
3. Data Analysis
Interpret the CD spectra using specialized software to calculate the secondary structure composition, analyze conformational changes, and evaluate thermal stability.
4. Report Generation
Deliver a comprehensive experimental report, including spectral graphs, structural composition, and detailed data interpretation.
Service Advantages
1. Advanced Analysis Platform: MtoZ Biolabs established an advanced circular dichroism spectroscopy analysis service platform, guaranteeing reliable, fast, and highly accurate analysis service.
2. One-Time-Charge: Our pricing is transparent, no hidden fees or additional costs.
3. High-Data-Quality: Deep data coverage with strict data quality control. AI-powered bioinformatics platform integrates all circular dichroism spectroscopy analysis service data, providing clients with a comprehensive data report.
4. Short Detection Time with Simplicity and Efficiency: The process is quick, straightforward, and highly efficient.
5. There are no restrictions on molecular weight or size, and only a small sample amount is required.
Applications
Molecular Structure Characterization
Circular dichroism spectroscopy analysis service provides rapid, non-destructive secondary structure analysis for novel proteins, peptide drugs, and other biomolecules.
Monitoring Conformational Dynamics
Helps uncover molecular dynamic changes under various conditions, such as temperature, pH, and the presence of additives.
Protein Drug Development Support
Circular dichroism spectroscopy analysis service offers direct evidence for validating the stability and activity of protein-based therapeutics.
FAQ
Q: How to Optimize Sample Preparation in Circular Dichroism Spectroscopy Analysis to Obtain High-Quality Spectra?
Sample preparation is a critical step for obtaining high-quality CD spectra. Below are specific recommendations for optimization:
1. Protein Concentration
Recommendation: Maintain protein concentration between 0.1–1.0 mg/mL, depending on the target molecule’s absorbance properties (molar extinction coefficient) and path length (typically 0.1 cm or 0.2 cm). Low concentrations may result in weak signals, while high concentrations can introduce noise.
Optimization Method: Calibrate the sample concentration using absorbance measurement (typically at 280 nm) to ensure it falls within the optimal signal range.
2. Buffer Selection
Avoid Interfering Buffers: Buffers like Tris or DTT that strongly absorb in the far-UV region (190–260 nm) can interfere with CD signals.
Recommended Buffers: Use phosphate buffer (PBS), acetate buffer, or simple distilled water to minimize background absorption.
pH Control: Ensure the buffer’s pH is suitable for the target molecule to prevent alterations in protein structure and activity.
3. Sample Purity
Importance: Impurities such as salts or other small molecules can reduce spectral resolution and accuracy.
Purification Methods: Remove impurities using ultrafiltration, dialysis, or gel filtration, and inspect samples for precipitates or aggregates.
4. Sample Volume
It is recommended to select an appropriate sample volume based on the pathlength, usually at least 300 µL is required to meet the needs of repeated experiments.
5. Temperature Control
Maintain a constant sample temperature during measurement to prevent signal instability caused by temperature fluctuations.
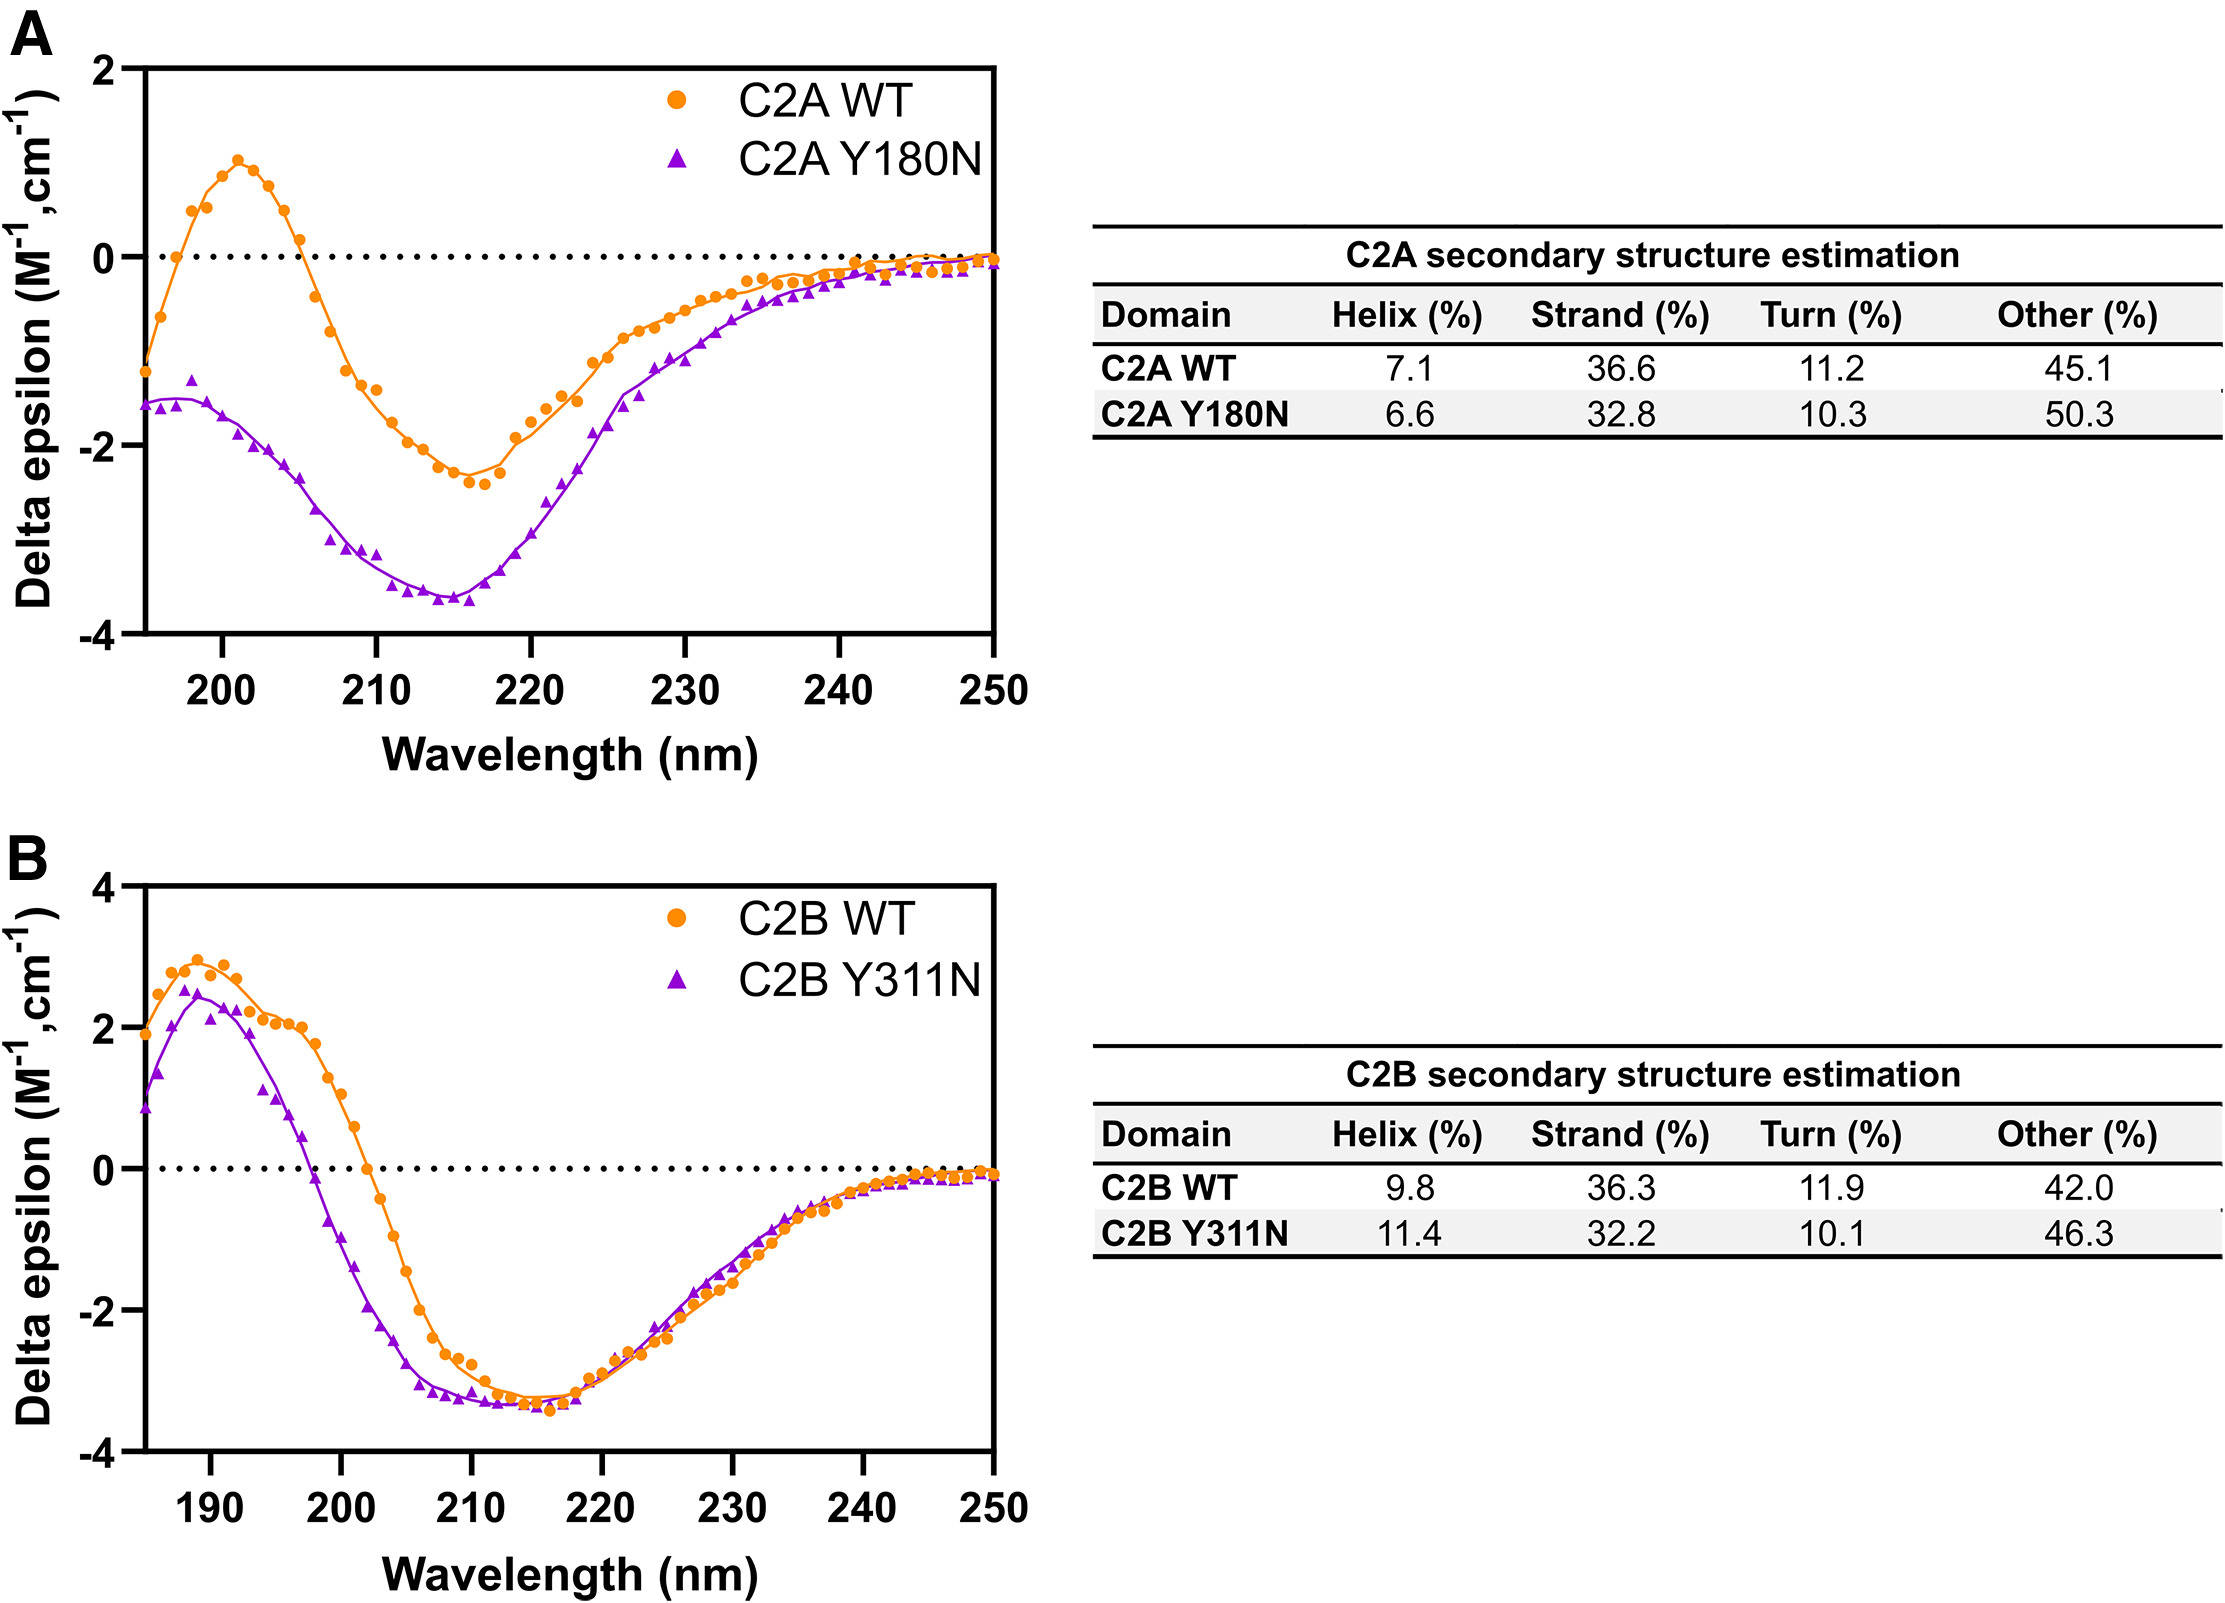
Case Study
Circular dichroism spectroscopy analysis was used to compare the secondary structure changes and thermal stability of Synaptotagmin-1 (Syt1) wild-type and AD3 site mutants under different temperature conditions. The results demonstrated that the AD3 site mutation significantly affected the folding state of the C2 domain and its thermal denaturation curve, indicating that this site plays a critical role in regulating the stability and function of the C2 domain.
Dominguez M J. et al. Biophysical Journal. 2024.
MtoZ Biolabs, an integrated Chromatography and Mass Spectrometry (MS) Services Provider, provides advanced proteomics, metabolomics, and biopharmaceutical analysis services to researchers in biochemistry, biotechnology, and biopharmaceutical fields. Our ultimate aim is to provide more rapid, high-throughput, and cost-effective analysis, with exceptional data quality and minimal sample consumption.
MtoZ Biolabs, an integrated chromatography and mass spectrometry (MS) services provider.
Related Services
Protein Structure Identification Service
X-Ray Crystallography Protein Structure Determination Service
How to order?

