


X-ray Crystal Diffraction Analysis Service
In X-ray diffraction (XRD) experiments, X-rays bombard macromolecules, and the scattered X-rays are analyzed to provide detailed three-dimensional (3D) structural information. The scattering of X-rays by atoms results from interactions between X-ray photons and the electron clouds surrounding each atom. As biomolecules primarily consist of light elements like carbon (C), nitrogen (N), hydrogen (H), and oxygen (O), a single protein molecule's scattering power is quite weak. Thus, a method is needed that enhances the scattering from each protein molecule to increase overall diffraction by aligning all molecules uniformly on a 3D lattice—that is, the molecules must form a perfect crystal.
X-ray crystallography is a vital tool not only for understanding crystal chemical properties but also for elucidating the 3D structures of molecules, making it one of the most frequently used techniques by structural biologists. The Protein Data Bank (PDB) currently holds over 170,000 biological macromolecular structures, with X-ray crystallography accounting for about 90% of these entries. This vast repository allows scientists to explore macromolecular structures at atomic or near-atomic resolutions, enhancing our understanding of biological processes and the spatial arrangement of atoms within these processes.
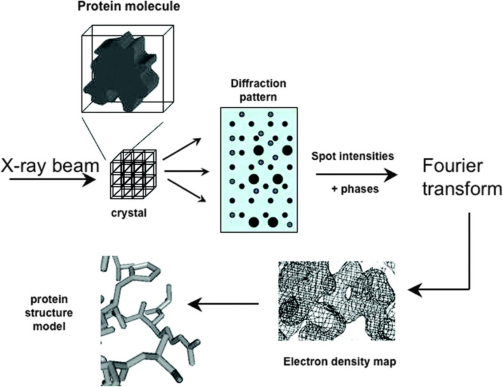
Figure 1. Principles of X-ray Crystal Diffraction [3]
The basic workflow of X-ray crystal diffraction starts with crystallizing the molecule of interest and placing a single crystal, which contains thousands of copies of the molecule, into an X-ray beam. As the crystal rotates slowly in the beam, diffraction images are collected at intervals of 0.5-1° until every point within the crystal is sampled. The intensity of the diffracted X-rays and information about their phases are captured and transformed into the protein's electron density map through Fourier transformation. A model of the protein structure is subsequently built into this electron density map.
1. Formation of Crystals
Inducing molecules to form crystals is the initial step in determining macromolecular structures via XRD. Typically, the desired proteins must be highly purified and are often trimmed, slightly mutated using proteases, or altered in minor ways using recombinant DNA techniques to remove portions of the protein that would interfere with its ability to solidify into ordered crystals. Crystallization experiments typically use concentrated protein solutions and can last weeks or months, essentially being a "trial and error" process. Generally, the purer the protein, the higher the likelihood of successful crystal growth, starting from a supersaturated macromolecule solution and progressing to a thermodynamically stable state where proteins distribute between the solid phase and the solution. The time required to reach equilibrium significantly affects the outcome, ranging from amorphous or microcrystalline precipitates to large single crystals. Supersaturation can be induced by adding precipitants such as salts, organic solvents, and polyethylene glycol polymers and/or altering solution parameters like pH, temperature, and protein concentration. Extreme conditions should be avoided as proteins are unstable molecules. Protein crystallization involves three main steps: (1) Assessing protein purity—further purification may be necessary if purity is below 90-95%. (2) Dissolving the protein in an appropriate solvent that must precipitate in a crystalline form—commonly a water buffer solution. (3) Achieving supersaturation—this step involves the formation of small aggregates that act as nuclei for crystal growth. Once nuclei form, actual crystal growth commences.
Emerging technologies like vapor diffusion crystallization and the lipidic cubic phase (LCP) have been developed to assist in crystallizing challenging proteins, particularly membrane proteins. In vapor diffusion, detergent-solubilized membrane proteins are mixed with a crystallization buffer to establish a crystallization drop. In the hanging-drop method, the drop is suspended under a cover slip, and in the sitting-drop method, it is placed on a pedestal next to a reservoir solution. In the LCP method, detergent-solubilized proteins are mixed with neutral lipids such as monoacylglycerol (MAGs) using syringes and a coupler, and the protein-lipid mixture is covered with buffer to establish a crystallization drop on a glass sandwich plate. Typical crystallization screens involve carefully adjusted pH, salt, and precipitant type/concentration.
Another aid for crystallizing challenging proteins involves crystallization chaperones—soluble proteins that specifically bind to target membrane proteins to increase the surface area necessary for forming crystal contacts, thereby facilitating crystallization. Successful examples include T4 lysozyme, antigen-binding fragment (Fab), and nanobody. For co-crystallization experiments, proteins are conditioned in the presence of ligands prior to crystallization, as the presence of ligands can alter crystallization conditions, potentially necessitating new condition screenings. Pre-coating crystallization plates with ligands before crystallization and then performing or not performing in situ XRD offers a practical approach for fragment screening in a 96-well format.
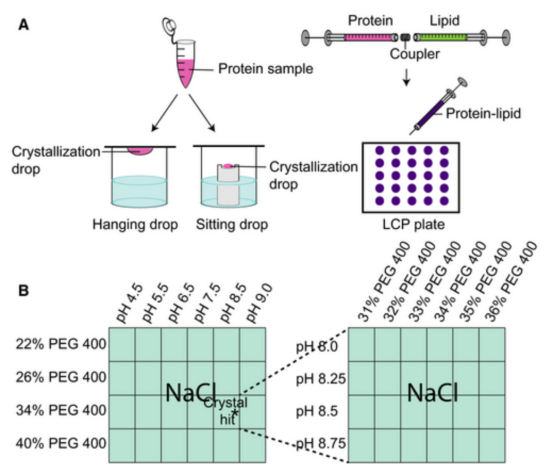
Figure 2. Schematic of Vapor Diffusion Crystallization and LCP [4]
2. Crystal Screening
The aim of any crystallization experiment is to produce a single crystal suitable for XRD. However, not all experiments result in crystal formation, nor are all crystals suitable for XRD. The size of macromolecular crystals typically ranges just at or slightly below the limit of human visual capacity (i.e., each edge between 20-300 μm), necessitating screening under an optical microscope. Some compounds crystallize into thin plates that often stick together, or worse, form what appear to be single stacked structures. Rapid crystal growth can lead to multiple crystals emerging from a single nucleation center—a common occurrence with elongated or needle-shaped crystals. Harvesting these needles can yield structures resembling glass wool or dust balls. In many cases, it is possible to isolate single crystals from these less-than-ideal forms through careful dissection.
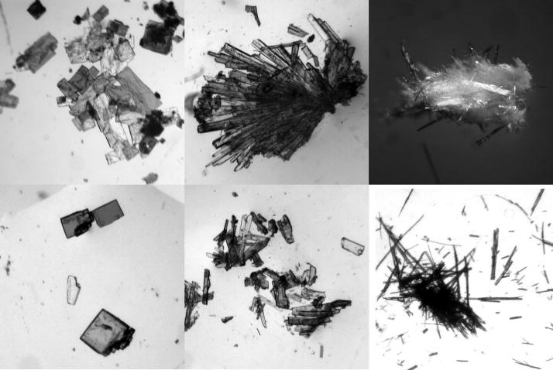
Figure 3. Common Crystal Structures [5]
3. XRD
Single crystals are mounted in a goniometer, a device that precisely positions the crystal within an X-ray beam for rotation. The setup exposes the crystal to an intense monochromatic X-ray beam and rotates it slightly by ∼0.5-1°. The scattered X-rays from the crystal are captured by either a film or a digital image detector. X-rays are produced in laboratories by accelerating an electron beam from a cathode into an anode, with the anode material determining the X-ray wavelength. Monochromatization is conducted using either a thin metal foil to absorb unwanted radiation or a graphite crystal to exploit its strong low-order diffraction. To enhance brightness, the anode may rotate (rotating anode generator) and is cooled with water to prevent melting. Another type of X-ray source involves bending the electron beam with magnets, a principle used in synchrotron radiation sources that generate X-ray beams far more intense than those from rotating anode generators. These high-intensity sources reduce data collection time significantly. The X-ray spectrum from such sources is serial, ranging from about 0.05 to 0.3 nm.
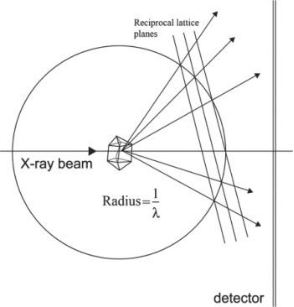
Figure 4. Schematic of Generating XRD Patterns [6]
XRD data collection, whether at a synchrotron or on a home source, usually requires to harvest crystals from the crystallization drop, using a loop or mesh, and cooling them at 100 K in order to limit radiation damage. If performed manually, these steps are quite time consuming, especially if an additional cryoprotection step is necessary. Various automated systems have been developed to streamline this process. Modern synchrotron beamlines now facilitate automatic sample loading, centering, and both attended and unattended data collection and processing. An alternative is in-situ data collection, directly from crystallization drops in 96-well plates at room temperature, using precoated plates with dry ligands, eliminating the need for crystal harvesting and cooling. However, this method requires high quality crystals as X-ray scattering from the crystals can be contaminated by the plate and the crystallization medium. Moreover, the crystal’s rotation in the X-ray beam is limited to about 90° due to the orientation of the 96-well plate relative to the beam, necessitating the combination of multiple datasets and preference for high-symmetry space groups.
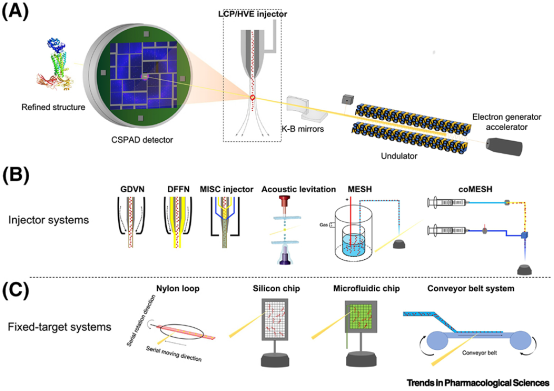
Figure 5. X-ray Free Electron Laser Production Process [7]
4. Data Processing
Data collection strategies aim to capture each unique reflection at least once. Key considerations include: (1) ensuring the crystal is a single entity; (2) measuring crystal diffraction near the detector edge for good signal-to-noise ratio (SNR); (3) selecting appropriate exposure times to balance high-resolution data capture against potential overload reflections and radiation damage; (4) adjusting image rotation angles to prevent spot overlap while ensuring adequate spot distribution; (5) enhancing data diversity improves overall quality by minimizing random errors and facilitating outlier detection.
Data analysis is typically conducted in three stages using modern software: (1) auto-indexing from a single oscillation image to derive lattice types, crystal cell parameters, and orientation; (2) indexing all images to correlate measured diffractions with predicted spots, assigning Miller index (hkl), and calculating diffraction intensities; (3) scaling to integrate and compute structure factor amplitudes across all reflections.
Numerous streamlined software packages are available to analyze diffraction data, reducing it to a set of unique reflections and initiating structural resolution. Over the past decade, as hardware has advanced and data collection has become automated, computational tools for structural resolution have significantly improved. Software packages like those released by the Collaborative Computational Project Number 4 (CCP4) and PHENIX now enable the resolution of many structures without manual intervention, encompassing processes from data reduction to the calculation of phases and electron density maps, interpretation of maps (model building), structure refinement (completion), and deposition into the Protein Data Bank (PDB). For cases that still cannot be resolved automatically, the software can better diagnose the causes of failure and guide crystallographers in manual resolution. Techniques such as molecular replacement, as implemented by Phaser and Arcimboldo, can now successfully use highly remote models or even secondary structural elements. Advances in phase determination software, such as the SHELX suite, along with improved methods for enhancing the anomalous signal when integrating data from a large number of different crystals, now allow the successful handling of very weak anomalous signals. After the initial model is obtained, the structure must be refined to optimize the fit between the model and the electron density. This process is rapid and has a large convergence radius, as seen in software like Phenix.refine and Refmac. Software that automatically builds atomic models into electron density maps is increasingly powerful, and for manual building, programs like Coot significantly aid the iterative process of model refinement and reconstruction.
A key stage in crystallographic studies of unknown structures is the creation of the atomic model. In macromolecular crystallography, the resolution of experimental phase maps is rarely high enough to make atoms visible. However, developments in modern data collection techniques, such as cryo-crystallography and synchrotron sources, have significantly enhanced the quality of maps, which in turn has made the construction of atomic models more feasible. Two types of maps are used in model building: "2Fo-Fc" maps and "Fo-Fc" maps, where Fo represents the observed structure factor amplitude, and Fc represents the calculated value.
Analysis Workflow
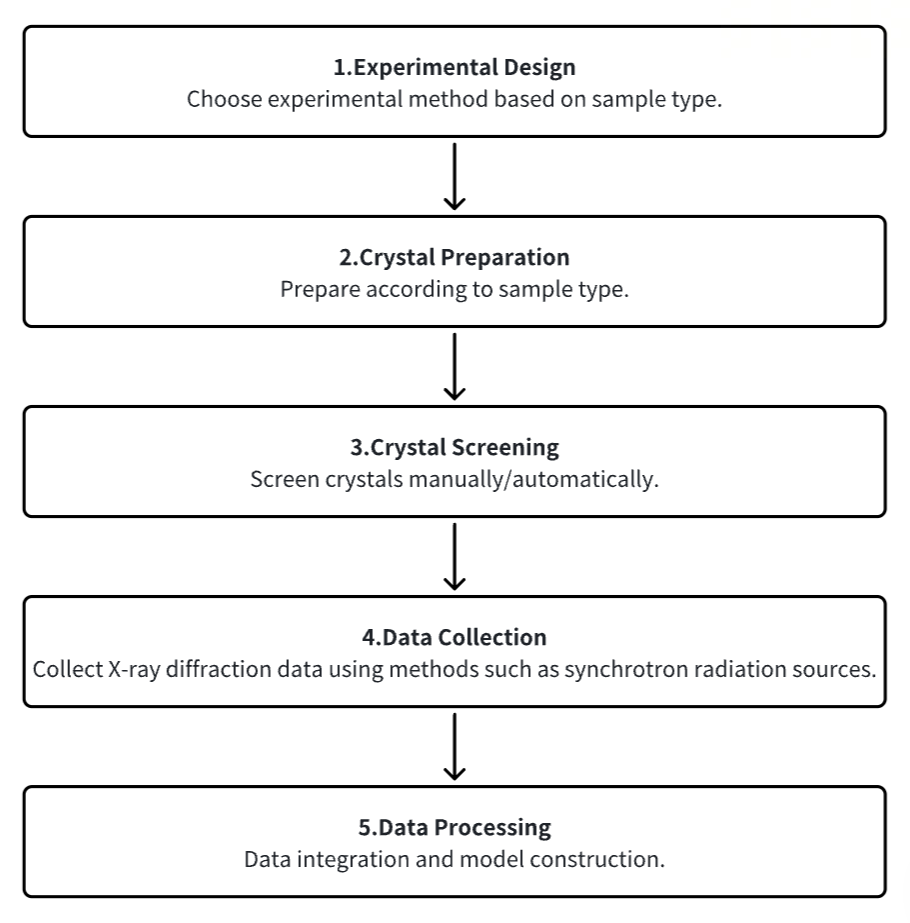
1. Experimental Procedure Determination Based on Requirements
2. Crystal Preparation
3. Crystal Screening
4. Data Collection
5. Data Processing
Service Advantages
1. Customizable Experimental Methods Based on Requirements
2. Multi-Gradient Design for Optimal Condition Exploration and Sample Optimization Guidance (Capable of Performing All Types of Protein Crystallization Experiments, Including Hanging-Drop, Sitting-Drop, and Oil-Drop)
3. Automated Equipment Combined with High-Performance Detection Systems, Making Crystal Screening Experiments Faster, Cheaper, and Simpler than Before
4. Complete Workflow for 3D Reconstruction Available Including Determining Phase Angles, Electron Density Maps, Correcting Structures, and Creating Models for Further Optimization; Information about the Surface Features and Internal Morphology of Proteins provided by the Reconstructed 3D Structures, achieving atomic-level resolution
Sample Results
1. Chemical Crystallography Utilizing Serial Femtosecond XRD
Inorganic-organic hybrid materials occupy a large proportion of newly reported structures due to their simple synthesis routes and customizable properties. This proliferation has led to a characterization bottleneck: many hybrid materials are compulsory microcrystals with low symmetry and severe radiation sensitivity, which interfere with standard techniques such as single-crystal XRD and electron microdiffraction. Studies have demonstrated the use of small molecule serial femtosecond X-ray crystallography (smSFX) for determining the crystal structures of microcrystals. By placing a suspension of microcrystals under the radiation of an X-ray free-electron laser, thousands of diffraction patterns of random orientations are obtained. We determine the unit cell by aggregating the spot-finding results into a high-resolution powder diffractograms. After indexing the sparse serial patterns using graph-theoretical methods, the resulting dataset can be solved and refined using standard tools for single-crystal diffraction data. The study introduced the structural solutions of mithrene (AgSePh), thiophene (AgSPh), and tethrene (AgTePh), with the latter two structures previously unknown. In thiorene, the study discovered geometrical changes in the silver-silver bonding network, which relate to its distinct photoelectric properties. It is demonstrated that smSFX can serve as a universal technique for determining the structures of beam-sensitive microcrystalline materials at near-ambient temperature and pressure.
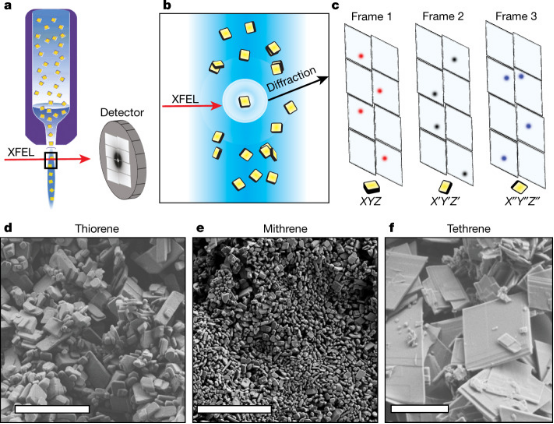
Figure 6. X-ray Free Electron Laser Generation Process [8]
2. Detection of a Geminate Photoproduct of Bovine Cytochrome c Oxidase by Time-Resolved Serial Femtosecond Crystallography
Cytochrome c oxidase (CcO), a membrane-bound hemeprotein, catalyzes the conversion of dioxygen to water. Unlike typical dioxygen binding hemeproteins with a heme b group in their active sites, CcO has a unique binuclear center (BNC) composed of a copper atom (CuB) and a heme a3 iron, where O2 binds and is reduced to water. Using time-resolved serial femtosecond X-ray crystallography, researchers detected dimeric photoproducts of the bCcO-CO complex, revealing CO dissociation from heme a3 iron and migration to an intermediate binding site between CuB and heme a3 iron. The positional changes of the metal centers and the conformation of Helix-X, which accommodates the proximal histidine ligand of heme a3 iron, stabilize the CO complex. This structure, integrated with other bCcO structures, elucidates the trajectory of ligand dissociation and the protein's dynamic behavior.
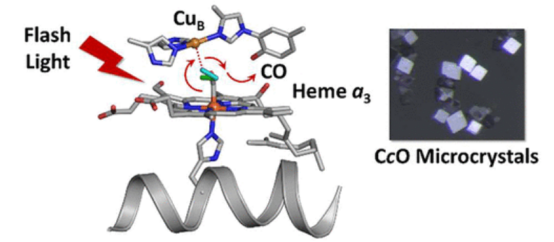
Figure 7. Geminate PhotoProduct Structure of bCcO [9]
3. Observing Photopharmacological Drug Release in Tubulin via Time-Resolved Serial Crystallography
The binding and release of ligands from their protein targets is a fundamental biological process and core to drug discovery. Photopharmacology introduces chemical triggers that allow for changes in ligand affinity through light, altering biological activity. A deep understanding of the molecular mechanisms of photopharmacology is largely missing, as the relevant transitions during the light-triggered reaction process cannot be resolved through traditional structural biology. Studies using synchrotron accelerators and X-ray free-electron lasers in time-resolved serial crystallography have captured the release of the anticancer compound azo-combretastatin A4 and the consequent conformational changes in tubulin. From 1 ns to 100 ms, nine structural snapshots, supplemented by simulations, show how the cis-trans isomerization of the azobenzene bond leads to a change in ligand affinity, the opening of the exit channel, and the collapse of the binding pocket during ligand release. The resulting global backbone rearrangements are related to the mechanism of action of microtubule-destabilizing drugs.
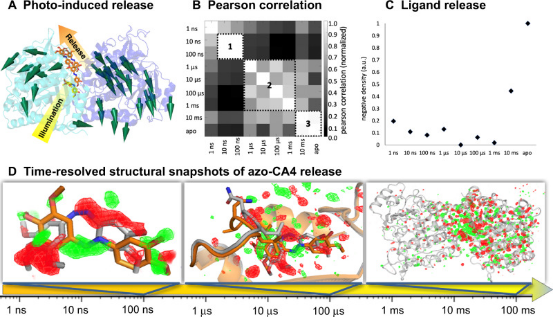
Figure 8. Tracking Ligand Release in Tubulin with a Photochemical Affinity Switch [10]
4. Quantitative Characterization of Short-Range Molecular in Gelatinized Starch Using XRD
A novel method has been developed to quantitatively assess the short-range molecular order in gelatinized wheat and potato starch via XRD. Preparations of starches with varying levels of molecular order and amorphous starches devoid of such order were analyzed using the intensity and area of Raman spectral bands. The molecular order in gelatinized starches decreases with increasing water content during gelatinization. By comparing the XRD spectra of gelatinized and amorphous starch, the XRD peak at 33° (2θ) has been shown to be characteristic of gelatinized starch. The relative peak area (RPA), intensity, and full width at half-maximum (FWHM) of the XRD peak at 33° (2θ) decrease with the increase of gelatinization water content. We propose that the RPA of the XRD peak at 33° (2θ) can be used to quantify the amount of short-range molecular order in gelatinized starch. This method developed in the study will help explore and understand the relationship between the structure and function of gelatinized starch in food and nonfood applications.
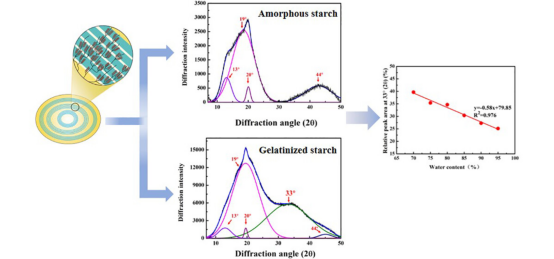
Figure 9. Using XRD to Quantitatively Characterize Short-Range Molecular in Gelatinized Starch [11]
Sample Submission Requirements
1. Comprehensive Experimental Steps
2. Specifications of Relevant Instrumentation
3. Original Experimental Data
4. Data Analysis Report
Applications
1. Application of Powder XRD in Small Molecule Pharmaceuticals
XRD is a pivotal technique for studying crystalline solids and is extensively utilized by pharmaceutical scientists. Most of the active pharmaceutical ingredients (APIs) exist in the solid state under ambient conditions. Understanding their crystal structure is essential for identifying physicochemical properties that could influence their pharmacological effectiveness. A critical application of XRD in pharmaceuticals is polymorph identification. Following the activity screening of molecules against specific targets, selected active molecules are advanced to the lead compound optimization phase for toxicological evaluation. This phase includes salt and polymorph screening to yield chemically stable and bioavailable crystalline forms. Advances in high-energy X-ray sources, sensitive detectors, enhanced optical devices, and robust software have accelerated data acquisition and enhanced resolution. Powder X-ray diffraction (PXRD) has evolved from a method solely used for identifying and quantifying crystalline phases to a powerful tool for gaining structural insights into amorphous and nanocrystalline materials.
2. Using Time-Resolved X-ray Solution Scattering to Track Protein Structural Dynamics
Relevant events during protein function such as ligand binding/release and interaction with substrates or with light are often accompanied by out-of-equilibrium structural dynamics. Time-resolved techniques have been developed to monitor these changes in real time after a given reaction-triggering event. Time-resolved X-ray solution scattering (TR-XSS) is a promising approach, offering structural sensitivity with temporal resolutions in the femto-to-millisecond time range, depending on the X-ray source characteristics and triggering mechanisms. Unlike time-resolved spectroscopic methods that typically provide localized structural changes around a given (intrinsic or extrinsic) chromophores, TR-XSS does not require protein labeling, and every atom in the biomolecule contributes to the overall scattering signal. This method is highly sensitive to global conformational changes and can also trace more localized structural alterations.
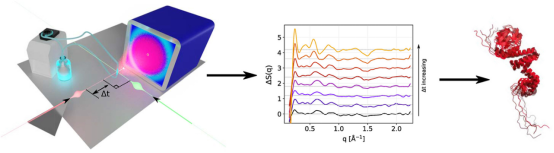
Figure 10. Using XRD to Quantitatively Characterize Short-Range Molecular in Gelatinized Starch [12]
FAQ
Q1: What analyses can XRD perform?
(1) Qualitative phase identification; (2) Determination of unit cell parameters; (3) Analysis of crystal orientations; (4) Calculation of grain sizes; (5) Quantitative phase analysis.
Q2: What are the advantages and disadvantages of X-ray crystal diffraction?
The advantage of X-ray crystal diffraction lies in its ability to provide detailed atomic-level information, displaying every atom within proteins or nucleic acids and the atomic details of ligands, inhibitors, ions, and other molecules in the crystal. However, its drawback is the requirement for high-quality crystals, and the challenges associated with crystallization restrict the method's applicability in structural studies of proteins.
References
[1] Mackay JP, Landsberg MJ, Whitten AE, Bond CS. Whaddaya Know: A Guide to Uncertainty and Subjectivity in Structural Biology. Trends Biochem Sci. 2017 Feb;42(2):155-167. doi: 10.1016/j.tibs.2016.11.002. Epub 2017 Jan 12. PMID: 28089412.
[2] Rout MP, Sali A. Principles for Integrative Structural Biology Studies. Cell. 2019 May 30;177(6):1384-1403. doi: 10.1016/j.cell.2019.05.016. PMID: 31150619; PMCID: PMC6810593.
[3] Yaffe MB. X-ray crystallography and structural biology. Crit Care Med. 2005 Dec;33(12 Suppl):S435-40. doi: 10.1097/01.ccm.0000191719.66383.01. PMID: 16340415.
[4] Kermani AA. A guide to membrane protein X-ray crystallography. FEBS J. 2021 Oct;288(20):5788-5804. doi: 10.1111/febs.15676. Epub 2020 Dec 31. PMID: 33340246.
[5] Deschamps JR. X-ray crystallography of chemical compounds. Life Sci. 2010 Apr 10;86(15-16):585-9. doi: 10.1016/j.lfs.2009.02.028. Epub 2009 Mar 18. PMID: 19303027; PMCID: PMC2848913.
[6] Ilari A, Savino C. Protein structure determination by x-ray crystallography. Methods Mol Biol. 2008;452:63-87. doi: 10.1007/978-1-60327-159-2_3. PMID: 18563369.
[7] Zhu L, Chen X, Abola EE, Jing L, Liu W. Serial Crystallography for Structure-Based Drug Discovery. Trends Pharmacol Sci. 2020 Nov;41(11):830-839. doi: 10.1016/j.tips.2020.08.009. Epub 2020 Sep 16. PMID: 32950259; PMCID: PMC7572805.
[8] Schriber EA, Paley DW, Bolotovsky R, Rosenberg DJ, Sierra RG, Aquila A, Mendez D, Poitevin F, Blaschke JP, Bhowmick A, Kelly RP, Hunter M, Hayes B, Popple DC, Yeung M, Pareja-Rivera C, Lisova S, Tono K, Sugahara M, Owada S, Kuykendall T, Yao K, Schuck PJ, Solis-Ibarra D, Sauter NK, Brewster AS, Hohman JN. Chemical crystallography by serial femtosecond X-ray diffraction. Nature. 2022 Jan;601(7893):360-365. doi: 10.1038/s41586-021-04218-3. Epub 2022 Jan 19. PMID: 35046599; PMCID: PMC8770144.
[9] Ishigami I, Carbajo S, Zatsepin N, Hikita M, Conrad CE, Nelson G, Coe J, Basu S, Grant T, Seaberg MH, Sierra RG, Hunter MS, Fromme P, Fromme R, Rousseau DL, Yeh SR. Detection of a Geminate Photoproduct of Bovine Cytochrome c Oxidase by Time-Resolved Serial Femtosecond Crystallography. J Am Chem Soc. 2023 Oct 18;145(41):22305-22309. doi: 10.1021/jacs.3c07803. Epub 2023 Sep 11. PMID: 37695261.
[10] Wranik M, Weinert T, Slavov C, Masini T, Furrer A, Gaillard N, Gioia D, Ferrarotti M, James D, Glover H, Carrillo M, Kekilli D, Stipp R, Skopintsev P, Brünle S, Mühlethaler T, Beale J, Gashi D, Nass K, Ozerov D, Johnson PJM, Cirelli C, Bacellar C, Braun M, Wang M, Dworkowski F, Milne C, Cavalli A, Wachtveitl J, Steinmetz MO, Standfuss J. Watching the release of a photopharmacological drug from tubulin using time-resolved serial crystallography. Nat Commun. 2023 Feb 17;14(1):903. doi: 10.1038/s41467-023-36481-5. PMID: 36807348; PMCID: PMC9936131.
[11] Liu Z, Liu X, Yu J, Copeland L, Wang S. Novel Approach for Quantitative Characterization of Short-Range Molecular Order in Gelatinized Starch by X-ray Diffraction. Biomacromolecules. 2023 Mar 13;24(3):1267-1273. doi: 10.1021/acs.biomac.2c01314. Epub 2023 Feb 22. PMID: 36812486.
[12] Pounot K, Schirò G, Levantino M. Tracking the structural dynamics of proteins with time-resolved X-ray solution scattering. Curr Opin Struct Biol. 2023 Oct;82:102661. doi: 10.1016/j.sbi.2023.102661. Epub 2023 Aug 1. PMID: 37536065.
How to order?

