


Univariate Statistical Analysis Service
During the comparative analysis of metabolites between two sample groups, commonly employed univariate analysis methods include fold change analysis (FC analysis), the T-test, and the volcano plot, which synthesizes the prior two methodologies. This analysis visually elucidates the significance of changes in metabolite between samples, aiding in the identification of potential biomarkers (typically FC>2.0 and P value<0.05 as the sreening criteria). The volcano plot below highlights metabolites that significantly differ—those with FC>2.0 and P value<0.05 appear as red dots.
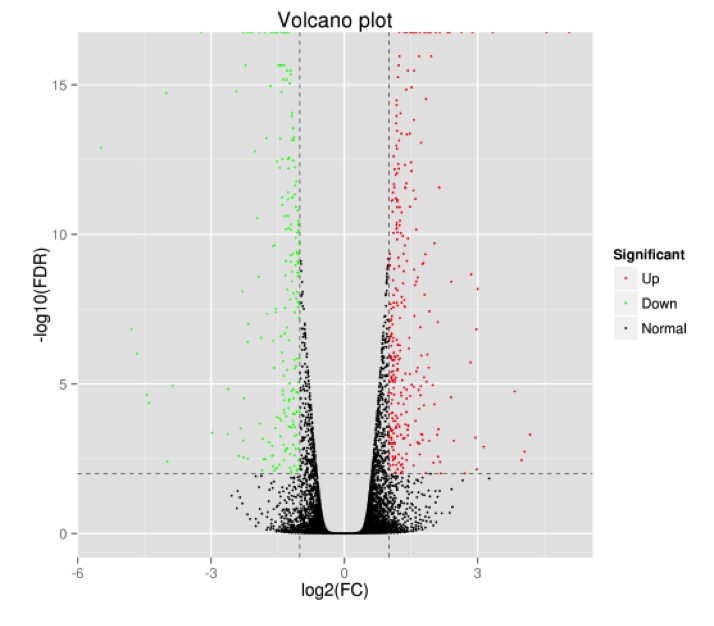
Figure 1. Volcano Plot Analysis
Note: The volcano plot results, with green and red dots indicating metabolites showing significant differences (P value<0.05).
MtoZ Biolabs identifies metabolites that exhibit significant differences and meet both multivariate (VIP>1) and univariate (FC>2.0 and P value<0.05) analysis criteria (Figure 2).
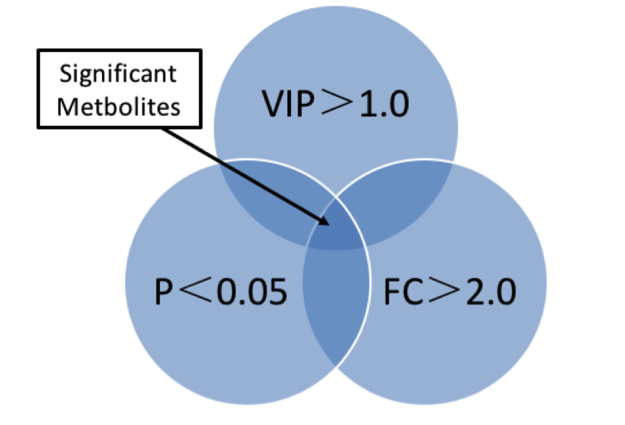
Figure 2. Metabolites with Significant Differences
How to order?

