


Single-Cell Mass Cytometry Analysis Service
Mass cytometry (CyTOF) uses specific metal isotope-labeled antibodies to mark signal molecules on and inside the cell surfaces. Cells, in the form of single-cell droplets, are atomized and then enter a high-temperature plasma to produce free atoms. A quadrupole allows only ions within a specific mass range to pass for further detection. The relative signal strengths of lanthanide metal ions are detected using time of flight-mass spectrometry (TOF-MS). Finally, data is converted into standard flow cytometry data and processed using professional data analysis software to achieve a detailed characterization of cell phenotypes and signaling networks.
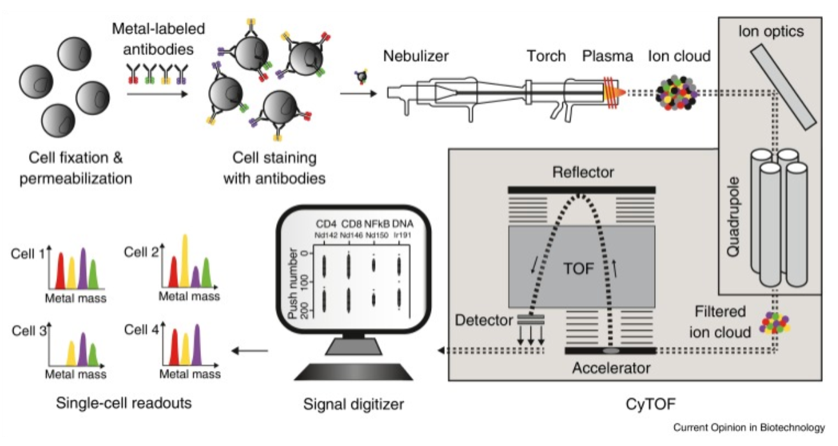 Figure 1. Workflow of CyTOF [1]
Advantages of single-cell technology include: (1) Numerous channels with minimal interference between samples, not requiring compensation. The inductively coupled plasma mass spectrometry (ICP-MS) in the mass cytometry system has a very wide atomic mass detection range (75–209 Da), theoretically allowing the simultaneous detection of hundreds of different parameters. ICP-MS has high resolution capability, which can differentiate the various metal elements used for labeling, with interference between adjacent metal channels <0.3%, essentially negligible, and no calculation compensation required. Also, the background levels of the metal elements used as labels are low in the cells, hence their signal background is very low. Currently, there are about 50 commercial metal labels available. (2) Compatible with diverse data processing methods. The increase in the number of channels in CyTOF at the single-cell level leads to an exponential increase in information, which allows for various dimension reduction and clustering processes to mine useful biological information. (3) Large analysis volume and low cost. CyTOF can analyze at least 105 cells per sample (single sample) and its cost is lower than that of single-cell RNA seq.
CyTOF can precisely immunophenotype cell populations, and perform comprehensive analysis of intracellular signaling networks. It can examine functional relationships between cell subgroups, and conduct high-throughput multiparameter detection on a large number of samples. It is widely used in research areas such as hematopoiesis, immunology, stem cells, cancer, infection, drug screening, and vaccine development, with numerous related research papers published. Combining metal label technology with other techniques can also lead to new applications. Besides conventional proteins, CyTOF can also be used to measure post-translational modifications (PTMs) of proteins, cell viability, cell size, mRNA transcript levels, DNA synthesis rates, and protease activity.
MtoZ Biolabs has a comprehensive single-cell mass cytometry analysis platform, which includes complete data storage, data retrieval, and data analysis capabilities. Services offered by the platform include various tissue dissociation, single-cell suspension preparation, antibody panel design marking, mass cytometry sample preprocessing, mass cytometry data collection, and can perform protein expression analysis at the single-cell level. Our team can assist in designing mass cytometry antibody panels, explore optimal experimental conditions through multi-gradient experiments, collect high-quality mass cytometry data, and decipher cell subgroup variation information through bioinformatics analysis. MtoZ Biolabs can provide tissue dissociation, sample preparation, metal isotope antibody labeling, mass cytometry data collection, and experimental data analysis services, offering a one-stop solution for quantitative single-cell mass cytometry problems.
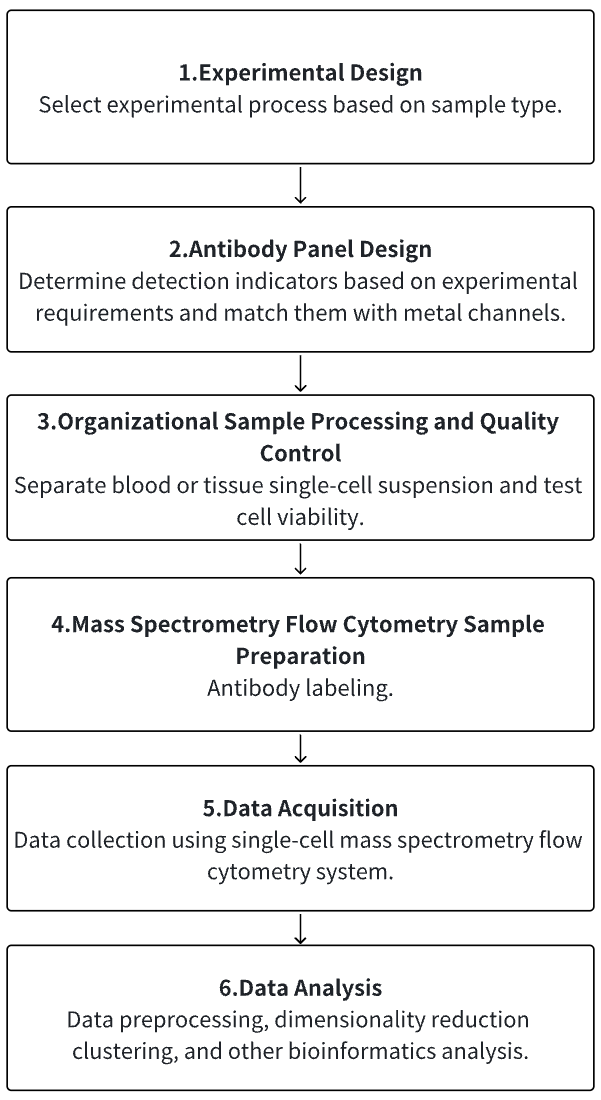
The mass cytometry experimental process can be divided into four main parts: panel design, sample preparation, data acquisition on the instrument, and data analysis.
1. Antibody Panel Design
Before determining the detection indicators, it is necessary to have a clear understanding of the entire experiment's purpose. Once the research objective is clarified, detection indicators can be determined. The most common approach to CyTOF is to compare the changes in the body's immune system under different conditions, i.e., the abundance and subgroup differences of immune cells. There are three common methods to understand the common cell surface markers of immune cells, which are antibody company websites, marker databases, and literature research.
The main difference between CyTOF and traditional flow cytometry is the use of metal elements and their isotopes as antibody labels. The main elements used as labels are rare earth elements, inert elements, post-transition metals, and halogens, which have low content in cells and do not cause high background.
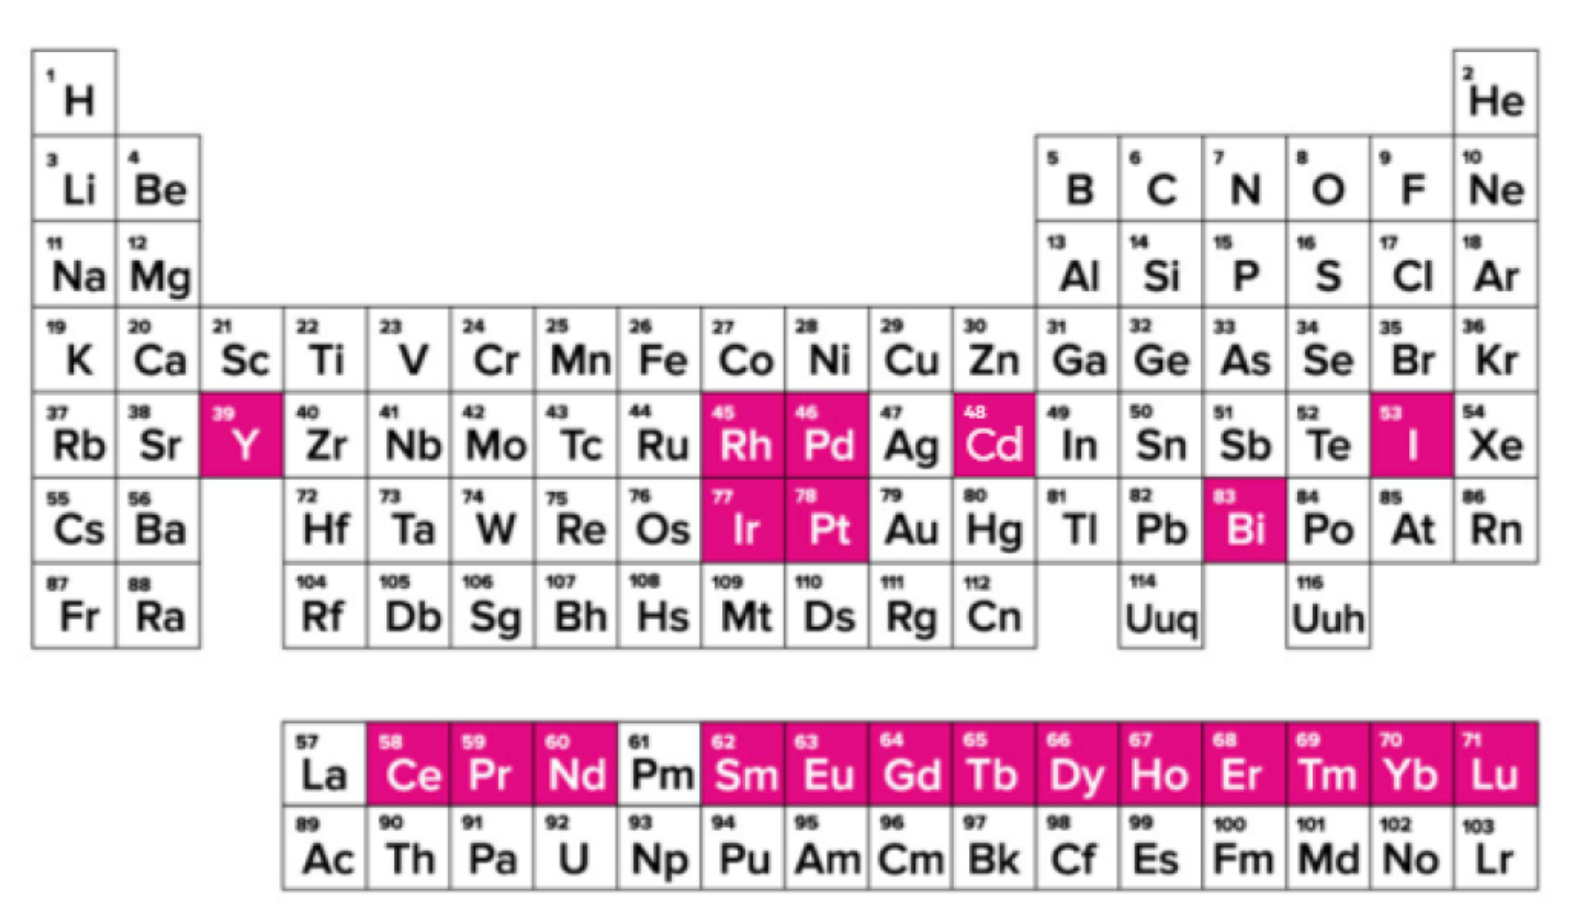 Figure 2. Distribution of Metal Elements Used in CyTOF
CyTOF has different sensitivities for various metal. For example, Helios theoretically can detect up to 135 metal channels, ranging from 75 to 209 amu. However, the ion optics in the Helios instrument are adjusted to be most sensitive to metals in the range of 159-169 Da. The sensitivity of specific mass channels is proportional to the transmission efficiency of the corresponding isotopes through Helios's ion optics system. For instance, the amount of 159 Tb delivered to the detector by Helios is approximately three times that of 139 Tb.
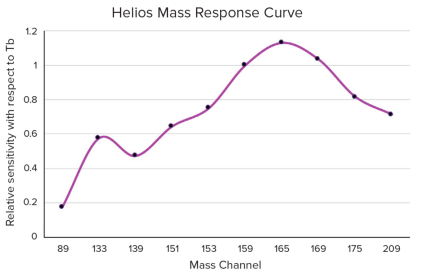
Figure 3. Helios Sensitivity Response Curve to Different Metal Masses
By appropriately matching detection indicators with metal channels, it is possible to minimize interference between channels and achieve optimal detection results. Like traditional flow cytometry, antigens with different expression abundances follow the "strong-weak match" principle, i.e., high abundance antigens choose lower or medium sensitivity isotope labels; low abundance antigens choose higher sensitivity channels, such as 153–176Ln and 209Bi; Channels that are or are rarely interfered with by other channels are selected. For high abundance antigens: lower sensitivity labels (89Y, 102–110Pd, 113In, 115In) or medium sensitivity labels (139–152Ln) are chosen and channels that do not or rarely interfere with other channels are selected; In the process of optimizing antibody concentration, using the lowest necessary antibody concentration to reduce interference with other channels. Additionally, these rules-antigens that are mutually exclusive (such as CD4 and CD8) can be arranged in interfering channels, and co-expressed antigens (such as CD3 and CD4) are arranged in non-interfering channels-should be considered.
2. Sample Preparation
Samples required for mass spectrometry flow cytometry are single-cell suspensions. If using blood samples, it is necessary to isolate PBMC; if using tissue samples, tissue dissociation is required. Extraction of PBMC: It is recommended to use heparin or citrate as anticoagulants to extract whole blood and separate PBMCs and granulocytes through a density gradient centrifugation of Ficoll or Percoll within 4 hours, paying attention to removing red blood cells as much as possible.
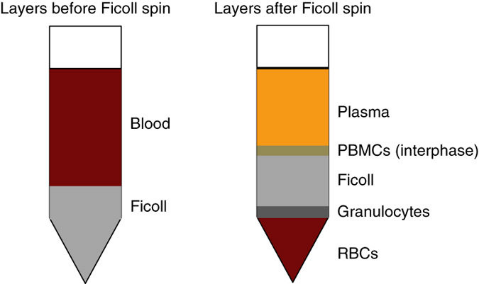
Figure 4. Density Gradient Centrifugation for PBMC Preparation
Tissue dissociation. Different tissues have different dissociation methods. You can use tissue dissociation kits from various companies for experiments, or refer to literature. Tissue dissection, enzymatic digestion, and mechanical dissociation are three important steps of the degradation of the extracellular matrix and the separation of single cells. The three key parameters to evaluate following enzymatic and mechanical dissociation are: (1) cell viability of solid tissues; (2) an absence of cell debris; (3) an absence of aggregates.
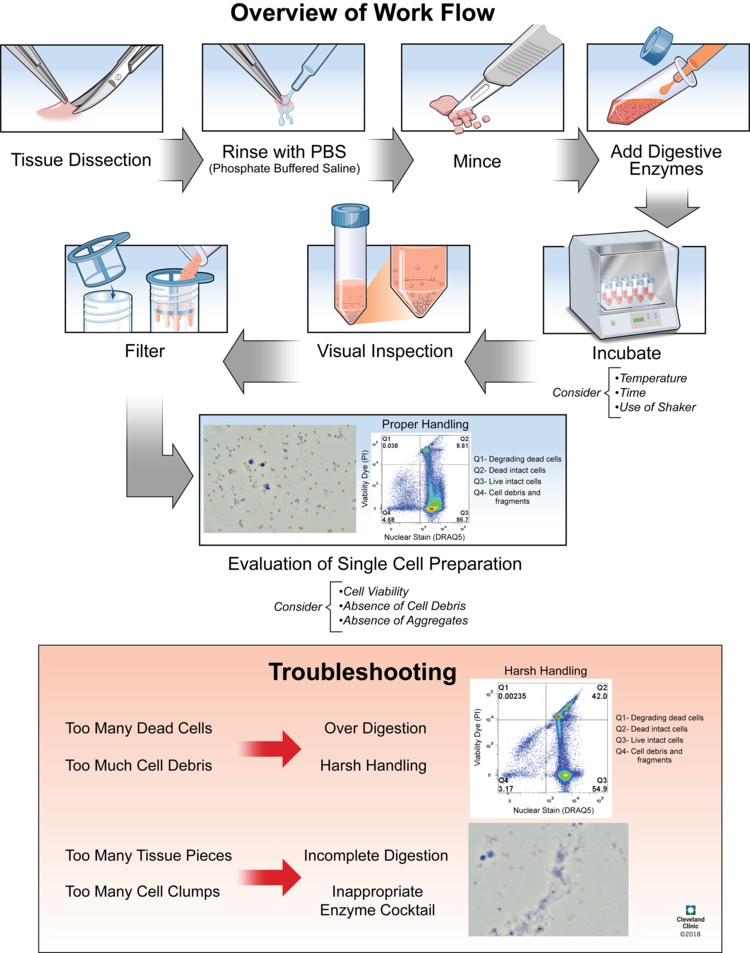 Figure 5. Tissue Dissociation Experimental Process [2]
After separating the single-cell suspension, staining through cisplatin , Fc receptor blocking, surface antibody staining, fixation and permeabilization, intracellular antibody staining, DNA intercalating agent Ir staining, and cell washing, data collection can be performed on the machine.
3. Mass Spectrometry Flow Cytometry Analysis
Mass spectrometry flow cytometry analysis can be divided into five main processes: sample introduction and ionization, ion transport through vacuum interface and high-pass ion optics, ion separation in the time-of-flight (TOF) mass analyzer, data acquisition and processing.
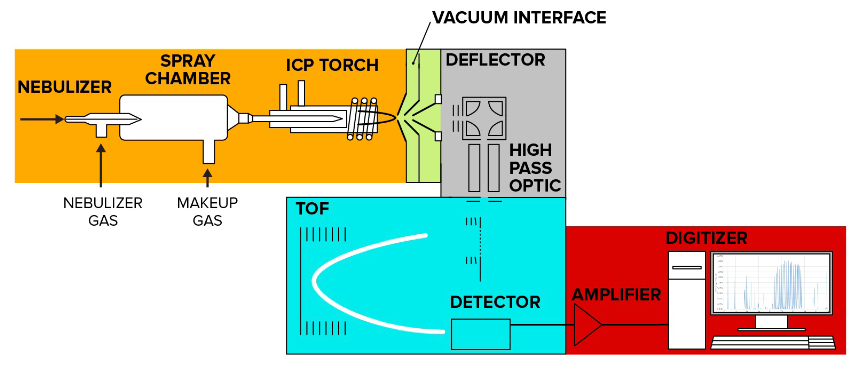 Figure 6. Mass Spectrometry Flow Helios System Schematic, Colors Represent Main Processes
After the mass spectrometry flow sample preparation is completed, the cell suspension enters the instrument in the form of small droplets through a nebulizer with each droplet containing one cell. The droplets containing cells then enter the spray chamber, where high temperature causes part of the aerosol to vaporize and be directed to the ICP source. The entire process uses argon gas to provide a gaseous environment and pressure. During the cell suspension atomization stage, a device known as a nebulizer is needed. The nebulizer includes an inner capillary carrying the liquid sample and an outer chamber carrying argon gas. Argon gas flows at about 0.15-0.35 L/min in the outer chamber, and the sample moves under atmospheric pressure in the capillary. When the sample flows out from the tip, shear force applied by the nebulizer gas breaks it into fine aerosol droplets entering the spray chamber.
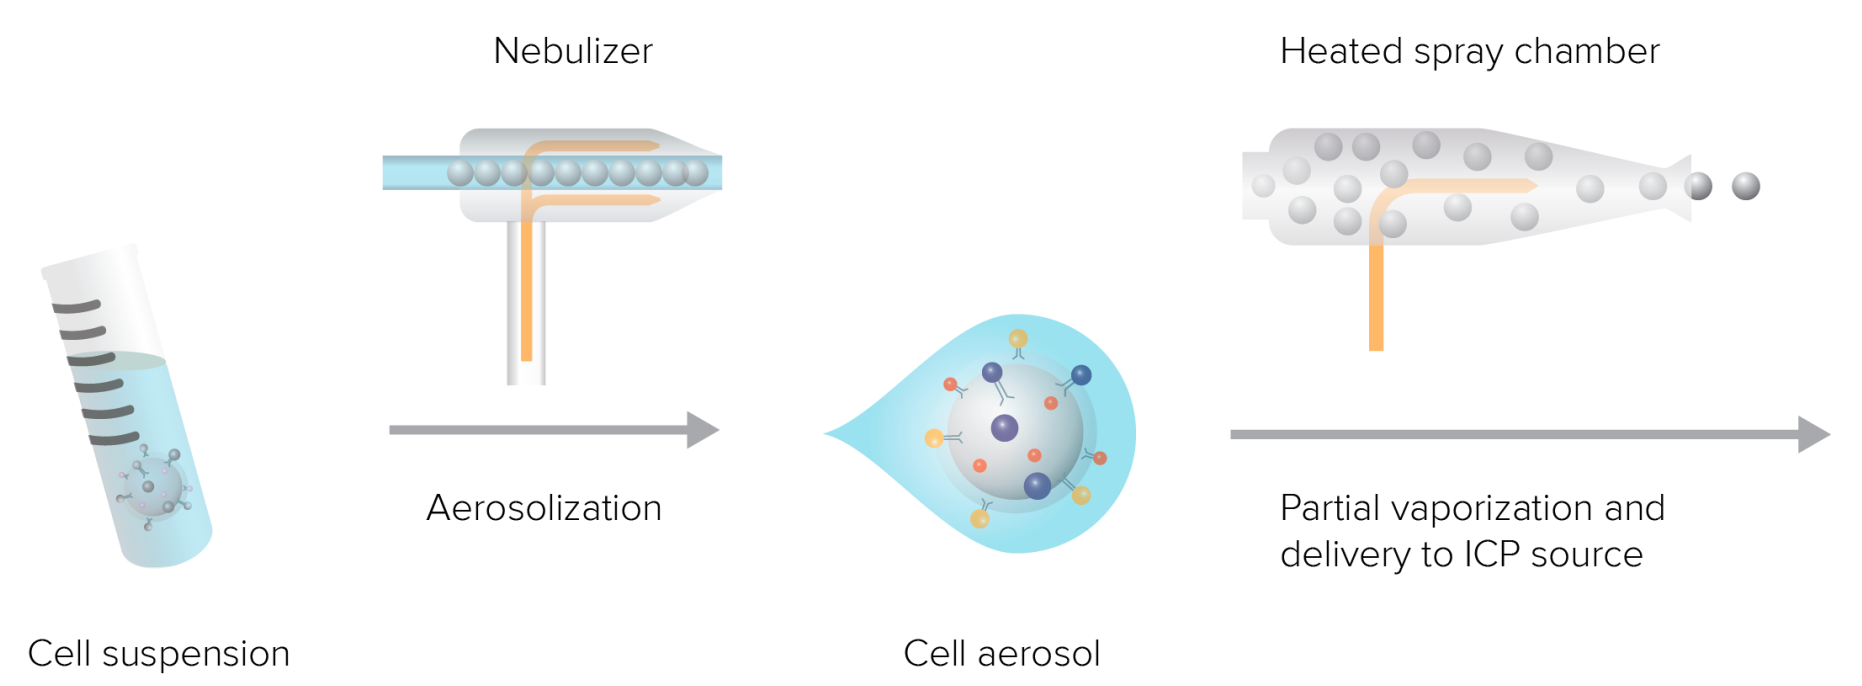 Figure 7. The Sample Introduction System Turns the Liquid Sample into Droplets Containing Single Cells and Aerosolizes, and Introduces Them into the ICP Source for Ionization
The spray chamber has an add-on device, which can heat temperature up to 200 ˚C, where high-flow heated argon gas partially evaporates the aerosol droplets to reduce their size, so the droplets can enter the plasma torch for ionization. The plasma torch consists of three concentric chambers: a fused assembly of two concentric quartz tubes–and a quartz sample injector tube. The outermost chamber has an argon plasma gas flowing at 18 L/min that is ignited to form plasma. The central chamber contains argon auxiliary gas flowing at ~1 L/min that is used to change the position of the base of the plasma relative to the sample injector. The innermost chamber transmits argon stream and sample aerosol to the center of the plasma. All components are installed within an induction coil, whose current is generated by radio frequency (RF), and this current creates the electromagnetic field that maintains the plasma.
The ion cloud leaving the vacuum interface contains low-mass ions, which are not analytically meaningful and such abundance is likely to damage the detector. The quadrupole consists of four rods with direct current (DC) and radio frequency (RF) voltages, with opposite pairs of electrodes at equal potential. When a set of ions with different mass-to-charge (m/z) ratios enters the electric field formed by the DC and RF voltages, only ions that meet specific conditions stably oscillate through the quadrupole. The high-pass ion opic removes unwanted low-mass argon and other ions from the ion beam, and an ion stream containing isotopic probe ion (>75 amu) is guided through this channel into the time-of-flight mass spectrometer. The ion cloud coming out of the ion optics system is sent to the time-of-flight (TOF) mass analyzer, which separates ions based on the m/z. After the ions enter the TOF analyzer's accelerator, pulses of several hundred volts orthogonally accelerate the accumulated ions to the reflector at 13 μs intervals (frequency of 76.8 kHz), the reflector redirects the ions back to the detector. Regardless of the ion's initial position or energy, the electric field configuration in the accelerator and reflector focuses the ions into a tight time-resolved band.
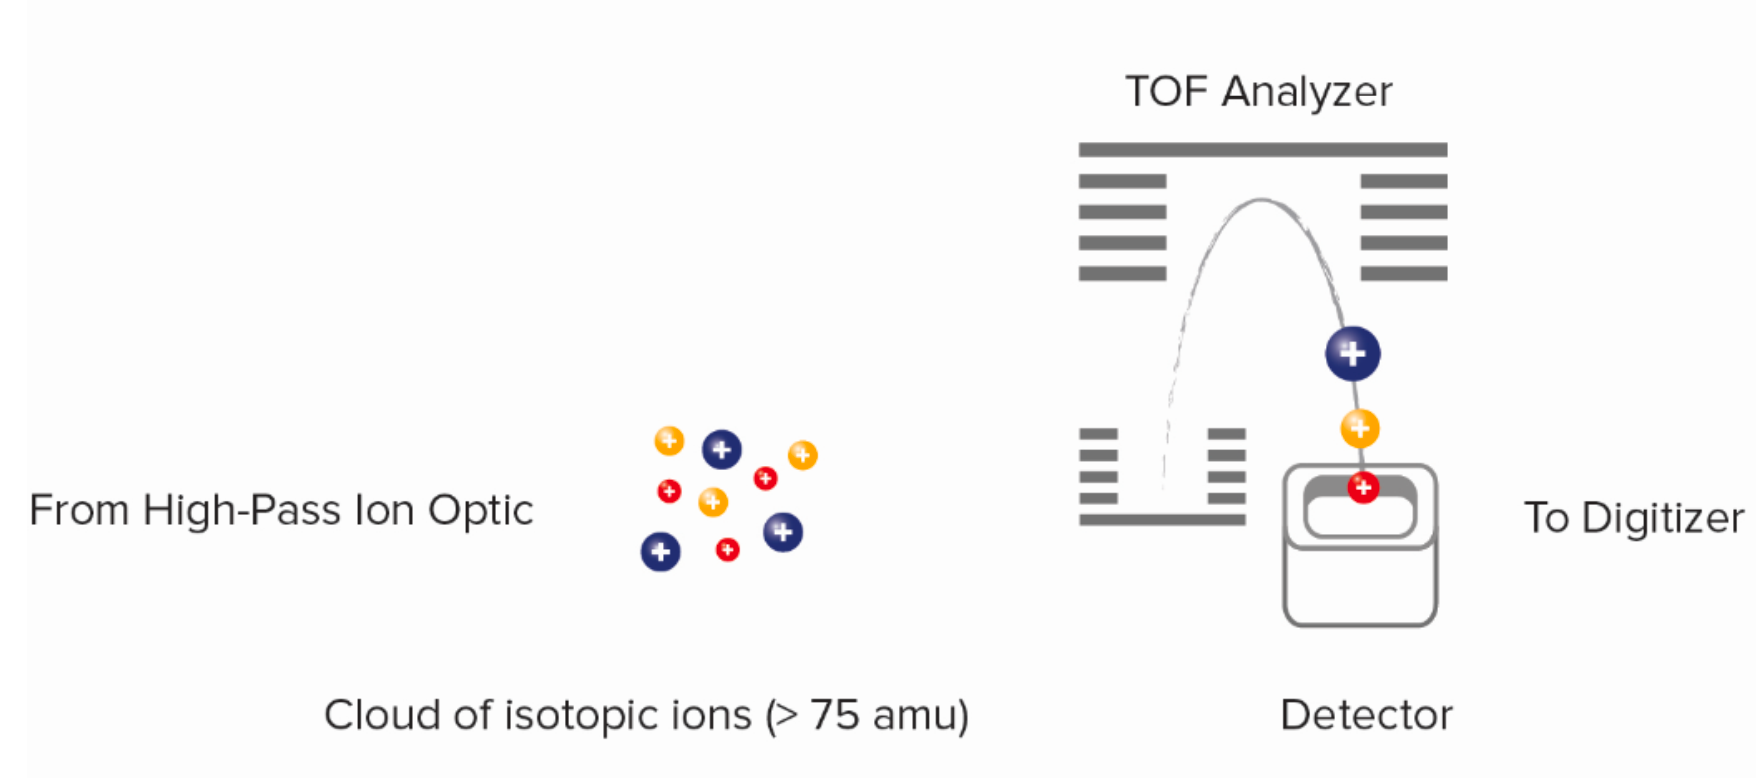 Figure 8. Time-of-Flight (TOF) Mass Analysis Schematic
Mass spectrometry flow data collection requires dual data collection, which means that each channel must collect pulse counts and intensity values. Mass cytometry software maps the entire data range on a single dual-signal scale, with units being the actual count of particles hitting the detector. To achieve this, two things need to be done. First, a dual counting coefficient is applied, converting analog intensity to actual count using the following formula.

Second, a dual swithover threshold is applied, using pulse counts below this threshold and converted analog intensity counts above this threshold. Using the dual count scale, mass spectrometry flow can quantify each cell's bound antibody labels over a wide range of signal inputs. Data are saved in text (.txt) and flow cytometer standard (.fcs) 3.0 format for data analysis in compatible software programs.
4. Data Analysis
Compared to traditional flow cytometry, the characteristic of mass spectrometry flow is that it contains a huge amount of information. Mass spectrometry flow provides high-dimensional data that can examine a large number of cell subpopulations in a single sample, studying the heterogeneity within known cell groups and identifying cell group changes related to clinical status. According to these data, the similarity of target cell groups to known reference groups can be assessed and changes in the physiological state of cell groups can be determined to identify intermediate states or branching points in developmental pathways.
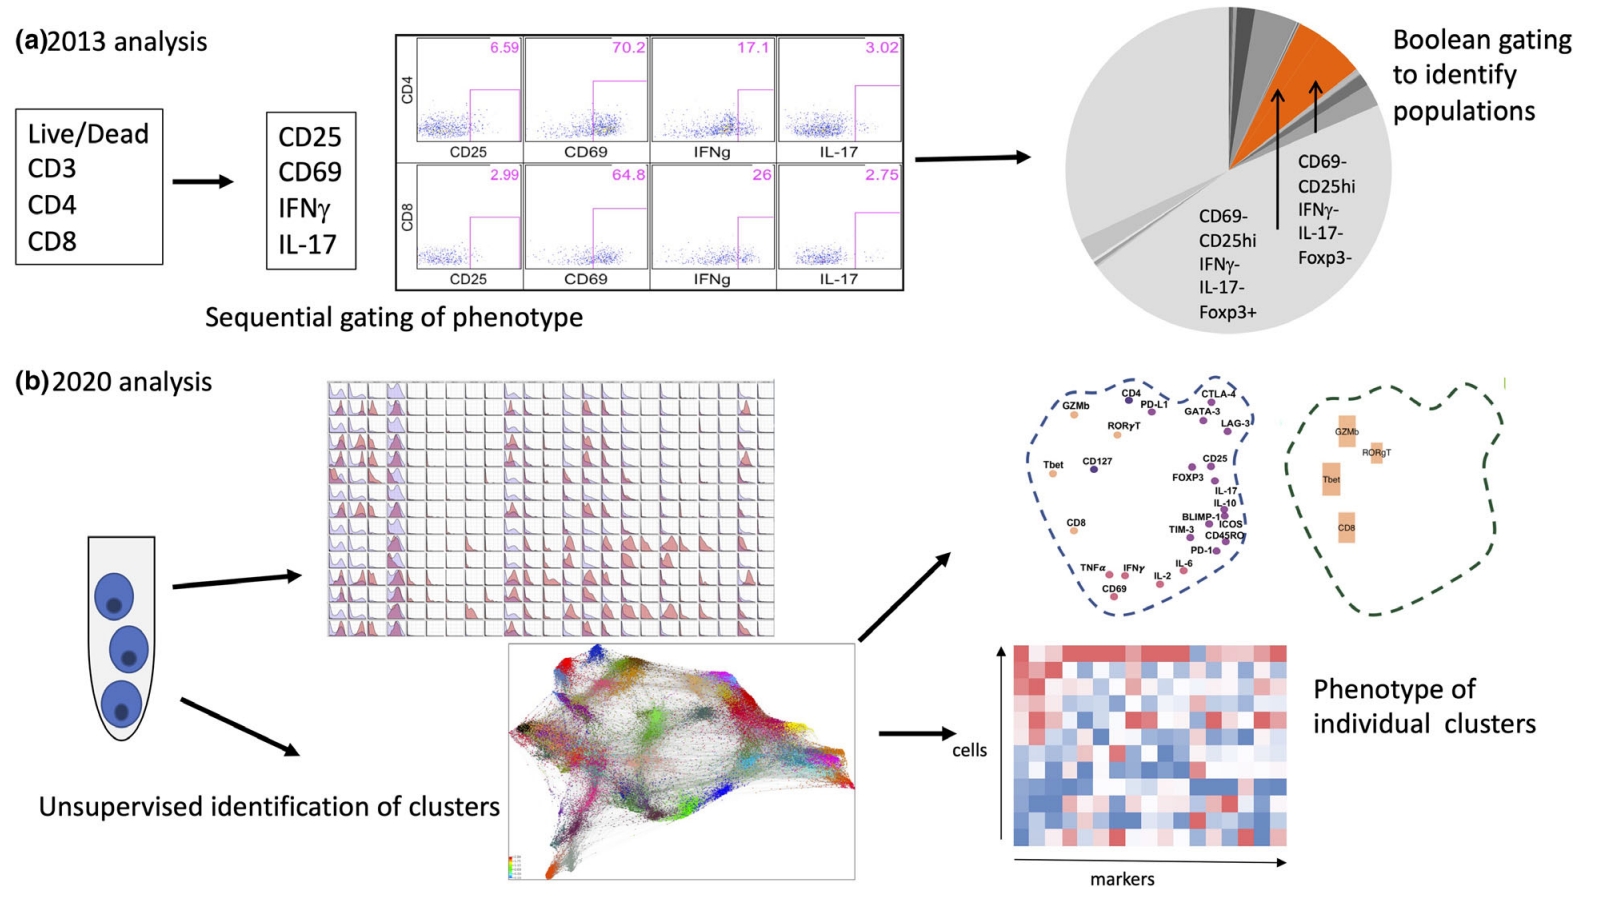 Figure 9. Comparison of Mass Spectrometry Flow and Traditional Flow Data Analysis [3]
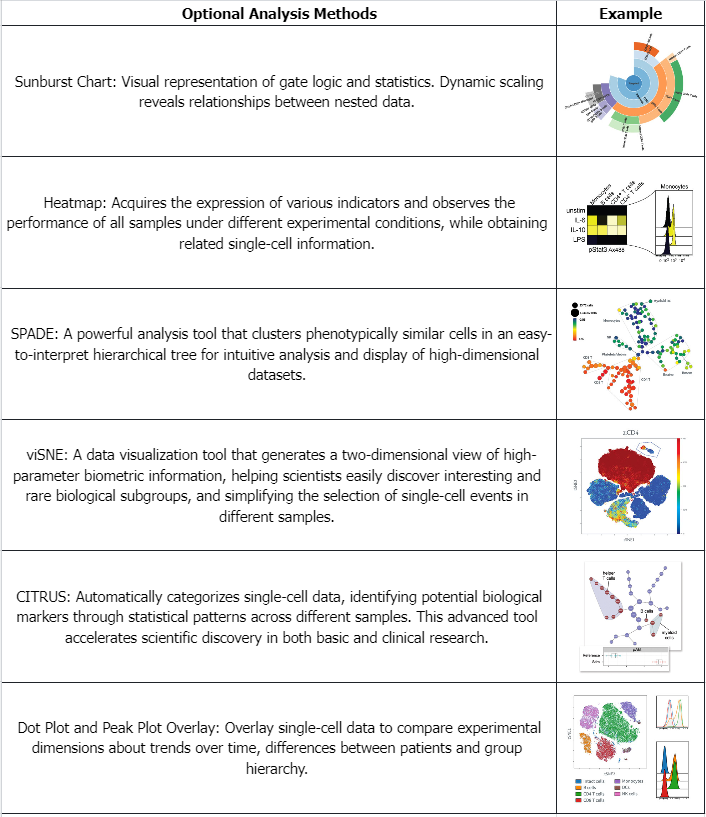
Table 1. Examples of Commonly Used Data Analysis Methods for Mass Spectrometry Flow Cytometry Data
Analysis Workflow
1. According to the Experimental Requirements to Determine the Experimental Process
2. Antibody Panel Design
3. Tissue Dissociation, Separation of Single-Cell Suspensions
4. Mass Cytometry Sample Preparation
5. Mass Cytometry Data Collection
6. Data Retrieval and Analysis
Service Advantages
1. Provision of Various Tissue Sample Processing Services
2. Assistance in Designing Antibody Panels
3. High-Confidence, High-Precision Mass Spectrometry Detection
4. Comprehensive Bioinformatics Analysis
Sample Results
1. Tumor Cell Heterogeneity Map
Besides immune cells in tumors, CyTOF can also detect tumor cell heterogeneity by setting related indicators. In 2021, the team of Wendy J. Fantl at Stanford University analyzed tumors from 22 cases of high-grade serous ovarian cancer (HGSOC), taking over 800,000 live single cells for CyTOF. Applying multiparametric CyTOF at the single-cell level to dissect HGSOC, the goal was to identify clinically relevant cell subgroups associated with tumor progression and drug resistance, potentially offering new therapeutic targets.
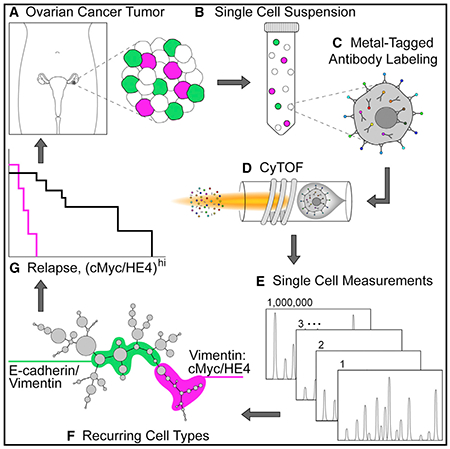 Figure 10. Experimental Design of Heterogeneity in High-Grade Serous Ovarian Tumors [4]
2. Tissue Characterization
In 2017, Asya Rolls' team from the Technion – Israel Institute of Technology used 44 cell surface markers to characterize the immune populations of naive mouse brains to map the high-dimensional single-cell characterization of brain immune compartments. The article identified various immune cell subgroups in brain compartments and characterized their unique features by comparing their compositions to those in peripheral blood. This extensive analysis revealed previously uncharacterized infiltrating immune populations, which demonstrated the range and richness of phenotypes of resident myeloid cells and infiltrating cells and identified CD44 as a marker distinguishing resident immune cells in the naive brain from infiltrating immune cells. In 2018, the team published a procedure for CyTOF of brain immune cells in Nature Protocol. The article provided a step-by-step description of CyTOF for analyzing mouse brain compartment. The different stages of the process included brain perfusion, extraction of brain tissue and its dissociation into single-cell suspensions, followed by cell staining with metal-tagged antibodies, sample reading with a mass cytometer, and data analysis with SPADE and viSNE. This process takes <5 hours (excluding data analysis) and can be used to study modifications in brain's immune populations under normal and pathological conditions.
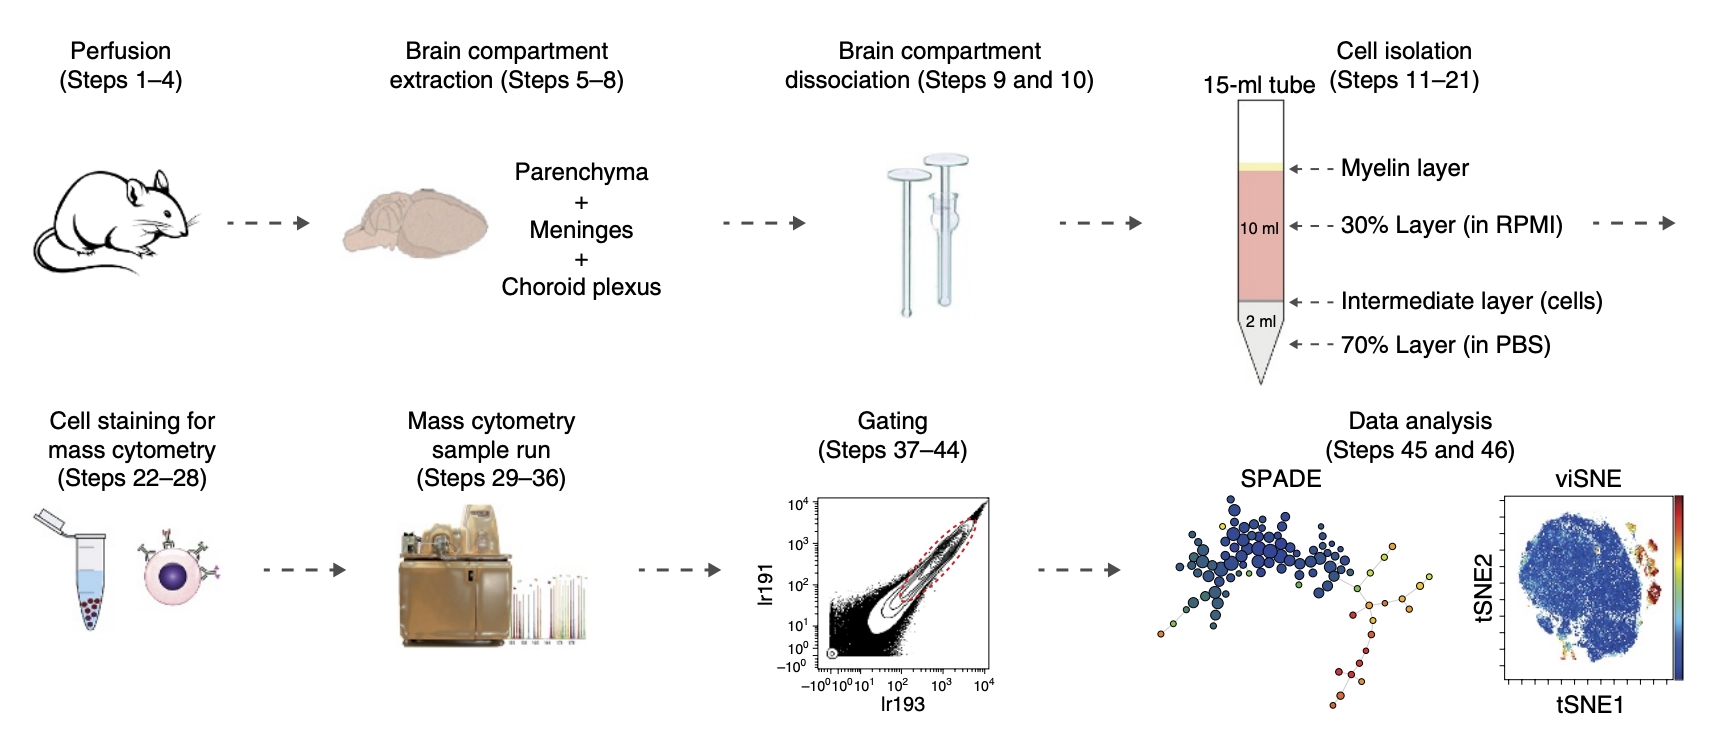 Figure 11. Experimental Schematic Diagram of Using CyTOF to Analyze the Ventricles of the Brain [5]
3. Viral Infection
A virus is a type of non-cellular microorganism. It primarily has the following characteristics: tiny individuals, possessing only one type of nucleic acid, either DNA or RNA; strictly replicates inside living cells (eukaryotic or prokaryotic); has a receptor-binding protein that binds to the virus receptor on the surface of sensitive cells, thereby infecting the cell. Outside the cell, the virus is in a dormant state, essentially similar to non-living material. Once the virus enters a living cell, it exerts its biological activity. Because viruses lack a complete enzyme system, cannot synthesize their own components, and lack ribosomes, their parasitic nature requires invasion into susceptible host cells, relying on the host cell's enzyme systems, raw materials, and energy to replicate their nucleic acids and use the host cell's ribosomes to translate their proteins. This mode of proliferation is called "replication." The replication process of viruses involves adsorption, penetration, uncoating, biosynthesis, and assembly release, also known as the replication cycle. The body's antiviral immune response includes non-specific and specific immunity. The former refers to the body's natural resistance to initial virus infections before acquired immunity is developed, mainly involving mononuclear phagocytes, natural killer cells, and interferons. The latter refers to antibody-mediated and cell-mediated antiviral actions. CyTOF and high-dimensional analysis tools can deeply evaluate virus infection-induced remodeling of specific host antigens and reveal characteristics of infected cells that enable them to survive and persist, as well as immune cells that can respond and possibly control viral replication. Thus, CyTOF plays a critical role in research on various viral infections such as HIV, COVID-19, hepatitis B, and herpes zoster.
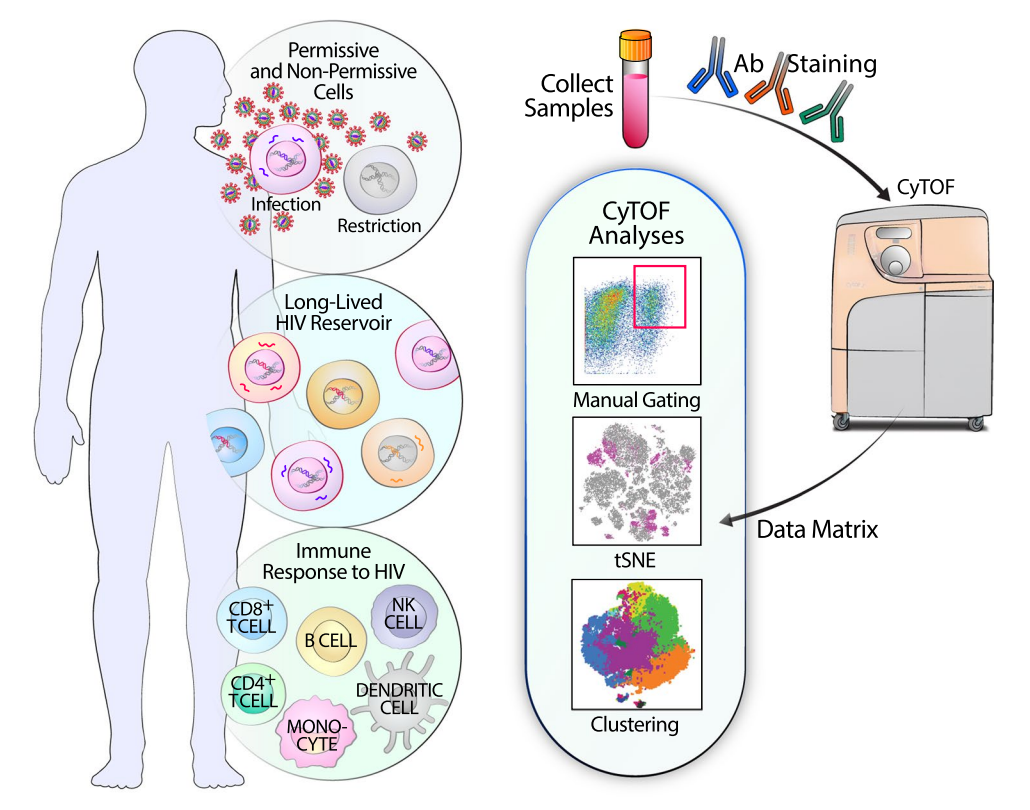
Figure 12. The Application of CyTOF in HIV Research [6]
Sample Submission Requirements
1. Cell Number Should be Greater than 3x10⁶, with a Viability Greater than 80%
2. Try to Avoid Impurity Contamination
Services at MtoZ Biolabs
1. The Complete Experimental Procedure
2. Relevant Instrument Parameters
3. Original Experimental Data
4. Data Analysis Reports
Applications
1. Investigating the Impact of Drugs on Immune Cell Phenotypes
CyTOF can also multiplex signal detection with deep phenotyping and other functional assessments, which allows researchers to evaluate complex mixtures of primary cells isolated from blood or other tissues. As therapeutic methods and targets transition to clinical development, it is expected to be a key contribution to translational pharmacology. Tacrolimus (FK506) and rapamycin (RAPA) are widely used for long-term immunosuppression after organ transplantation. However, the accumulative drug effect on the recipient's immune system is not well understood. In 2021, a study reported the impact of 3-year FK506 or RAPA treatment after renal transplantation on the human immune system. The study recruited 30 patients and collected their peripheral blood. 29 metal isotope-tagged monoclonal antibodies was designed to acquire a global overview of the T-cell network in the immune system and simultaneous downstream intracellular signaling cascades under CD3/CD28 stimulation.
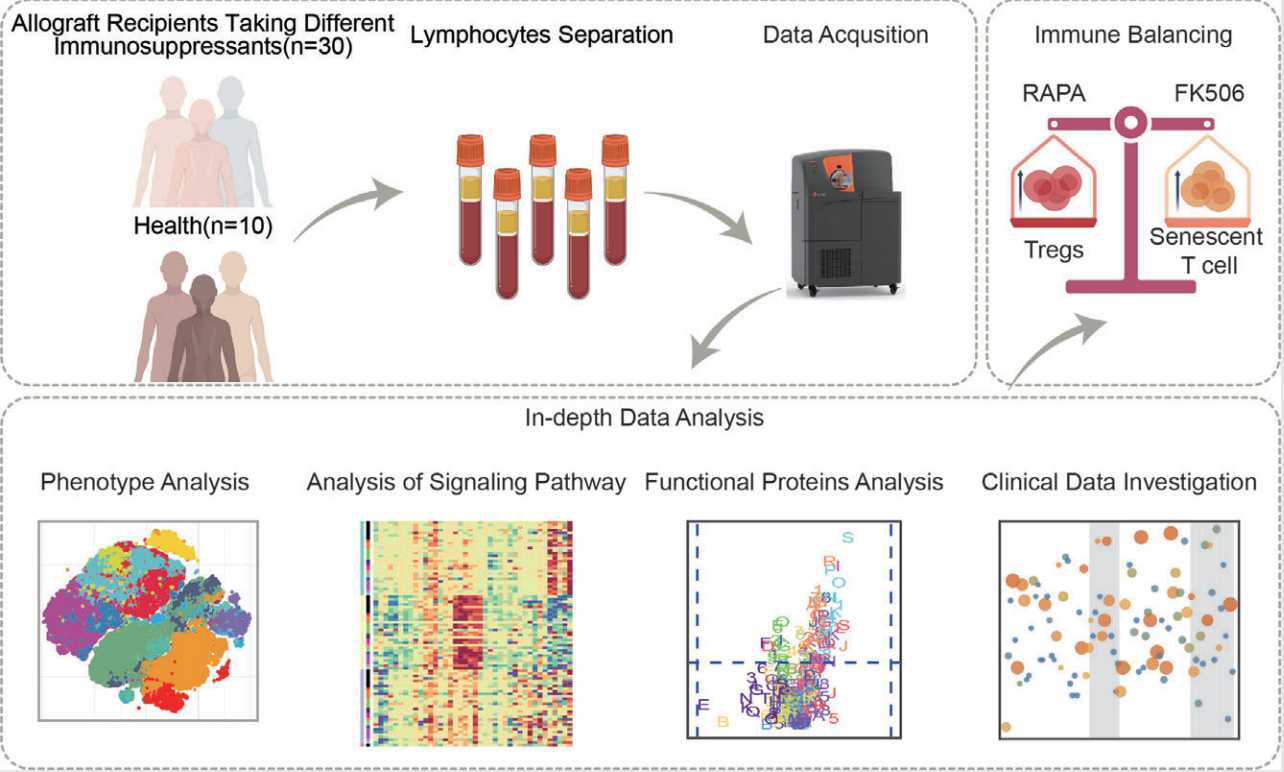 Figure 13. Deep Phenotypic Analysis of T Cell Populations in Patients Undergoing Long-Term Treatment with Tacrolimus and Rapamycin [7]
2. Investigating Mechanisms of Drug Action
Although flow cytometry remains a staple for targeted screening within compound libraries, CyTOF is applied to critically delineate the action mechanisms of promising therapeutic lead compounds identified through initial screenings. For example, in the context of kinase inhibitor screening, CyTOF can be deployed to measure both the kinetic parameters of the primary target and the non-specific effects on other kinases, as well as pathway alterations up- and downstream of the target, thereby providing a thorough pharmacological profile of the inhibitors. AXL, belonging to the Tyro3-AXL-Mer (TAM) receptor tyrosine kinases (RTKs), is a promising therapeutic target for lung cancer. A study which utilized a CyTOF panel of 21 antibodies to identify AXL, SMAD4/TGF-β, and JAK1-STAT3 signaling components, characteristics of cancer stemness and epithelial to mesenchymal transition (EMT). CyTOF was employed to assess intra- and inter-tumor heterogeneity, which stratified lung tumor subpopulations based on AXL signaling as a potential targeting strategy. This study showed that single-cell proteomic profiling of treatment-naïve lung tumors, coupled with ex vivo testing of patient-derived organoids (PDOs), identified continuous AXL, TGF-β and JAK1-STAT3 signal activation in select tumors that may be targeted by combined AXL-JAK1 inhibition.
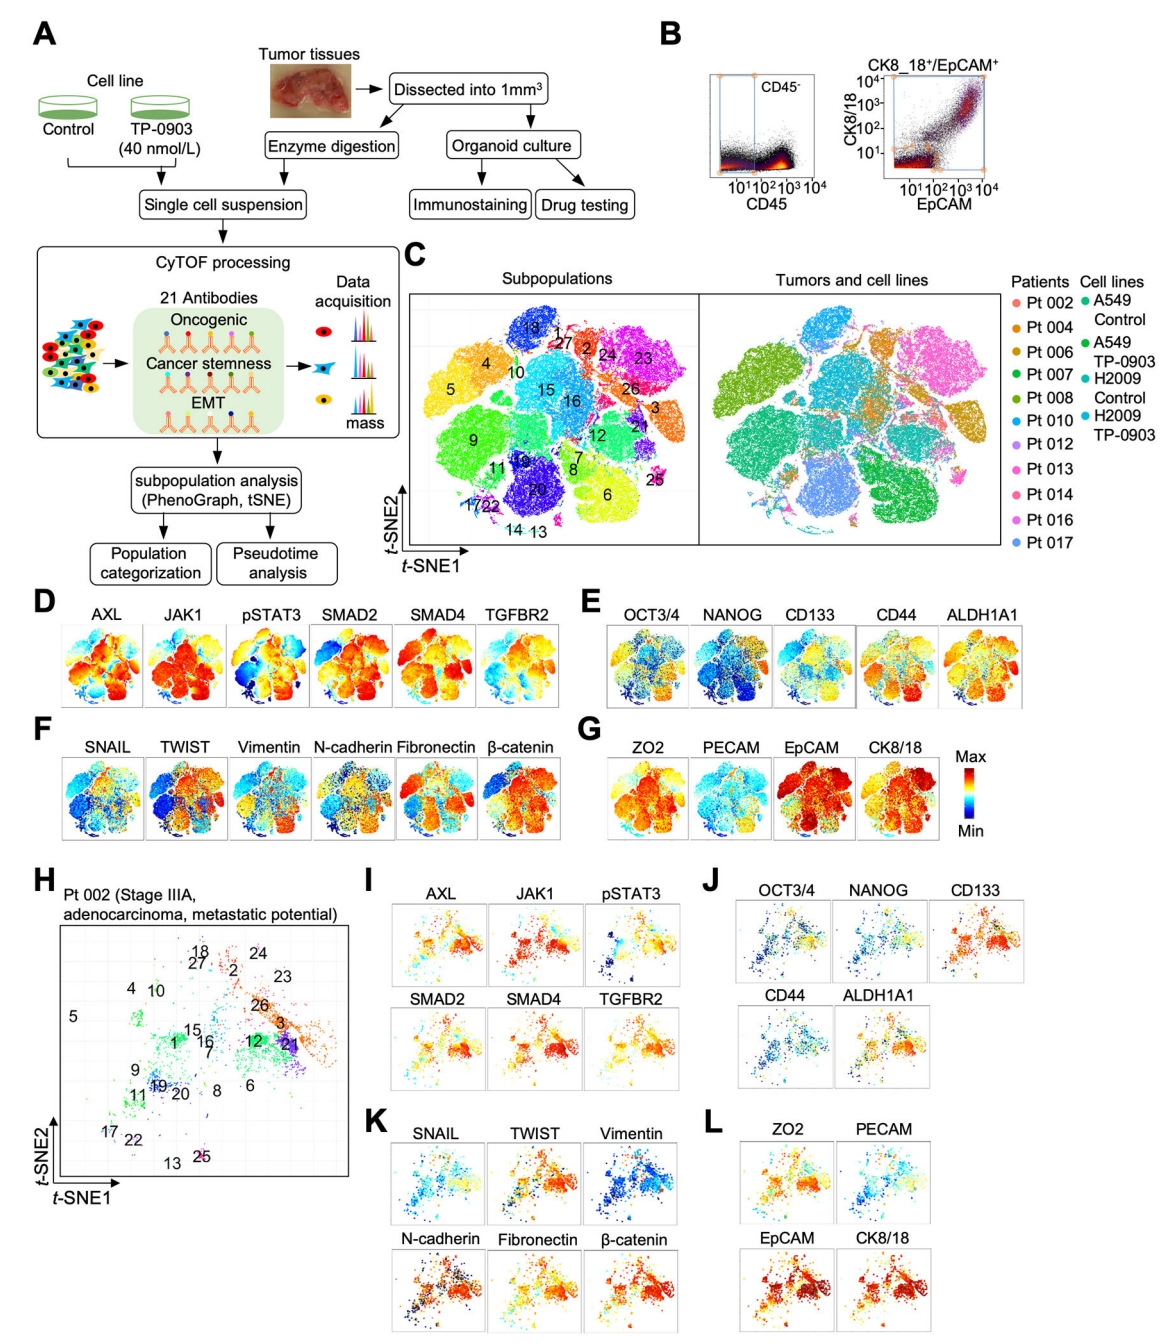
Figure 14. Mass Cytometry Analysis of Oncogenic Signaling, Cancer Stemness, and EMT in Lung Tumors and Cell Lines [8]
FAQ
Q1: How to prepare samples for CyTOF?
Blood samples should be processed to isolate peripheral blood mononuclear cells using density gradient centrifugation, while tissue samples should be dissociated to obtain single-cell suspensions. If immediate analysis is not feasible, cells should be cryopreserved. For mass cytometry labeling, the number of cell should exceed 3 million with viability above 80%.
References
[1] Di Palma S, Bodenmiller B. Unraveling cell populations in tumors by single-cell mass cytometry. Curr Opin Biotechnol. 2015 Feb;31:122-9. doi: 10.1016/j.copbio.2014.07.004. Epub 2014 Aug 11. PMID: 25123841.
[2] Reichard A, Asosingh K. Best Practices for Preparing a Single Cell Suspension from Solid Tissues for Flow Cytometry. Cytometry A. 2019 Feb;95(2):219-226. doi: 10.1002/cyto.a.23690. Epub 2018 Dec 6. PMID: 30523671; PMCID: PMC6375754.
[3] Marsh-Wakefield FM, Mitchell AJ, Norton SE, Ashhurst TM, Leman JK, Roberts JM, Harte JE, McGuire HM, Kemp RA. Making the most of high-dimensional cytometry data. Immunol Cell Biol. 2021 Aug;99(7):680-696. doi: 10.1111/imcb.12456. Epub 2021 May 4. PMID: 33797774; PMCID: PMC8453896.
[4] Gonzalez VD, Samusik N, Chen TJ, Savig ES, Aghaeepour N, Quigley DA, Huang YW, Giangarrà V, Borowsky AD, Hubbard NE, Chen SY, Han G, Ashworth A, Kipps TJ, Berek JS, Nolan GP, Fantl WJ. Commonly Occurring Cell Subsets in High-Grade Serous Ovarian Tumors Identified by Single-Cell Mass Cytometry. Cell Rep. 2018 Feb 13;22(7):1875-1888. doi: 10.1016/j.celrep.2018.01.053. PMID: 29444438; PMCID: PMC8556706.
[5] Korin B, Dubovik T, Rolls A. Mass cytometry analysis of immune cells in the brain. Nat Protoc. 2018 Feb;13(2):377-391. doi: 10.1038/nprot.2017.155. Epub 2018 Jan 25. PMID: 29370157.
[6] George AF, Roan NR. Advances in HIV Research Using Mass Cytometry. Curr HIV/AIDS Rep. 2023 Apr;20(2):76-85. doi: 10.1007/s11904-023-00649-x. Epub 2023 Jan 23. PMID: 36689119; PMCID: PMC9869313.
[7] Li Y, An H, Shen C, Wang B, Zhang T, Hong Y, Jiang H, Zhou P, Ding X. Deep phenotyping of T cell populations under long-term treatment of tacrolimus and rapamycin in patients receiving renal transplantations by mass cytometry. Clin Transl Med. 2021 Nov;11(11):e629. doi: 10.1002/ctm2.629. PMID: 34841735; PMCID: PMC8574956.
[8] Taverna JA, Hung CN, DeArmond DT, Chen M, Lin CL, Osmulski PA, Gaczynska ME, Wang CM, Lucio ND, Chou CW, Chen CL, Nazarullah A, Lampkin SR, Qiu L, Bearss DJ, Warner S, Whatcott CJ, Mouritsen L, Wade M, Weitman S, Mesa RA, Kirma NB, Chao WT, Huang TH. Single-Cell Proteomic Profiling Identifies Combined AXL and JAK1 Inhibition as a Novel Therapeutic Strategy for Lung Cancer. Cancer Res. 2020 Apr 1;80(7):1551-1563. doi: 10.1158/0008-5472.CAN-19-3183. Epub 2020 Jan 28. PMID: 31992541; PMCID: PMC7127959.
How to order?

