


Quantitative Proteomics Profiling Service
Mass spectrometry (MS)-based proteomics is the primary sensitive analytical tool that can be used to determine the abundance of proteins and peptides in complex biological mixtures. Quantitative results can be used to understand different biological and pathological processes. Quantitative proteomics combined with liquid chromatography-mass spectrometry (LC-MS) is always the main method for the quantification of proteins and peptides. Existing quantitative methods in the proteomic range can be divided into label-free proteomics (LFQ) and label-based proteomics.
1. LFQ
LFQ does not involve operations such as chemical isotope labeling of samples and requires individual analysis of each sample by LC-MS/MS. Relative quantification of proteins is done by comparing the chromatographic peak areas of peptides or by spectral counting in protein identification. Advances in data processing and acquisition, such as normalization, maximal peptide ratio extraction (MaxLFQ), and the use of programs like MaxQuant or OpenMS, have shown that LFQ can effectively identify proteins and peptides.
However, LFQ has some limitations compared to chemical labeling methods, as a poor reproducibility is observed between replicates of sampling. The non-repeatable result may be due to differences in samples' preparation, variations in sample injection, and running only one sample at a time which needs longer runtime for large batches of samples, leading to sample degradation. It is also prone to sample loss, changes in ionization efficiency, and shifts in retention times among the same samples.
2. Chemical Labeling in Proteomics (Based on MS1)
One type of chemical isotopic labeling is the Isotope-Coded Affinity Tag (ICAT), including stable isotope labeling of amino acids (SILAC) in cell culture, dimethyl labeling, 18O labeling, etc. These methods introduce minor mass differences through isotopic isomers at the protein or peptide level, which can be distinguished in the MS1 precursor spectra. This method allows simultaneous analysis of multiple samples, as the peptides labeled with different tags can be identified by comparing the peptide signal intensity ratios between heavy/light peptide pairs detected by MS, and further protein evaluations can be performed. Additionally, merging samples before LC-MS analysis can reduce sample variation, signal variation, and overall analysis time in the entire workflow.
Chemical isotopic labeling has limitations in multiple detection, as the more he number of labeled samples analyzed at the MS1 level, the more complex the spectra become due to each sample producing multiple peaks. Different methods commonly require a minimal mass shift of 4 Da to prevent overlapping isotopic envelope. Therefore, tags with a larger mass number are requirred to overcome the overlap, which may lower overall identification numbers yet, or high-resolution mass spectrometers can be applied to differentiate small mass differences.
(1) Stable Isotope Labeling by Amino Acids in Cell Culture (SILAC)
The SILAC proteomics workflow starts at the cellular level. A medium that meets nutritional needs is chosen for cell culture. Specifically, mammalian cells must be supplemented with at least 13 essential amino acids for growth: arginine, cysteine, glutamine, histidine, isoleucine, leucine, lysine, methionine, phenylalanine, threonine, tryptophan, tyrosine, and valine. At the start of the experiment, cells growing in ordinary medium are transferred to specially formulated SILAC medium, in which all natural isotopes of specific amino acids (usually lysine and arginine) are replaced with light-labeled 12C14N lysine and 12C14N arginine or heavy-labeled 13C15N lysine and 13C15N arginine. Cells are cultured in this specific medium for at least five generations to ensure complete incorporation of the label during protein synthesis. After the incorporation of isotope labeling by amino acids, cells can be lysed to extract proteins. These proteins can be analyzed through top-down protein analysis, or be digested into peptides to be analyzed through bottom-up proteomics.
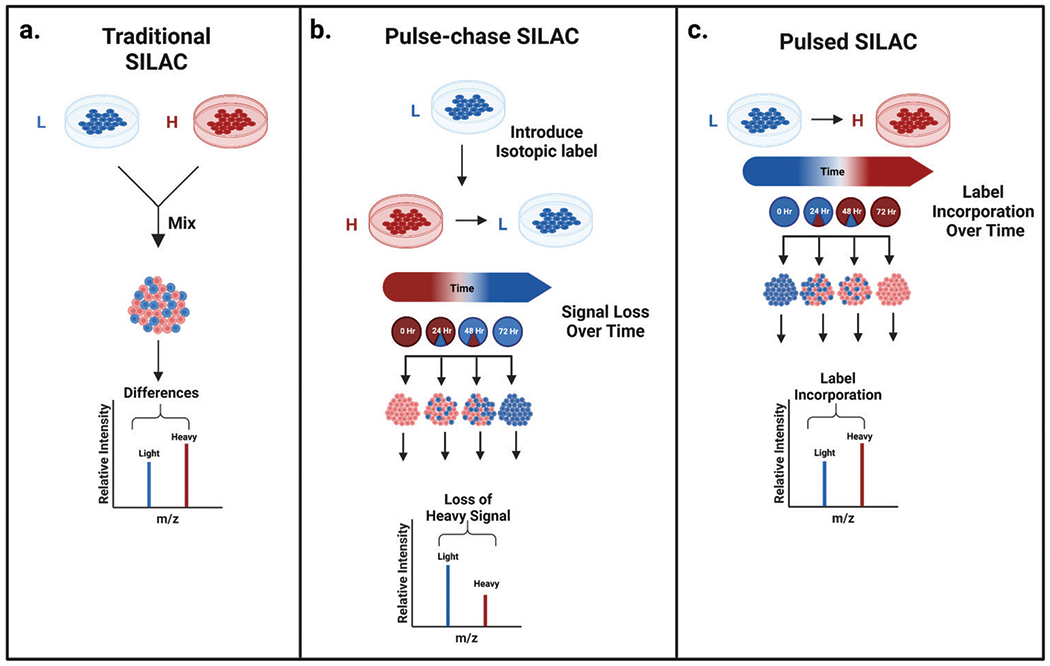
Figure 1. Common Stable Isotope Labeling Strategies [3]
3. Chemical Labeling Proteomics (Based on MS2)
Another type is: isotope-labeled quantification based on MS2, which overcomes some limitations of quantification methods based on MS1 by labeling the same peptides with isotopic labels. The isotopic labels are not marked by mass difference methods such as SILAC and dimethyl labeling, but by labels in each channel marked with similar physical and chemical properties and the same mass number with different isotopic configurations.
The standard design of isobaric tags consists of three elements: (1) a reactive group targeting specific functional group or residues of peptides; (2) an isotopically balanced group to ensure that the total mass number of tags based on reporter ion mass is the same; (3) a reporter group containing discrete isotopes of different channels to ensure relative quantification between samples. Peptides with the same m/z at the MS1 level will appear as a composite peak, and its fragmentation will produce peptide fragment ions and reporter ion peaks. The relative intensity of reporter ions is distinguished at lower m/z values, not interfering with higher mass peptide backbone fragment ions and allowing the determination of relative quantification information. Peptide fragment ions are used for resolving amino acid sequences and for protein identification based on their sequence. Isobaric tags have high multiplexing detection capabilities, as samples are mixed before injected into LC-MS/MS, which improves throughput and reproducibility, and reduces variability without increasing spectral complexity.
(1) TMT and iTRAQ
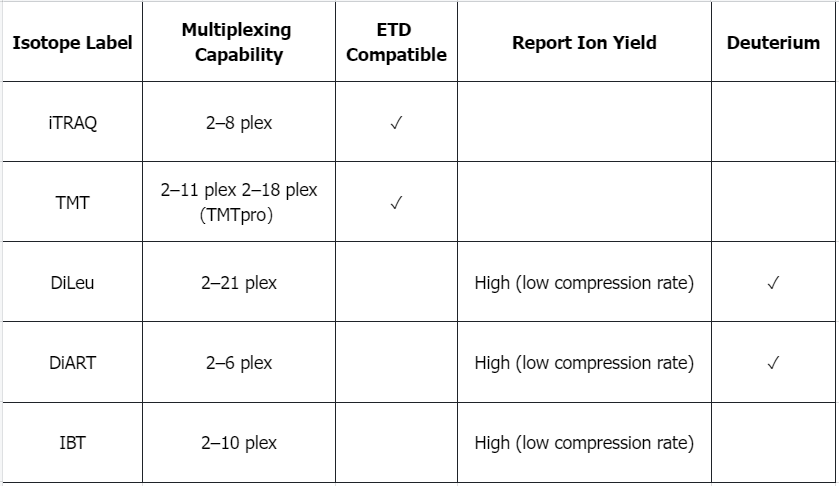
The first example of isobaric tags is Tandem Mass Tag (TMT). TMT are isobaric chemical tags that provide multi-flux options for relative proteomics quantification, capable of simultaneously analyzing up to 18 protein samples from cell, tissue, or fluid. The tag consists of an MS/MS reporter group, a spacer arm, and an amine-reactive group. The concept of TMT was initially designed as a duplex tag, which can cleavage at the N-terminal proline residue. This mode can obtain peptide backbone and reporter ion generation through collision-induced dissociation (CID) for relative quantification by tagging the free N-terminus as well as the ε-amino of lysine residues. TMT 2-plex (2-tag) labels have two different versions, the main difference being that the second version has a proline-enhancing group but retains the same reporter ion group and amine-reactive group at the C-terminus.
Reducing reporter ion to containing a dimethylpiperazine and a balancing group can make its structure more compact while retaining the N-hydroxysuccinimide (NHS) as the reactive group, TMT reagents have increased from 2-plex to 6-plex (6-tag). TMT 6-plex also eliminates deuterium ions of 13C and 15N isotopes to eliminate the deuterium effect causing retention time shifts. The system utilizes the 6.3 mDa mass shift difference produced by neutron binding energy difference between C and N isotopes to identify m/z 126-131 reporter masses at 50k resolution. TMT 10-plex (10-tag) has further improvement and can adapt to electron transfer dissociation (ETD) by replacing heavy nitrogen with heavy carbon. TMT 18-plex (18-tag) could be a success if all N and C atom in the structure is replaced by isotopic variants.
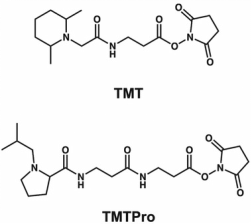
Figure 2. Chemical Structures of TMT and TMTPro [2]
The labeling strategy for isobaric tags for relative and absolute quantification (iTRAQ) was established after the 4-tag TMT. iTRAQ retains the the same NHS as TMT but opts for a smaller carbonyl balancing group (m/z 28-31) and a N-methylpiperazine reporter ion group (m/z 114-117). Its m/z reaches up to 145. Compared to TMT and TMTpro, which only use 13C and 15N isotopes, iTRAQ structurally does not have any deuterium ions but an 18O on the balancing group. Currently, iTRAQ has expanded to an 8-tag virsion, with reporter ion masses ranging from m/z 113-121.
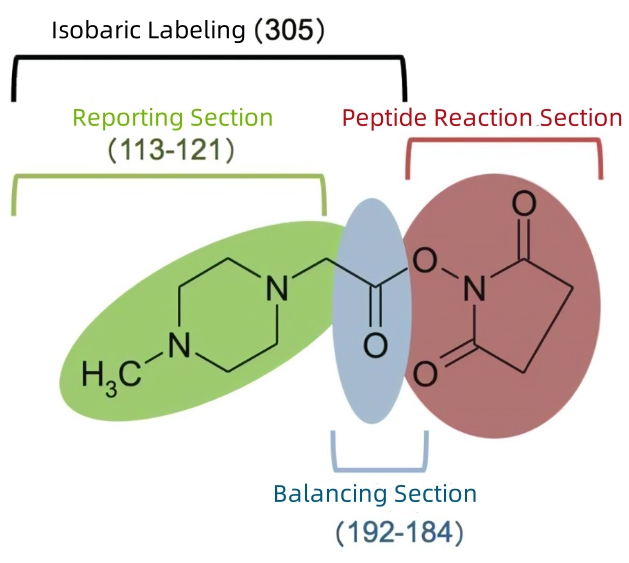
Figure 3. Chemical Structure of iTRAQ
(2) DiLeu
N, N-dimethylleucine (DiLeu) is a recently developed isobaric tag, an alternative to commercially available TMT and iTRAQ reagents. Initially, DiLeu was a 4-tag label used for MS2 isotope labeling identification, with reporter ions ranging from m/z 115-118 and a mass shift of 145. Its structure consists of a dimethylated leucine as the reporter group, a carbonyl balancing group, and a reactive group with triazine ester amine at its C-terminal. One of the main differences compared to other isobaric tags is its inclusion of a triazine ester for the reactive group. Due to the structure of the dimethylated reporter ions, DiLeu-labeled peptides can produce stronger reporter ions signals compared to that labeled with iTRAQ. DiLeu also helps better peptide backbone fragmentation and has lower overall collision energy compared to other tags. Other advantages of DiLeu include lower costs for synthesizing different channels, high label yields of up to 80% to 90%, no need for custom reagents for synthesis, and maintainance in high labeling efficiency and accurate quantification of proteins and peptides. However, a current limitation of the DiLeu labeling strategy is the relatively low coverage due to sample loss caused by a purification through strong cation exchange (SCX) to remove excess labeling reagents. Labeling reagents left may also cause signal suppression for low-abundance proteins and peptides.
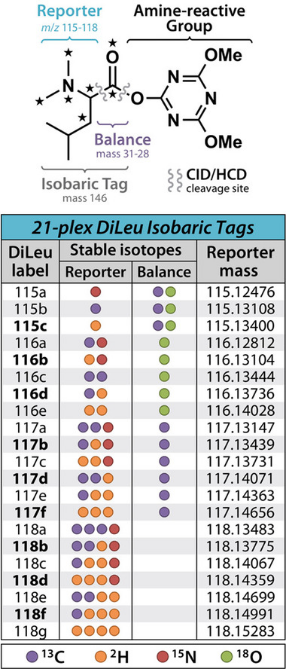
Figure 4. Chemical Structure of DiLeu [2]
(3) DiART and IBT
Another alternative to commercial isotopic tags is the deuterium isobaric amine reactive tag (DiART). DiART contains an NHS similar to TMT and iTRAQ, a β-alanine balancing group, and an N,N-dimethylleucine reporter ion group ( m/z 114-119)similar to DiLeu, with a 6-tag capability. DiART has stronger reporter ions signals and a higher signal-to-noise ratio (S/N) and lower compression ratio when Compared to iTRAQ. Isobaric tags (IBT) is another alternative to isotopic tags. Structurally, IBT is similar to DiART, while the β-alanine balancing group is replaced with alanine in its structure since the cost of isotopic labeling of alanine is lower. Although it does not incorporate 2H and 18O isotopes to avoid deuterium chromatographic shifts its structure still resembles that of DiLeu. IBT is also activated differently, using TSTU (O-(N-Succinimidyl)-1,1,3,3-tetramethyluronium tetrafluoroborate) as the NHS amine-reactive part.
(4) Non-Conventional Tags
In addition to the above tags, other new isotopic tags have been developed, which can be referred to as unconventional tags compared to the standard pattern of reporter genes, balance, and amine-reactive groups.
① The concept of combinatorial isobaric mass tag (CMT) is that each isotopic tag will produce two independent reporter ions from fragmentation, with m/z ranging from 126-128 and 172-175. This tag has a 28-plex capacity.
② Isobaric peptide terminal labeling (IPTL) occurs at the lysine residue, then is succinylated with a variant of succinic anhydride, thereby producing different fragment ions, which can be compared through the intensity of protein and peptide b and y ions. Since its first report, multiplexing has been increased to a 7-tag system by data software optimization and minimizing spectral complexity.
③ Easily abstractable sulfoxide-based isobaric-tag (EASI-tag). The tag design includes an NHS amine-reactive group, a balancing group, and a neutral loss group at the sulfoxide site to enhance dissociation efficiency. This combined with asymmetric isolation windows suppressing adjacent peaks and lowering the energy required for fragmentation makes it an attractive alternative for accurate, sensitive 6-tag quantification.
④ Similar to EASI tags, acetylalanine glycine (Ac-AG) tags have been developed as a new tag based on peptide-coupled reporter ion with an improvement in ionization efficiency, and are also usable for DIA.
4. Targeted Quantification Method
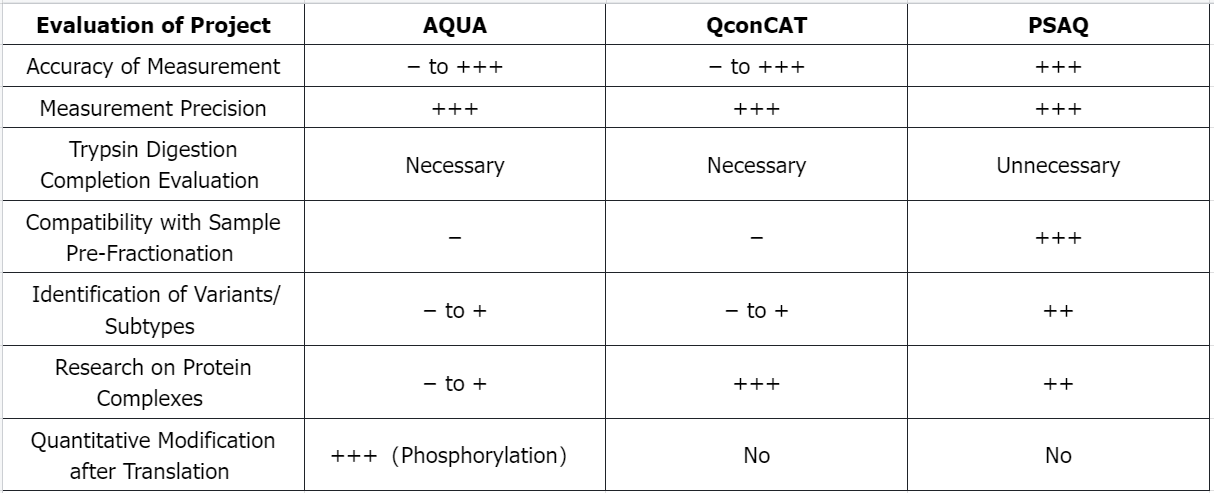
The labeling method has higher accuracy and precision, but it has limitations in multi-step sample preparation, need higher costs and higher sample requirements. Recent methods, such as absolute quantification (AQUA) or multiple reaction monitoring (MRM), peptide segment concatemers (concatamers of Q peptides, QconCATs), protein standard absolute quantification (PSAQ), and stable isotope standards and capture by anti-peptide antibodies (SISCAPA) have addressed some of these limitations.
(1) AQUA
Absolute quantification (AQUA) is a targeted quantitative proteomics technique in which labeled AQUA peptides known concentration is combied with sample proteins, followed by analysis using a triple quadrupole (QQQ) mass spectrometer to provide absolute quantification information of the sample protein by comparing the concentration of the sample peptide to the AQUA peptide. The experimental procedure mainly includes: selecting AQUA peptides by the means of bioinformatics; checking the suitability of corresponding natural peptides; synthesizing AQUA peptides; optimizing mass spectrometry parameters depends on retention time and ionization; determining the lower limit of quantitation (LLOQ) and lower limit of detection (LLOD); adding AQUA peptides to the sample before or after digestion; mass spectrometric analysis; and using software and statistical tools for absolute quantification.
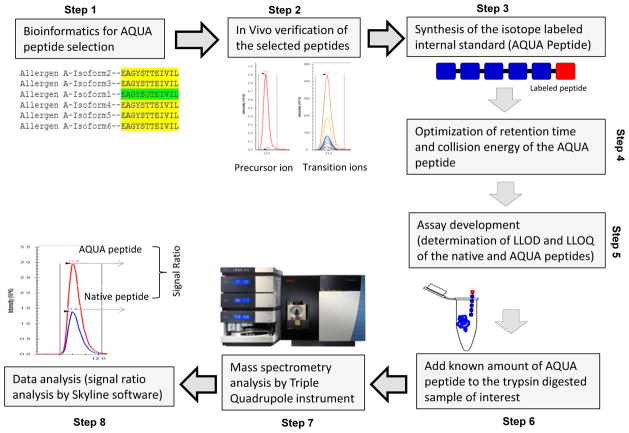
Figure 5. AQUA Method Step Diagram [4]
(2) QconCATs
QconCAT is an artificial protein composed of connected peptides. Each QconCAT is a protein, the product of a synthetic gene, which is a linear concatenation of peptides (usually trypsin, but of course, other proteases with different specificities can be used). In terms of protein primary sequence, the order of the peptides does not matter. After expressing the labeled QconCAT, complete digestion will produce a set of stoichiometrically labeled standards, representing the amount of the analyte protein, which we call quantum-type peptides. During the expression of QconCAT, stable isotopes (such as 13C, 15N) are incorporated into the protein product. Before protein breakdown, isotope-labeled QconCAT is added to samples to generate labeled and unlabeled peptide segments for mass spectrometric detection. Based on the mass spectrometric signal ratio of unlabeled peptide ions to labeled peptide ions and the known concentration of added QconCAT, the protein in the sample can be quantified.
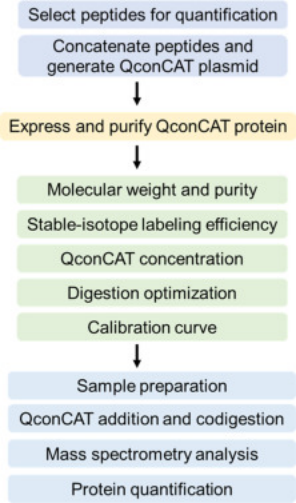
Figure 6. QconCATs Method Step Diagram [5]
(3) PSAQ
Considering the wide dynamic range of protein in biological samples, pre-separation of samples is usually necessary to sensitively detect low-abundance proteins. The ideal internal standard for absolute quantification of specific proteins should be completely identical to the target analyte, not only in the LC-MS/MS analysis but also in all pre-analytical sample processing. Therefore, PSAQ has been taken into account. PSAQ standards are divided into two categories according to their isotope labeling methods: (1) uniformly labeled proteins with 15N; (2) standards labeled on specific amino acids, usually suitable for bottom-up MS. Typically, PSAQ standards are produced in the form of recombinant fusion proteins and purified with tags.
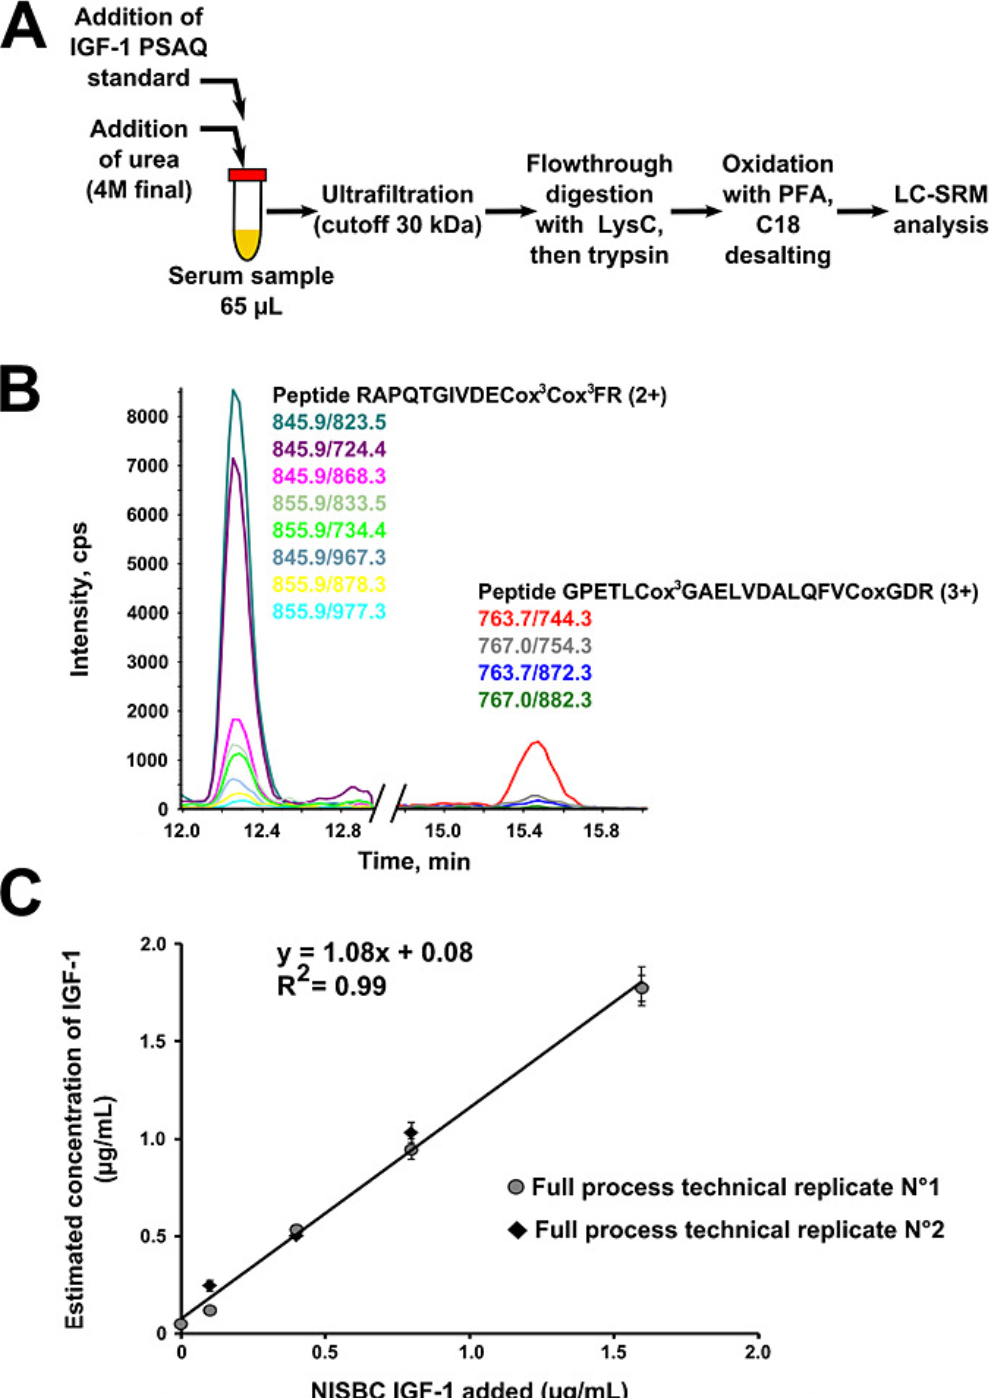
Figure 7. Using PSAQ Method to Determine Human Serum IGF-1 [6]
(4) SISCAPA
The SISCAPA workflow is added a specific enrichment step on the basis of the isotope dilution method, where the selected target peptide and its related SIS internal standard are captured by sequence-specific anti-peptide antibodies. The antibodies, along with the captured target peptides, are then separated from the complex sample. The highly purified peptides are eluted from the antibodies and delivered to the mass spectrometer for analysis. The capture step has been implemented using antibodies bound to magnetic beads and fixed in a flow column.
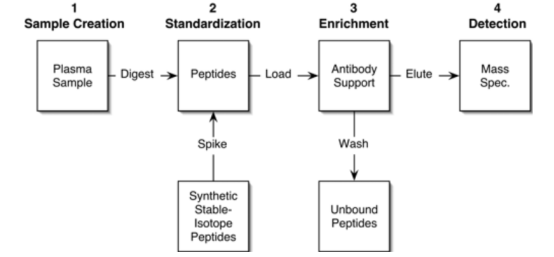
Figure 8. SISCAPA Process [7]
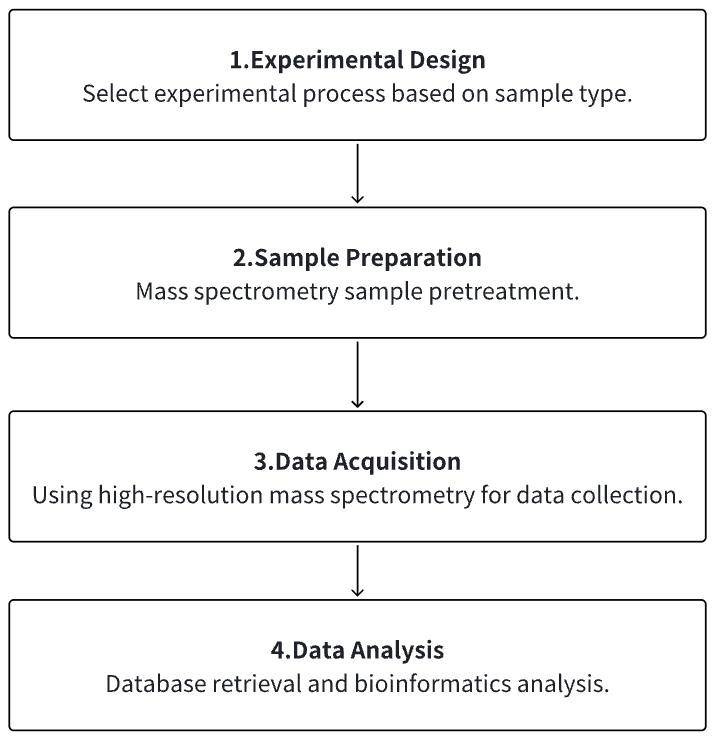
Analysis Workflow
1. Determine the Experimental Process According to the Experimental Requirements
2. Mass Spectrometry Sample Preparation
3. High-Resolution Mass Spectrometry Acquisition Data
4. Data Retrieval and Analysis
Service Advantages
1. Identification/Quantification/Modification Identification of Multi-type Sample Source Proteins
2. High-confidence, High-precision Mass Spectrometry Detection
3. Comprehensive Bioinformatics Analysis
Sample Results
1. Quantifying Endoplasmic Reticulum Stress in HeLa Cells Using Quantitative Proteomics Based on SILAC
The unfolded protein response (UPR) involves extensive proteomic remodeling in many cellular compartments. So far, due to technical limitations, a comprehensive analysis has been missing. A study used proteomics based on SILAC in cell culture to quantify the response of over 6200 proteins to an increase concentration of chlamycin HeLa cells. Further comparison was made between tunicamycin (5 μg/mL), thapsigargin (1 μ M) and DTT (2 mM)), both activating UPR through different mechanisms. 38 proteins previously unrelated to UPR were found increased expression, of which 15 may repair ER stress and the rest may contribute to pathological outcomes.
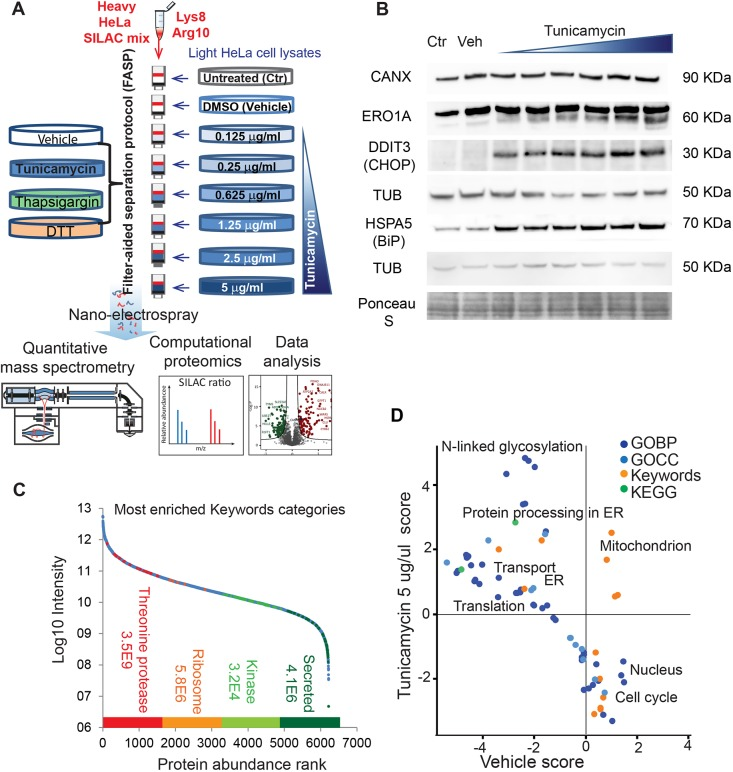
Figure 9. Using SILAC-Based Quantitative Proteomics to Quantify Endoplasmic Reticulum Stress in HeLa Cells [8]
2. Human Proteome Quantification Map
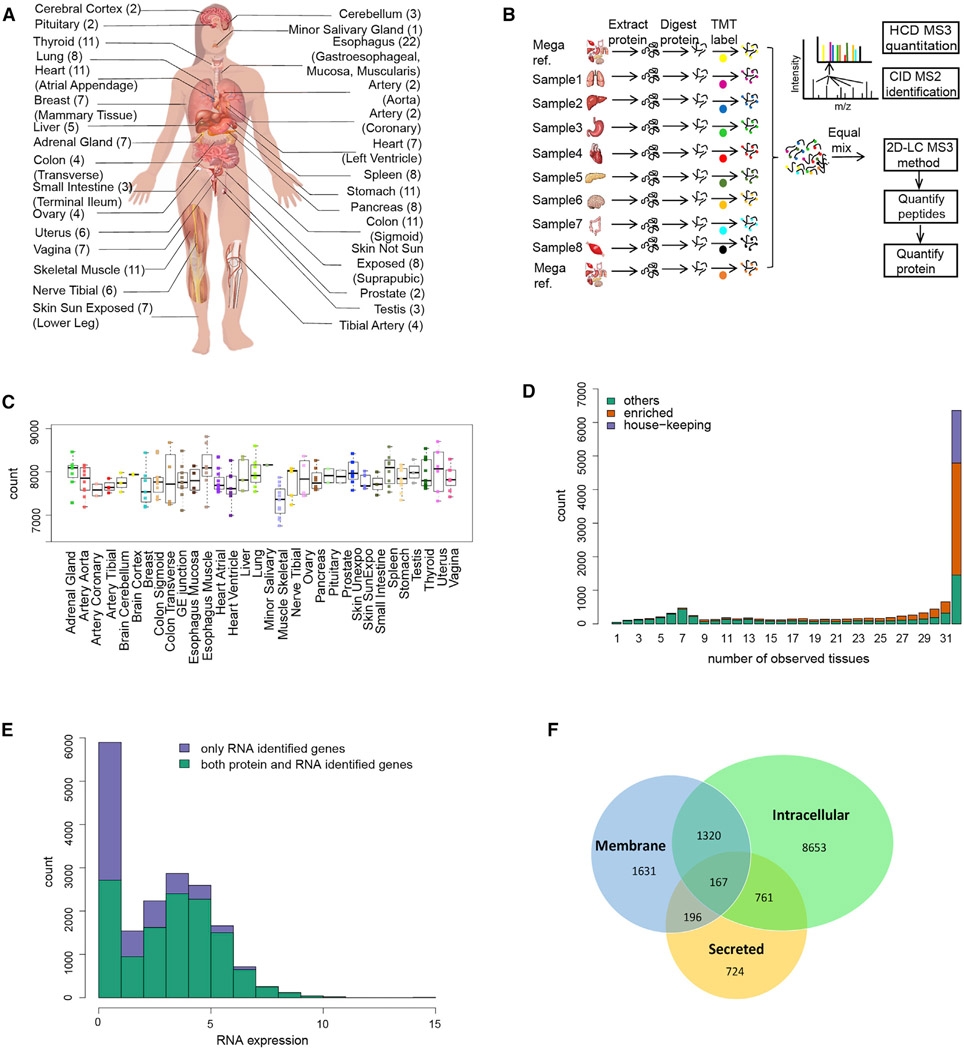
Figure 10. Human Proteome Quantification Map [9]
3. Highly Multiplexed Targeted Proteomics Collection on TIMS-QTOF
Targeted proteomics can sensitively detect specific peptides and proteins in complex biological samples. A study described a method for targeted peptide quantification using a trapped ion mobility quadrupole time-of-flight mass spectrometer (timsTOF Pro). The prm-PASEF method utilizes the multiplexing capabilities provided by trapped ion mobility separation, allowing monitoring of over 200 peptides during a 30-minute liquid chromatography separation. With these improved mass spectrometric capabilities, the study detected and quantified 216 isotopically labeled synthetic peptides (AQUA peptides) spiked in HeLa cell extracts, with some peptides quantifiable at 17.2 amol. This acquisition method had high reproducibility between sample injections and can accurately quantify in biological samples, such as lung cancer and colon cancer cell lines, KRas, NRas, and HRas, and several Ras mutations under10 min fast gradient separations.
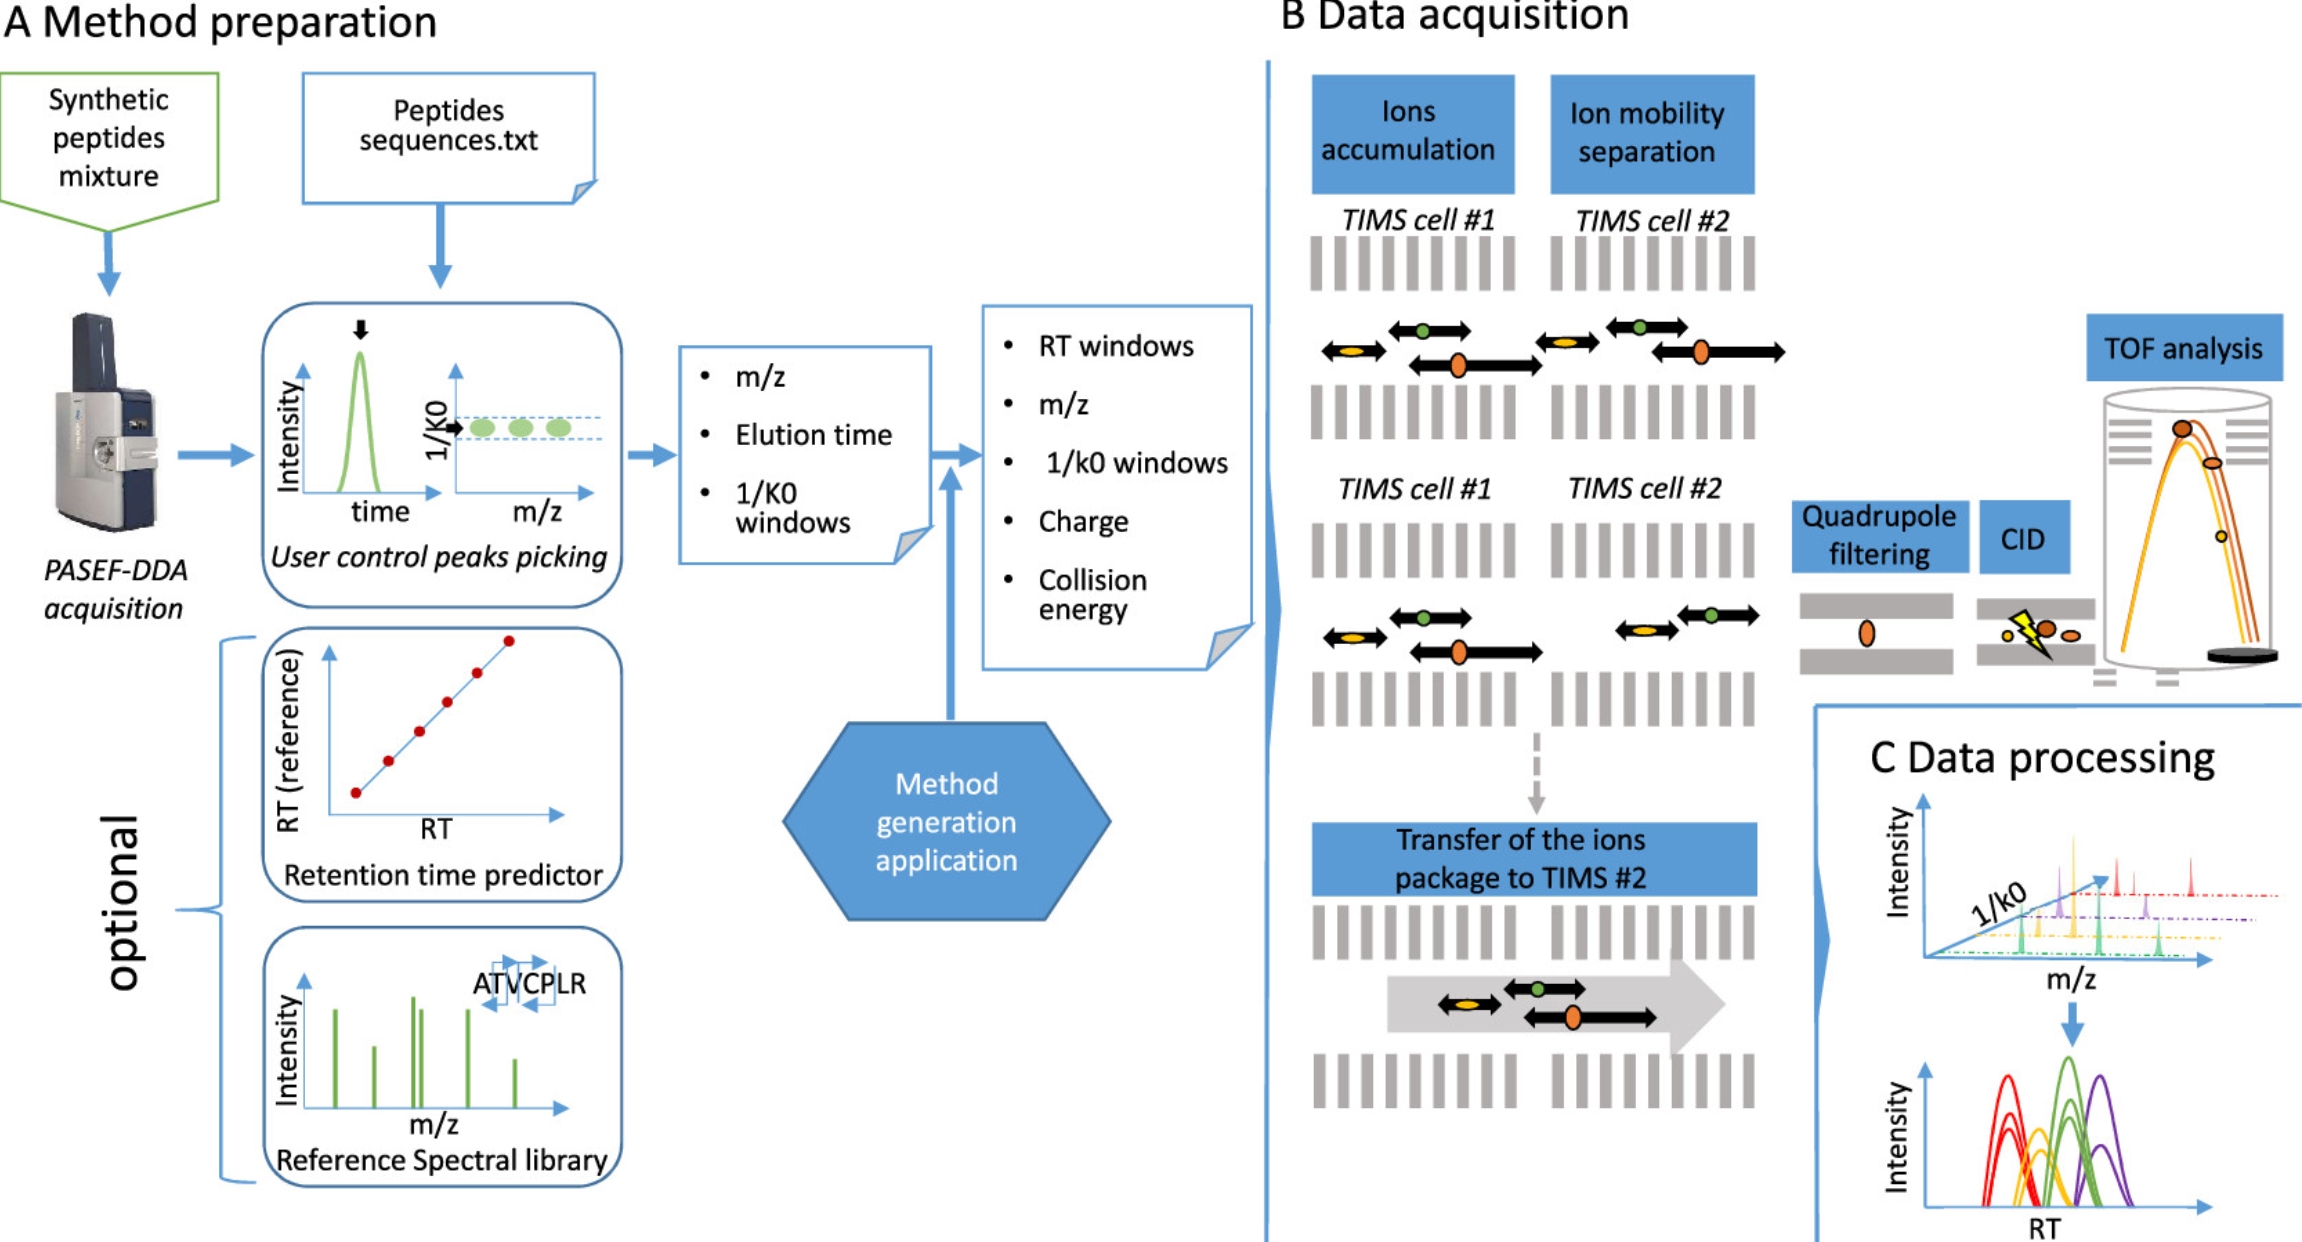
Figure 11. Workflow for Targeted Proteomics Experiments Using Prm-PASEF [4]
Sample Submission Requirements
1. Protein Purity >90%
2. Try to Avoid Impurity Contamination
Services at MtoZ Biolabs
1. Experimental Procedure
2. Relevant Mass Spectrometry Parameters
3. Raw Data
4. Data Analysis Reports
Applications
1. Application of Quantitative Proteomics in Precision Medicine
Precision medicine, as a framework for molecular-level disease diagnosis, treatment, and prevention, has entered clinical practice. Genetics has always been an indispensable tool in understanding and stratifying the biology of chronic and complex diseases in precision medicine. However, with advances in biomedical and omics technologies, quantitative proteomics is becoming a powerful technique and complementary with genetics. Quantitative proteomics provides insights into the dynamic behaviors of proteins, as they represent intermediate phenotypes. They offer direct biological insights into physiological patterns, while genetics explains baseline characteristics. Additionally, it opens up extensive applications in clinical diagnostics, therapeutic stratification, and drug discovery.
Figure 12. General Workflow of Quantitative Proteomics in Precision Medicine [11]
2. Development of Single-Cell Proteomics Technologies
Single-cell proteomics can characterize all proteins at the resolution of individual cell. It enables a precise understanding of complex cellular functions without the need for batch averaging. Single-cell proteomics is a promising field that provides direct and comprehensive molecular insights into cell functions without the effects of averaging. Recently, the analysis of single-cell proteins has technically become feasible through tandem mass spectrometry (MS) analysis. Although this analysis has the potential to accurately quantify thousands of proteins in millions of single cells, the accuracy and reproducibility of the results can be affected by numerous factors related to experimental design, sample preparation, data acquisition, and data analysis. Compared to other single-cell omics (including single-cell transcriptomics and single-cell metabolomics), the field of single-cell proteomics has developed relatively late. One of the major challenges faced by single-cell proteomics is adsorption loss (AL). AL refers to the immobilization of analytes due to adsorption, making them unavailable for analysis in solution. Adsorption, particularly surface adsorption, is a common event in molecular interactions.When analytes (also known as adsorbates) adhere to foreign surfaces (also known as adsorbents), their surface energy reduce. Once the challenges of AL are overcome, the importance of single-cell proteomics will be equal to that of single-cell transcriptomics in biological and medical applications. The integration of all omics will unveil the mysteries of single cell, the foundation of all life.
Figure 13. Applications of Single-cell Proteomics [12]
FAQ
Q1: What are the advantages and disadvantages of isomorphic labels?
Q2: Advantages and Limitations of Isotope Dilution Standards in MS-Based Absolute Quantification of Proteins
−: Poor; +: Good; ++: Very Good; +++: Excellent.
References
[1] Cox J, Mann M. Quantitative, high-resolution proteomics for data-driven systems biology. Annu Rev Biochem. 2011;80:273-99. doi: 10.1146/annurev-biochem-061308-093216. PMID: 21548781.
[2] Ahire D, Kruger L, Sharma S, Mettu VS, Basit A, Prasad B. Quantitative Proteomics in Translational Absorption, Distribution, Metabolism, and Excretion and Precision Medicine. Pharmacol Rev. 2022 Jul;74(3):769-796. doi: 10.1124/pharmrev.121.000449. PMID: 35738681; PMCID: PMC9553121.
[3] Beller NC, Hummon AB. Advances in stable isotope labeling: dynamic labeling for spatial and temporal proteomic analysis. Mol Omics. 2022 Aug 15;18(7):579-590. doi: 10.1039/d2mo00077f. PMID: 35723214; PMCID: PMC9378559.
[4] Ahsan N, Rao RSP, Gruppuso PA, Ramratnam B, Salomon AR. Targeted proteomics: Current status and future perspectives for quantification of food allergens. J Proteomics. 2016 Jun 30;143:15-23. doi: 10.1016/j.jprot.2016.04.018. Epub 2016 Apr 22. PMID: 27113134; PMCID: PMC5082697.
[5] Scott KB, Turko IV, Phinney KW. QconCAT: Internal Standard for Protein Quantification. Methods Enzymol. 2016;566:289-303. doi: 10.1016/bs.mie.2015.09.022. Epub 2015 Oct 21. PMID: 26791984.
[6] Picard G, Lebert D, Louwagie M, Adrait A, Huillet C, Vandenesch F, Bruley C, Garin J, Jaquinod M, Brun V. PSAQ™ standards for accurate MS-based quantification of proteins: from the concept to biomedical applications. J Mass Spectrom. 2012 Oct;47(10):1353-63. doi: 10.1002/jms.3106. PMID: 23019168.
[7] Anderson NL, Anderson NG, Haines LR, Hardie DB, Olafson RW, Pearson TW. Mass spectrometric quantitation of peptides and proteins using Stable Isotope Standards and Capture by Anti-Peptide Antibodies (SISCAPA). J Proteome Res. 2004 Mar-Apr;3(2):235-44. doi: 10.1021/pr034086h. PMID: 15113099.
[8] Itzhak DN, Sacco F, Nagaraj N, Tyanova S, Mann M, Murgia M. SILAC-based quantitative proteomics using mass spectrometry quantifies endoplasmic reticulum stress in whole HeLa cells. Dis Model Mech. 2019 Nov 11;12(11):dmm040741. doi: 10.1242/dmm.040741. PMID: 31628211; PMCID: PMC6899043.
[9] Jiang L, Wang M, Lin S, Jian R, Li X, Chan J, Dong G, Fang H, Robinson AE; GTEx Consortium; Snyder MP. A Quantitative Proteome Map of the Human Body. Cell. 2020 Oct 1;183(1):269-283.e19. doi: 10.1016/j.cell.2020.08.036. Epub 2020 Sep 10. PMID: 32916130; PMCID: PMC7575058.
[10] Lesur A, Schmit PO, Bernardin F, Letellier E, Brehmer S, Decker J, Dittmar G. Highly Multiplexed Targeted Proteomics Acquisition on a TIMS-QTOF. Anal Chem. 2021 Jan 26;93(3):1383-1392. doi: 10.1021/acs.analchem.0c03180. Epub 2020 Dec 17. PMID: 33331761.
[11] Correa Rojo A, Heylen D, Aerts J, Thas O, Hooyberghs J, Ertaylan G, Valkenborg D. Towards Building a Quantitative Proteomics Toolbox in Precision Medicine: A Mini-Review. Front Physiol. 2021 Aug 26;12:723510. doi: 10.3389/fphys.2021.723510. PMID: 34512391; PMCID: PMC8427610.
[12] Gatto L, Aebersold R, Cox J, Demichev V, Derks J, Emmott E, Franks AM, Ivanov AR, Kelly RT, Khoury L, Leduc A, MacCoss MJ, Nemes P, Perlman DH, Petelski AA, Rose CM, Schoof EM, Van Eyk J, Vanderaa C, Yates JR 3rd, Slavov N. Initial recommendations for performing, benchmarking and reporting single-cell proteomics experiments. Nat Methods. 2023 Mar;20(3):375-386. doi: 10.1038/s41592-023-01785-3. Epub 2023 Mar 2. PMID: 36864200; PMCID: PMC10130941.
How to order?

