



Analyzing IP mass spectrometry results means turning a search table into a bait-versus-control enrichment list. Immunoprecipitation–mass spectrometry (IP-MS) reports peptide-identified proteins that were present in an eluate, with relative intensities when the acquisition was quantitative. It does not, by itself, report a protein–protein interaction, an absolute copy number, or a conformational change. The useful first decision is whether the bait was recovered and whether each prey is enriched against a matched IgG, bead-only, or empty-tag arm. Reading every identification as a partner is how an IP-MS file is over-interpreted.
IP-MS, including co-immunoprecipitation–MS (Co-IP-MS), is used in cell-biology and biopharmaceutical research to inspect co-precipitation around one target. The spectrometer can support that inspection only after the table is filtered. Sequence IDs, optional modification sites, and intensity values are starting fields. They are not a preliminary interaction map.
Researchers who already have an IP-MS or Co-IP-MS search file, a control arm, or a scoring question can also review the MtoZ Biolabs IP-Mass Spectrometry Service for project-specific feasibility and analysis planning.
Understanding IP-MS Data
Before ranking proteins, name what the file actually contains. A typical MaxQuant, Proteome Discoverer, or equivalent export lists protein groups, peptide counts, identification scores, and a relative quantity such as intensity, label-free quantification (LFQ), or a TMT reporter. Amino-acid sequence is inferred from the peptide-spectrum match, not measured as a complete primary structure. Modification information appears only when that variable modification was searched. Absolute abundance is not the default IP-MS output unless a spike-in standard was designed.
Those fields describe what was detected in the eluate. They do not initially judge interaction or association. A protein with many peptides may be an abundant bead binder. A protein with few peptides may be a scarce true partner. For how the eluate was generated before this file exists, How to Combine Co-IP with Mass Spectrometry for Protein Interaction Analysis? provides a complementary capture discussion.
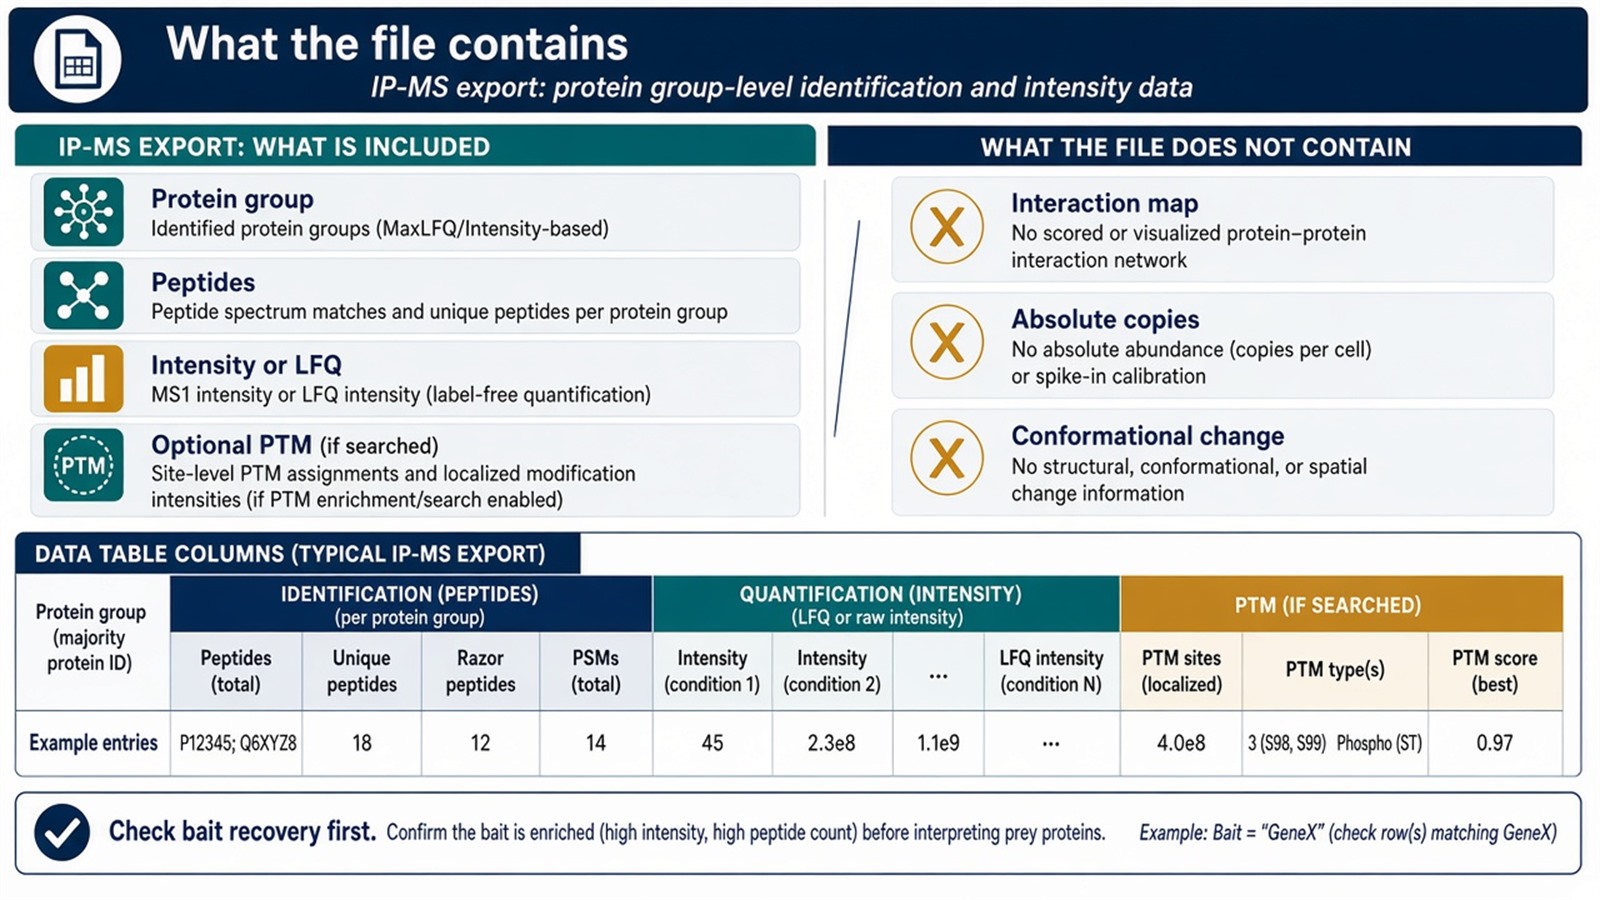
Figure 1. The search table reports identifications and relative quantity in the IP eluate. Interaction language starts only after bait recovery and control enrichment are checked.
Inspect bait recovery first. A prey table without the bait is not an interactome.
How to Screen Protein Signals
Noise and non-specific proteins are expected in every IP. Screening is not the deletion of every protein that also appears in the negative control. Many true partners are present in both arms at different amounts. The usual comparison is enrichment: bait IP versus a matched IgG, bead-only, or empty-tag arm processed in the same batch.
Filter proteins that are similar in the control, not merely detected there. Fold change, a SAINT-, CompPASS-, or MiST-class score, and a contaminant catalog such as CRAPome help rank bait-dependent outliers (Choi et al. 2011; Mellacheruvu et al. 2013). Subtracting the entire control identification list removes real partners that leak into a dirty isotype lane. Equalizing IgG mass before this comparison belongs to the experiment, not to the software. For leftover-signal classes that begin on the blot, How to Reduce High Background Signals in Co-IP Assays? provides a complementary wet-lab discussion.
Annotating Proteins After the List Is Scored
Annotation comes after the shortlist, not instead of scoring. Pathway membership, domain tags, and published edges from STRING or IntAct can prioritize which outliers to test next. They do not determine the functional domain from an IP-MS intensity, and they do not predict a conformational change from a peptide count. A pathway hit that failed enrichment is still a control-like protein.
Use annotation as a separate overlay. Do not rebuild the interactome by importing every identified protein into a network drawing.
Statistical Checks That a Table Can Support
Replicates and a declared test can rank which enrichments are stable in this design. They do not eliminate individual experimental error, and they do not show that the result has universal significance. Three biological IPs improve robustness only when lysis, antibody amount, and the control arm stay matched. A p-value on unmatched days is not a reliability upgrade.
For control language that belongs with any affinity-MS record, How to Improve Reliability and Reproducibility of PPI Experimental Results provides a more detailed design discussion.
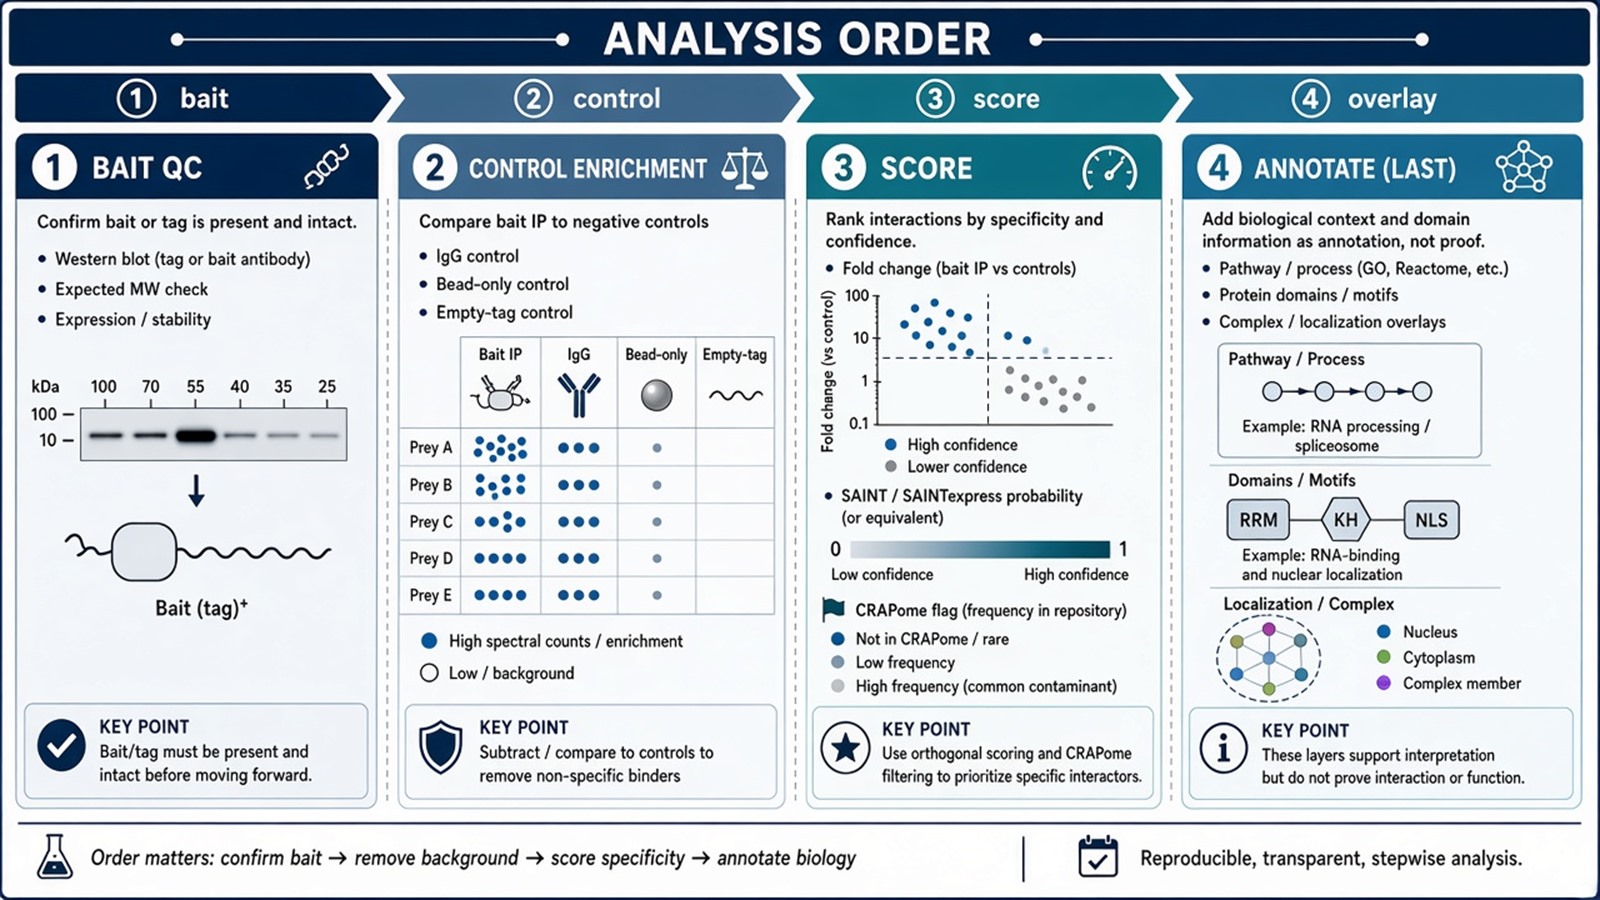
Figure 2. Read bait recovery, then enrich against a matched control, then score. Pathway and domain annotation sit after that filter.
A Practical Order for One IP-MS File
Confirm that the bait, or the tag, is present with enough peptides to trust the capture.
Compare each prey with the matched control using a ratio or a published IP-MS score, not presence-or-absence.
Flag recurrent contaminants, then keep proteins that remain bait-dependent.
Overlay pathway or domain information only on that shortlist, and send priority edges back to Western or reciprocal IP.
Do not invert the order. Annotation cannot rescue an unfiltered identification dump.
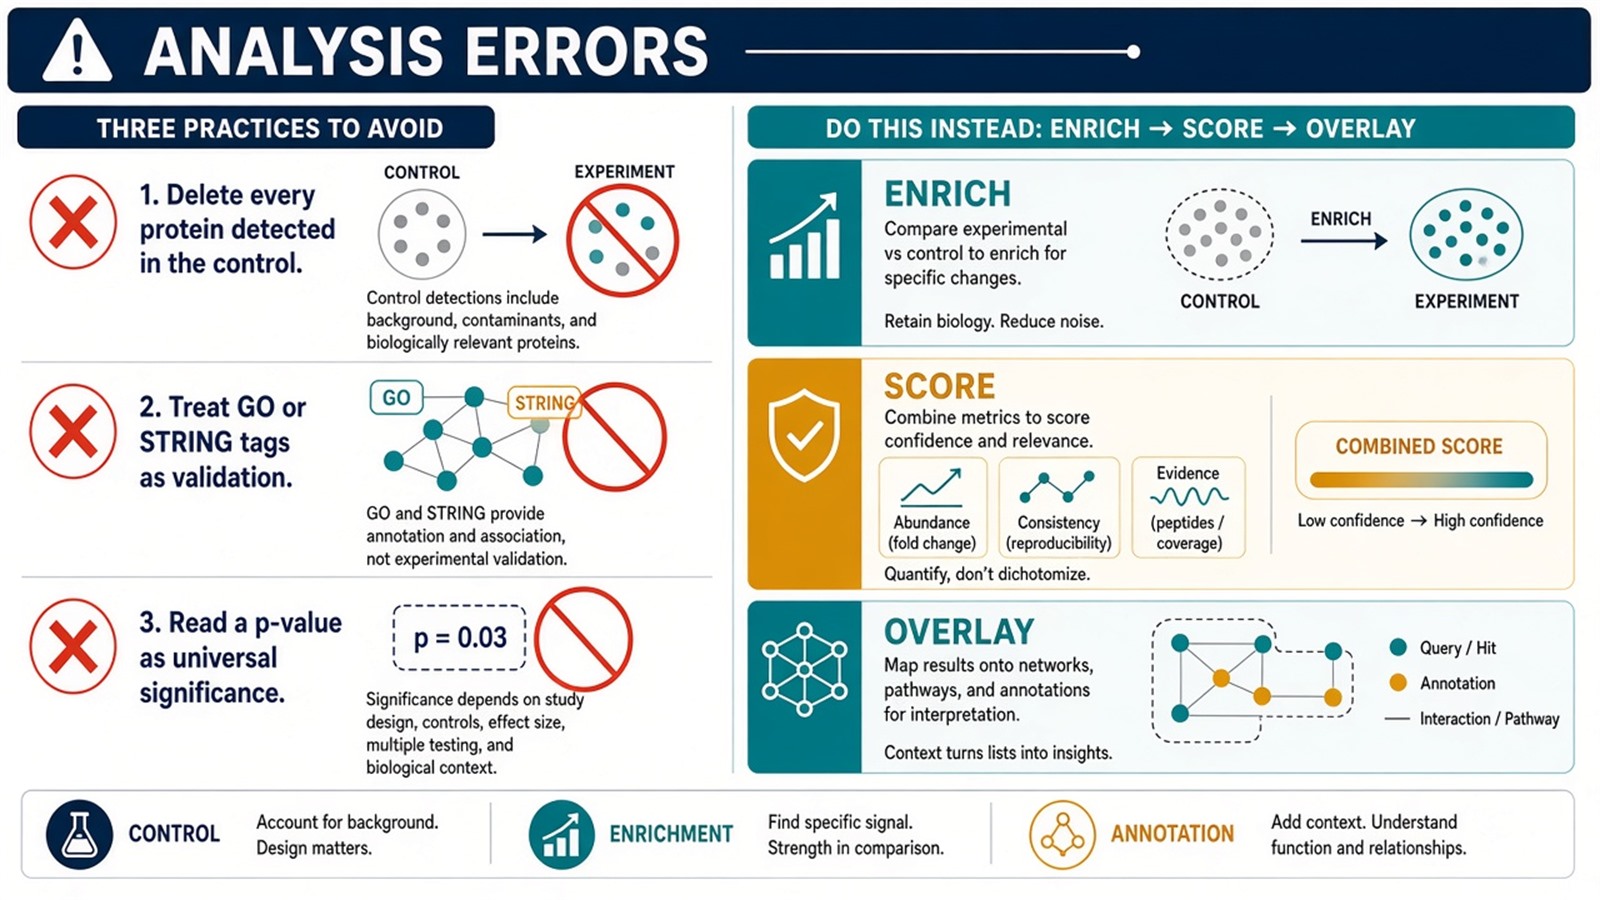
Figure 3. Subtracting every control ID, calling a pathway hit an interactor, or reading a p-value as universal significance are analysis errors, not extra rigor.
Experimental Limits
IP-MS analysis can return a scored candidate list. It cannot convert co-precipitation into a binding site, a drug target, or a diagnostic marker. Missing values, mismatched controls, and over-annotation of well-studied hubs remain after any software version. Diagnostic or development language sits outside ordinary research reporting unless a separately validated assay framework is in place.
Project Planning and Service Scope
A usable analysis plan names the control arm, the quantity type in the file, the scoring rule, and which proteins return to an orthogonal blot. MtoZ Biolabs scopes IP-MS and Co-IP-MS reporting on Orbitrap-class LC-MS/MS with control-filtered tables and optional pathway overlays after the score is closed. The length of the shortlist still follows capture chemistry, not the annotation database.
Once the file, control, and scoring rule are defined, the project can be scoped as IP-MS analysis. Researchers can review the MtoZ Biolabs Co-IP-MS Protein Interaction Analysis Service for project-specific sample evaluation, feasibility assessment, and workflow planning.
Frequently Asked Questions
1. What should be checked first in an IP-MS result file?
Bait recovery. If the target or tag is missing, later prey ranking is not an interaction analysis.
2. Should every protein found in the IgG control be deleted?
No. Compare amounts. Many true partners appear in both arms. Delete or down-rank proteins that are not enriched with the bait.
3. Does protein abundance in the IP equal interaction strength?
No. Intensity is recovery after capture. It is not a dissociation constant.
4. Can pathway annotation validate the IP-MS list?
No. Annotation prioritizes follow-up. Enrichment against the control remains the interaction filter.
5. Do statistics make the result universally significant?
No. They rank stability inside the stated design. They do not remove unmatched processing or generalize to other cell systems.
Reference
- Choi H., Larsen B., Lin Z.Y., et al. (2011). SAINT: probabilistic scoring of affinity purification-mass spectrometry data. Nat. Methods, 8, 70-73. https://doi.org/10.1038/nmeth.1541
- Mellacheruvu D., Wright Z., Couzens A.L., et al. (2013). The CRAPome: a contaminant repository for affinity purification-mass spectrometry data. Nat. Methods, 10, 730-736. https://doi.org/10.1038/nmeth.2557
- Gingras A.C., Gstaiger M., Raught B., Aebersold R. (2007). Analysis of protein complexes using mass spectrometry. Nat. Rev. Mol. Cell Biol., 8, 645-654. https://doi.org/10.1038/nrm2208
- Dunham W.H., Mullin M., Gingras A.C. (2012). Affinity-purification coupled to mass spectrometry: basic principles and strategies. Proteomics, 12, 1576-1590. https://doi.org/10.1002/pmic.201100523
- Sowa M.E., Bennett E.J., Gygi S.P., Harper J.W. (2009). Defining the human deubiquitinating enzyme interaction landscape. Cell, 138, 389-403. https://doi.org/10.1016/j.cell.2009.04.042
