


HCD Fragment Detection Service With CE and qPCR
Apart from the quantity of DNA, the size distribution of residual DNA fragments is also an important factor related to carcinogenicity and infectivity. Due to the low content of residual DNA in drugs, the development of residual DNA size detection with high sensitivity, specificity, and resolution is a significant challenge. Fragment analysis involves a series of techniques, in which DNA fragments can be fluorescently labeled, separated by capillary electrophoresis (CE), and their sizes determined by comparison with internal standards. DNA sequencing by CE can be used to determine the base sequence of specific fragments or gene segments, while fragment analysis, based on PCR using primers designed for specific DNA targets, generates fluorescently labeled DNA fragments and provides information on relative size, relative quantitation, and genetic typing.
1. Capillary Electrophoresis
CE is a high-throughput separation method commonly used for DNA analysis due to its short analysis time and small sample volume. Free zone and gel-enhanced sieving are the most commonly reported modes in DNA analysis. CE methods for DNA separation in the free zone are limited by the similar charge-to-size ratio of different-length fragments. To circumvent this issue, gel is incorporated into CE separations to sieve DNA fragments based on size.
The key component of the setup is the separation capillary. Currently, separation capillaries are made of fused silica with an outer surface coated with polyimide to protect the fragile material during operation. The most common dimensions include inner diameter (i.d.) and outer diameter (o.d.) ranging from 10-100 μm and 100-360 μm, respectively; the thickness of the polyimide protective layer is approximately 15 μm; the effective length (LD) or total length (LC) usually ranges between 20-60 cm. The applied voltage is generated by a high-voltage power supply, typically ranging from 2-30 kV, and once selected, it stabilizes. The current through the capillary typically ranges from 2-50 μA, depending evidently on the applied voltage and the electrical conductivity of the background electrolyte (BGE) used.
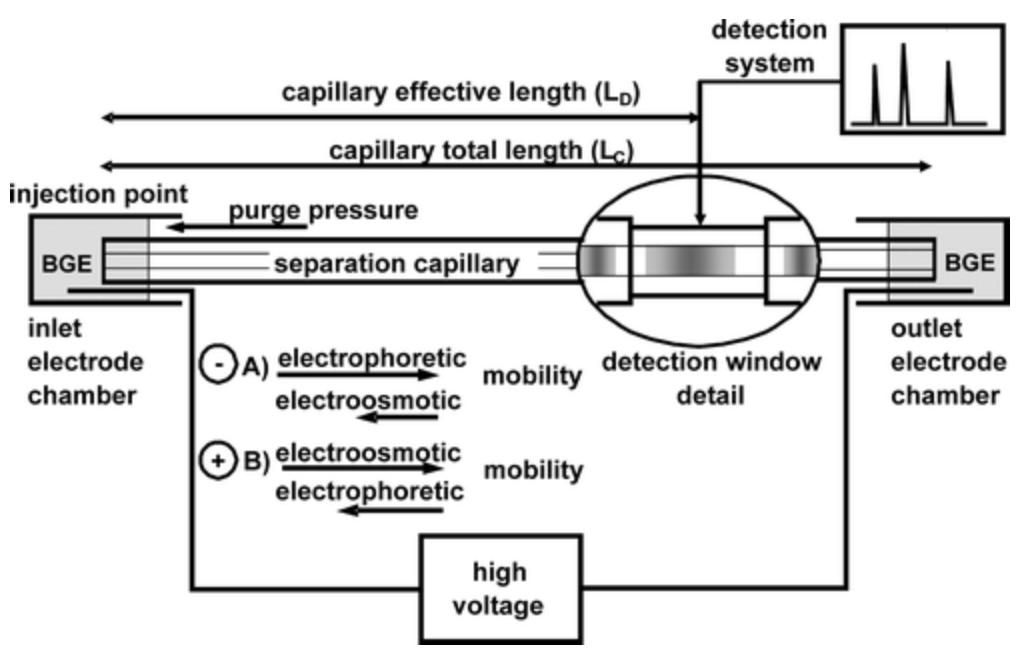
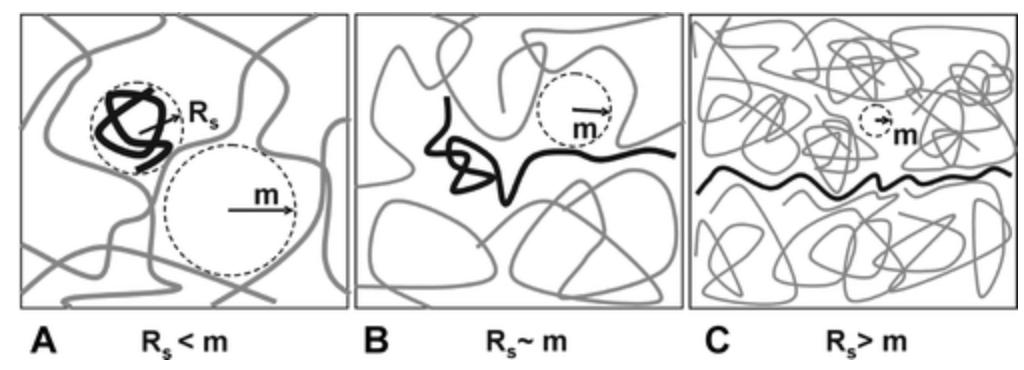
Figure 2. Schematic Diagram of DNA Migration Scheme [1]
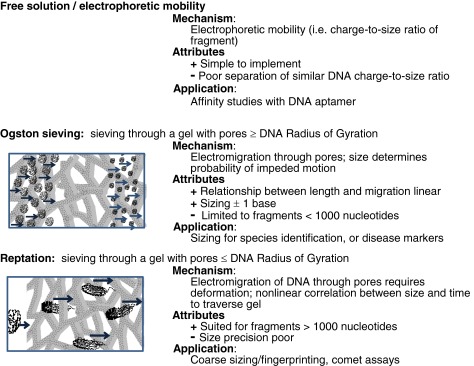
Figure 3. Mechanism of CE [2]
The separation performance is the most critical performance indicator for sieving gels, measured by chromatographic resolution and Ogston gel electrophoretic sieving size upper limit. Chromatographic peak resolution (Rs) is defined as Rs = (Δt)/Wave, where Δt is the migration time difference between two adjacent peaks, and Wave is the average width of the peak base (estimated as 4σ). Resolution is typically calculated using the half-width, with the half-width of a Gaussian peak being 2.35σ, as it avoids practical issues associated with baseline noise or overlapping peaks. For Gaussian peaks, values obtained by this method are identical to those obtained using baseline width. Peak resolution can also be described by the minimum number of nucleotides that can distinguish two DNA fragments. The calculation involves dividing the difference in the number of bases between two adjacent peaks by the calculated Rs. Besides separation performance, the cost, viscosity, and coating ability of the gel must also be considered. Gels that are easy to synthesize or obtain at low cost are preferred. The viscosity of the gel matrix is also crucial as high-pressure systems are required to introduce and remove viscous gels from capillaries. Such high pressures are incompatible with microfluidics. Coating the surface of capillaries or channels is necessary to suppress electroosmotic flow. The coating must be stable, and its impact on electroosmotic flow should be reproducible.
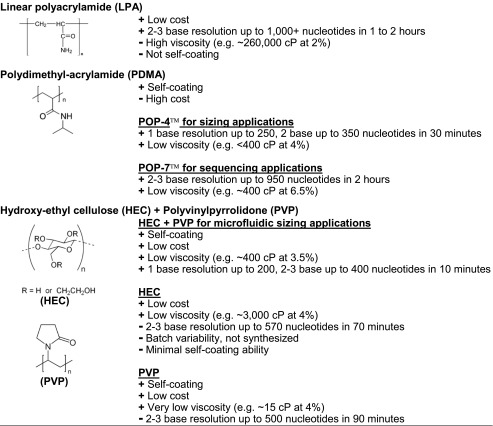
Figure 4. Gel for DNA Sequencing and Molecular Weight Determination Applications [2]
2. Quantitative Real-Time PCR
Quantitative Real-time PCR (qPCR) represents the later development of this method, allowing users to monitor the progress of PCR reactions in real-time. In essence, this method employs DNA sequence-specific probes, with one end being a fluorescent reporter molecule and the other end being a molecule that quenches this fluorescence. The proximity of the reporter gene to the quenching molecule impedes the 5' to 3' exonuclease activity of Taq polymerase, preventing fluorescence detection and probe cleavage, thereby resulting in unquenched fluorescence emission. Thus, in each PCR cycle, the increase in amplification of cDNA targeted by the reporter probe leads to a proportional increase in fluorescence, attributed to probe cleavage and release of the reporter gene. Available fluorescent reporter molecules include dyes binding to double-stranded DNA (dsDNA), such as SYBR Green, or sequence-specific probes or TaqMan probes. Similar to traditional PCR, qPCR typically employs a thermal cycler that rapidly heats and cools samples to facilitate denaturation, annealing, and extension stages of replication. However, in the case of qPCR, the thermal cycler should also be capable of irradiating each sample with light of a specific wavelength to detect fluorescence emitted after probe excitation.
Real-time fluorescence-based quantitative PCR analysis is adopted to analyze the size distribution of host cell residual DNA (HCD) fragments, with the design principle for fragment distribution intervals including but not limited to <100 bp, 100-200 bp, 200-500 bp, >500 bp. For the analysis of the size distribution of HCD fragments, multiple amplification fragments of different lengths are generally designed. Standard curves are prepared using human genomic DNA standards for different amplification fragments, and the distribution of residual DNA fragments in samples is analyzed by the ratio of fragments of different sizes.
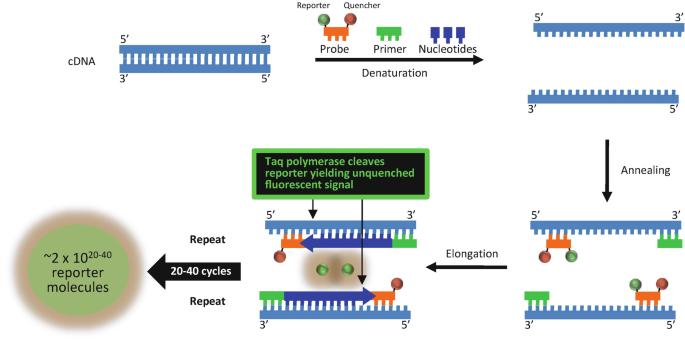
Figure 5. Schematic Diagram of Real-Time Fluorescence-Based Quantitative PCR Program [3]
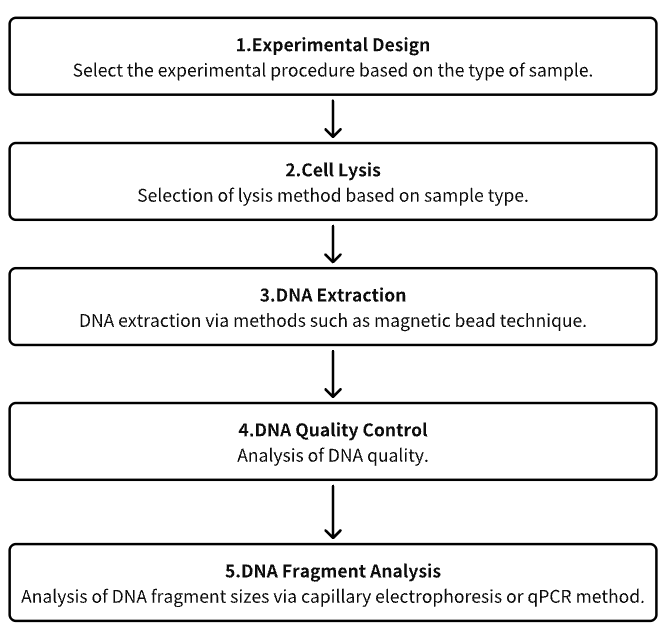
Analysis Workflow
1. Experimental Procedure Determination Based on Requirements
2. Cell Lysis
3. DNA Extraction
4. DNA Quality Control
5. DNA Fragment Analysis
Service Advantages
1. High Credibility Identification and Characterization of HCD
2. Automated High-Throughput DNA Extraction Process
3. Effective DNA Detection System and Extensive Testing Experience
Sample Results
1. Analysis of HCD Size in Cell Culture Vaccines by Capillary Gel Electrophoresis
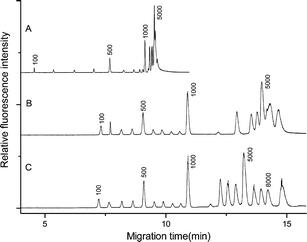
HCD poses a potential safety concern for vaccines or other biopharmaceuticals derived from cell culture. In addition to the quantity of residual DNA, size distribution is an important indicator for determining its associated risks. A novel method for residual DNA size analysis has been developed based on capillary gel electrophoresis (CGE) technology and sensitive laser-induced fluorescence detection (LIF). By empirically selecting appropriate test conditions, the performance of this method has been optimized, and the optimized conditions have been provided. Successful applications of this method in the analysis of residual DNA size in vaccine samples derived from cell culture are demonstrated through examples.
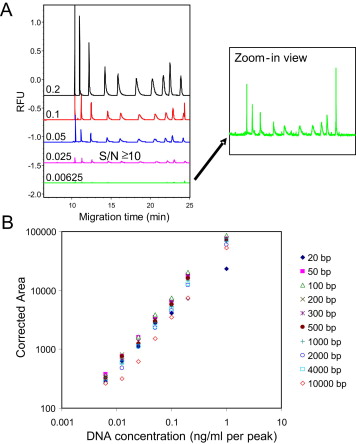
Figure 6. System Sensitivity and Accuracy Quantified by DNA Gradient Dilution Series [4]
2. High-Resolution CGE of DNA Based on Copoly (Pentaerythritoltetra Succinimidylcarboxypentyl/Aminopropyl Polyoxyethylene) Hydrogel
CGE is widely used for the determination of DNA sequences and sizes, with sieving gels playing a crucial role. In this study, a water hydrogel with controllable pore size was synthesized within a capillary, composed of two symmetrical tetrahedron-like macromonomers consisting of pentaerythritoltetra (succinimidylcarboxypentyl) polyoxyethylene (PS) and pentaerythritoltetra (aminopropyl) polyoxyethylene (PA). By employing this hydrogel for capillary electrophoresis of DNA fragments, it was found that when the molecular weight of PA approached that of PS, a more uniform structure suitable for DNA separation could be achieved. DNA fragments smaller than 1500 bp could be well separated within 13 minutes using this hydrogel. The capillary with this dynamic coating could be run continuously for over 100 times before the performance began to decline. It is noteworthy that this hydrogel enables the separation of dsDNA with a resolution comparable to single base pair resolution and dsDNA of the same length, with a difference of 1 bp.
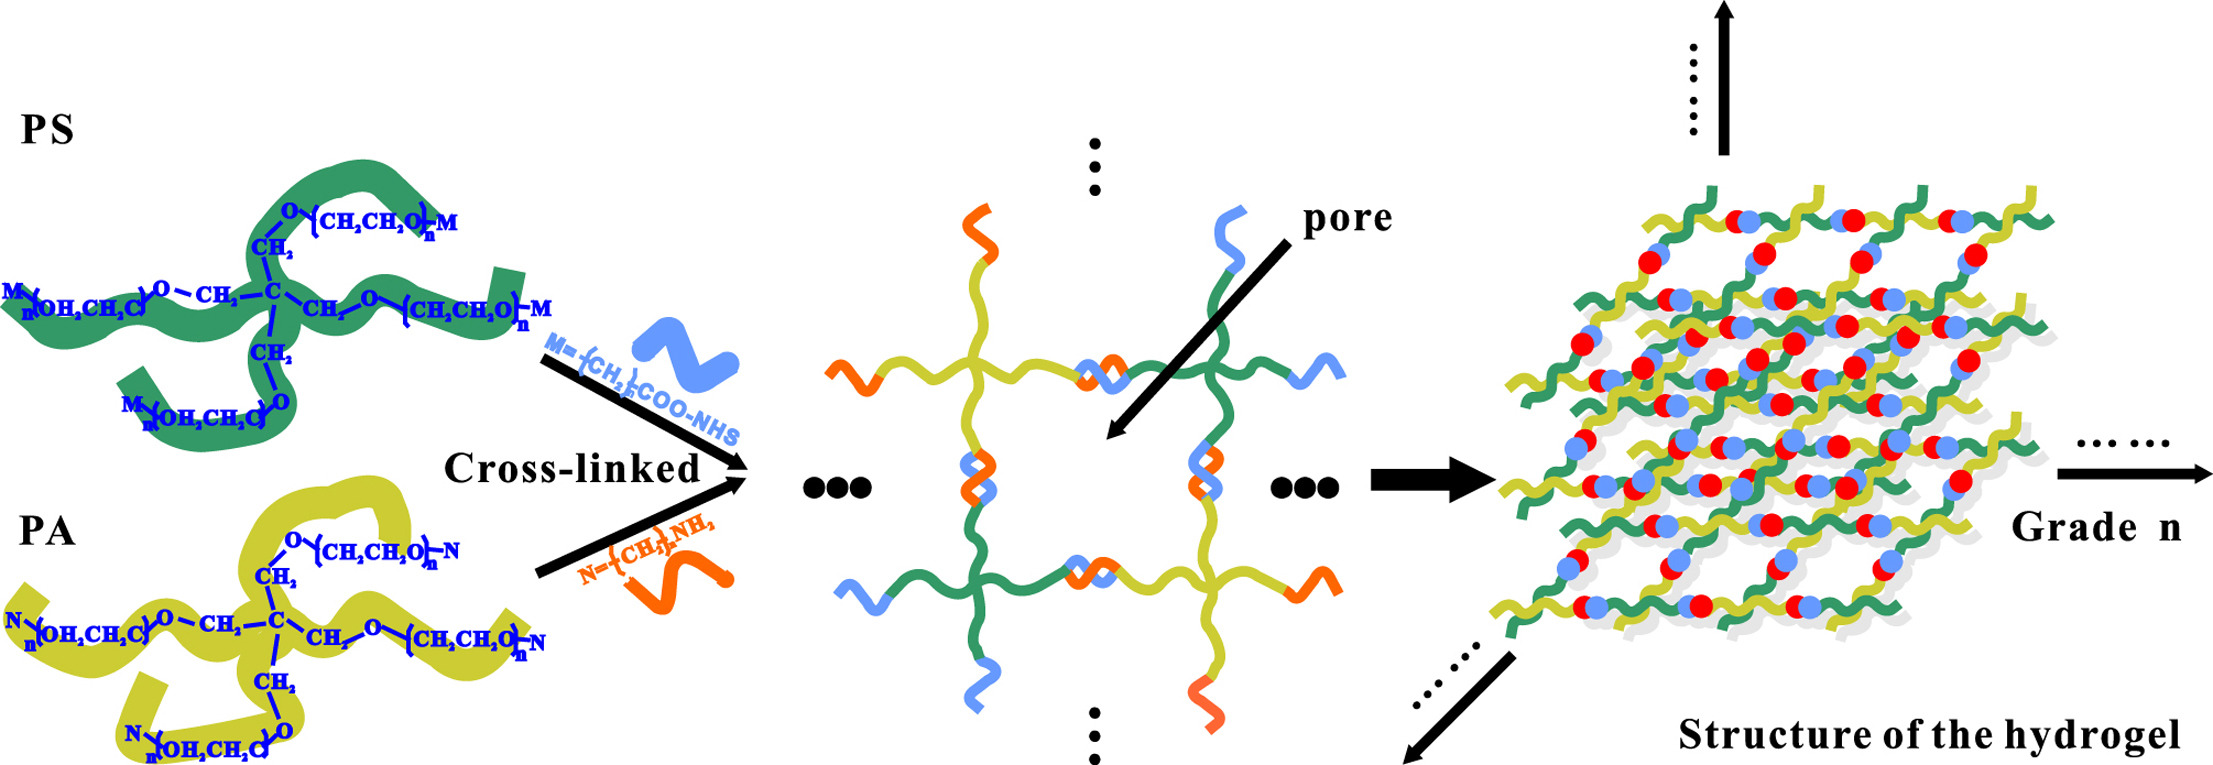
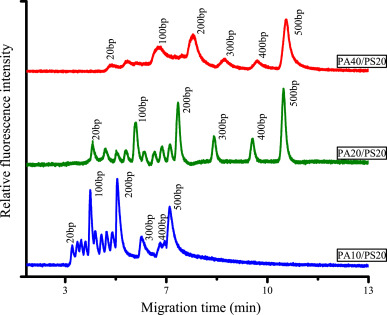
Figure 7. Electrophoretic Maps of 20 bp DNA Markers in PS and PA Synthetic Hydrogels and in PA and PS Synthetic Hydrogels with Different Molecular Weights [5]
3. Separation of Long DNA Fragments by Pulsed Field Capillary Electrophoresis
Improved pulsed field capillary electrophoresis (PFCE) has been reported for the separation of large DNA molecular weight standards. Important analysis conditions, including gel polymer concentration, the ratio of forward and reverse pulse durations, and separation potential, were studied to understand their impact on the separation performance of DNA ranging from 0.1 to 10.0 kilo base pairs (kbp) in size. The results indicate that DNA fragments ranging from 0.1 to 8.0 kbp can be simultaneously separated with high resolution in a short time. For DNA fragments larger than 1.5 kbp, the ratio of forward and reverse pulse durations affects the separation performance, with 3 or 4 being the optimal values for separating DNA fragments up to 10 kbp. Furthermore, clear separations obtained using 74-19,329 bp λ-DNA restriction fragments clearly demonstrate significant improvements in separation time and resolution compared to conventional square wave PFCE. Inversion field capillary electrophoresis may contribute to rapid and effective DNA analysis studies in the future.
Sample Submission Requirements
1. Minimize Impurity Contamination
Services at MtoZ Biolabs
1. Complete Experimental Procedure
2. Relevant Instrument Parameters
3. Original Experimental Data
4. Data Analysis Submission
References
[1] Kleparník K, Bocek P. DNA diagnostics by capillary electrophoresis. Chem Rev. 2007 Nov;107(11):5279-317. doi: 10.1021/cr0101860. Epub 2007 Oct 31. PMID: 17973434.
[2] Durney BC, Crihfield CL, Holland LA. Capillary electrophoresis applied to DNA: determining and harnessing sequence and structure to advance bioanalyses (2009-2014). Anal Bioanal Chem. 2015 Sep;407(23):6923-38. doi: 10.1007/s00216-015-8703-5. Epub 2015 May 3. PMID: 25935677; PMCID: PMC4551542.
[3] Hawkins SFC, Guest PC. Multiplex Analyses Using Real-Time Quantitative PCR. Methods Mol Biol. 2017;1546:125-133. doi: 10.1007/978-1-4939-6730-8_8. PMID: 27896761.
[4] Shen X, Chen X, Tabor DE, Liu Y, Albarghouthi M, Zhang YF, Galinski MS. Size analysis of residual host cell DNA in cell culture-produced vaccines by capillary gel electrophoresis. Biologicals. 2013 May;41(3):201-8. doi: 10.1016/j.biologicals.2012.12.001. Epub 2013 Jan 10. PMID: 23313102.
[5] Wang Z, Wang P, Tao C, Zhang D, Li Z, Yamaguchi Y. Capillary electrophoresis of DNA with high resolution based on copoly(pentaerythritoltetra succinimidylcarboxypentyl/aminopropyl polyoxyethylene) hydrogel. Anal Chim Acta. 2021 Sep 15;1178:338811. doi: 10.1016/j.aca.2021.338811. Epub 2021 Jun 29. PMID: 34482872.
[6] Li Z, Dou X, Ni Y, Yamaguchi Y. Separation of long DNA fragments by inversion field capillary electrophoresis. Anal Bioanal Chem. 2011 Sep;401(5):1661-7. doi: 10.1007/s00216-011-5228-4. Epub 2011 Jul 16. PMID: 21766216.
How to order?

