


Cryo-Electron Tomography Analysis Service
Cryo-electron tomography (cryo-ET) is an imaging technique used for high-resolution three-dimensional (3D) reconstructions of biomolecules, primarily for studying cellular structures. In cryo-ET, vitrified samples are imaged in a transmission electron microscope at tilts ranging from approximately -60° to +60°. This generates a series of two-dimensional (2D) images that can be combined to reconstruct a 3D image, known as a tomogram. This technique is powerful enough to resolve 3D structures of cellular organelles and protein complexes in near-native cellular environments. The localization and structure of biomolecules are crucial for understanding their cellular functions, making structural resolution within the cellular context a breakthrough in structural biology and cell biology.
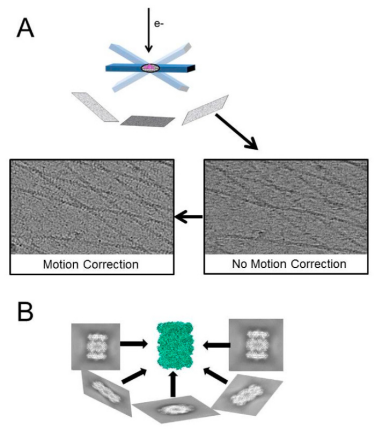
Figure 1. Main Technical Features of Cryo-ET [3]
Cryo-ET is versatile, applicable from the molecular scale (proteins) to subcellular structures (organelles) and entire cellular architectures, effectively bridging the resolution gap between high-resolution methods like X-ray crystallography and NMR, and the lower resolutions typical of optical microscopy.
The cryo-ET process includes:
1. Sample Preparation
As in SPA, preparing samples is both crucial and challenging in croy-ET. Eukaryotic cells, typically around 10 μm in size, exceed the optimal thickness for cryo-ET, which relies on elastic electron scattering that diminishes with increased sample thickness. For example, if a 300-nm-thick sample is tilted to 60°, the apparent thickness of the ice will be 600 nm, which would allow only ~ 20 % of the electrons to remain elastic (assuming 350 nm mean-free path at 300 kV acceleration voltage), while most of the incident electrons would be inelastically scattered. Therefore, 300 nm is considered the practical limit for subnanometer cryo-ET.
Smaller or thinner samples, like viruses or bacteria, can be prepared using plunge-freezing, similar to SPA. For larger samples, such as cells and tissue samples, the high-pressure freezing method can be used, which performs rapid freezing of biological samples under normal pressure, with a vitrification depth of only 10 μm. Samples prepared using high-pressure freezing technology can achieve a vitrification depth of up to 200 μm.
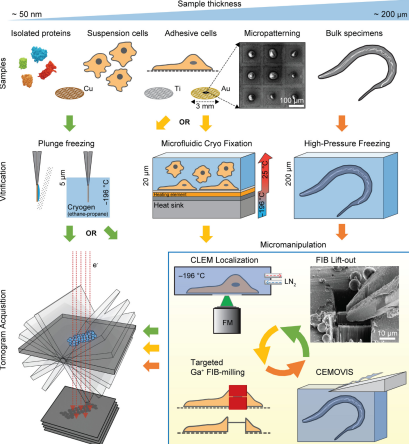
Figure 2. Choices in Cryo-ET Sample Preparation [4]
Thickness is a critical parameter to consider when designing research strategies to answer biological questions because it affects data quality. Ice thickness and quality can be modified by optimizing blotting conditions, buffer/media composition, and grid treatments. Thinner samples yield better image quality. Moreover, direct cryo-ET (applicable only to samples thinner than ~300 nm) is less time-consuming and has higher throughput than cryo-ET methods involving thinning procedures.
Currently, there are two methods to thin vitrified biological specimens: cryo-EM of vitreous sections (CEMOVIS) and cryo-focused-ion-beam (cryo-FIB) milling. CEMOVIS produces ribbons of sample slices collected on EM grids by cryo-sectioning with a diamond knife under low-temperature conditions. Drawbacks of this technique include the difficulty in handling slices during collection and cutting-induced artifacts such as compression, crevasses, and chattering, which can interfere with the desired cryo-EM/cryo-ET imaging. cryo-FIB uses a beam of Ga ions to ablate the sample to the desired thickness, resulting in nearly artifact-free thin sections. The main steps in the cryo-FIB workflow are sample vitrification, sample loading, targeting the area of interest, rough milling to create a thin section, polishing the section, and unloading (transferring the thin section to the TEM microscope).
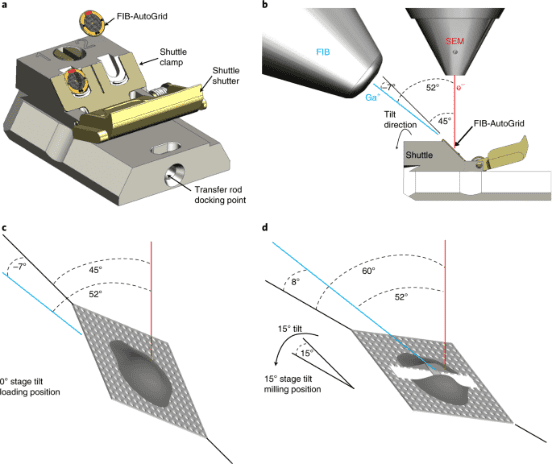
Figure 3. Cryo-FIB Milling Process [5]
2. Data Collection
Electron tomography data collection starts by locating the optimal imaging area. After initial imaging, the sample is tilted incrementally to capture the same area from different angles. This process involves locating the area at low magnifications, adjusting the tilt center height to maintain the sample's position in the imaging field, focusing, precise tracking, and exposure. The cycle of searching, focusing, tracking, and exposing is repeated as the sample is tilted to higher angles.
Data collection methods include (1) dose-symmetric tilt series, alternating data collection between positive and negative tilts; (2) continuous rapid tilting, continuous data collection; (3) mixed subtomogram averaging (STA)-SPA, collecting high-dose images at 0°, then performing dose-symmetric methods; (4) beam image shift, moving the beam from the central focus and tracking to the target collection area, facilitating simultaneous collection of multiple tilt series; (5) montage collection series, imaging the entire thin section to generate a large tomographic image; (6) 2D template matching, collecting a single projection image at 0° and matching the target's high-resolution features to the data.
Collection methodologies depend on the scientific goals, data analysis strategies, and sample quality. Software flexibility is provided by packages like SerialEM, Leginon, and commercial options such as Tomography 5 (Thermo Fisher Scientific), Latitude (Gatan), and Recorder (JEOL), allowing researchers to tailor collection parameters such as tilt range, increment, dose, magnification, and focus.
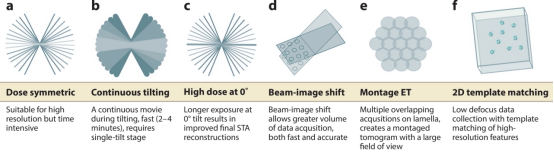
Figure 4. Modes of Data Collection in Cryo-ET [6]
3. Tomographic Reconstruction
Cryo-ET enables the reconstruction of 3D volumes from a series of tilted 2D images of biological specimens, which remain nearly in their native state either in situ or ex situ. This technique allows for the extraction of 3D sub-volumes from the tomograms, which contain the particles of interest. These sub-volumes are aligned and averaged in a process known as STA, significantly enhancing the structural detail by overcoming the low signal-to-noise ratio (SNR) typically found in individual tomograms. With advances in microscope hardware and data processing strategies, cryo-ET equipped with STA is increasingly capable of achieving sub-nanometer resolution. The availability and quality of software packages for processing cryo-ET data using STA have also improved, supporting more sophisticated analyses.
The common data analysis workflow involves: (1) Capturing 2D images at predetermined tilt angles, typically within a ±60° range, during the data collection phase; (2) Each individual movie is motion-corrected, dose-weighted, and averaged to form a series of 2D images hereafter referred to as a tilt-series; (3) Refining the grid positions in each image by fiducial markers (usually gold beads) across the tilt series to ensure a smooth trajectory in a process called tilt series alignment (TSA); (4) Estimating the contrast transfer function (CTF) for each image in the tilt series by fitting a CTF model to the Fourier transform of each image; (5) Backprojecting the 2D images from the tilt-series to form a 3D volume, or tomogram; (6) Identifying and picking protein particles of interest from the tomogram and extracting small 3D sub-volumes containing these particles; (7) Performing CTF correction at this stage or elsewhere in the workflow; (8) Aligning and averaging subtomograms against a reference, iterating until the alignment converges to produce a maximal resolution structure, assessed via methods such as the 'gold-standard' Fourier shell correlation (FSC), spectral SNR, or local resolution estimation; (9) Classifying subtomograms after or during STA to evaluate heterogeneity in particle conformation and composition, which may yield multiple structures of differing compositions or conformations; (10) Applying a range of post-processing techniques such as sharpening to enhance structural quality.
Several software platforms support these extensive tomographic analyses, including Dynamo, EMAN2, emClarity, PEET, Protomo, PyTom, and RELION. These platforms offer various tools for executing STA and other analytical steps, some also feature data management capabilities that allow users to customize workflows or follow predefined analytical pathways.
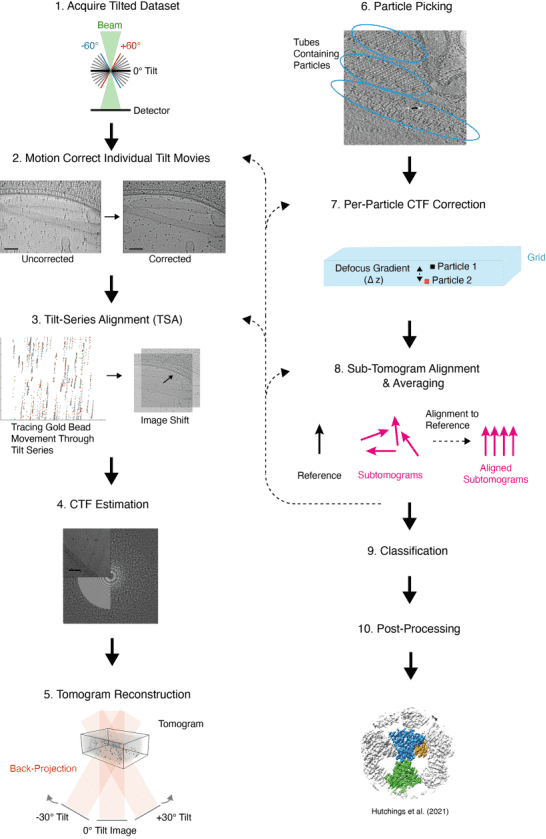
Figure 5. Tomographic Reconstruction Process [7]
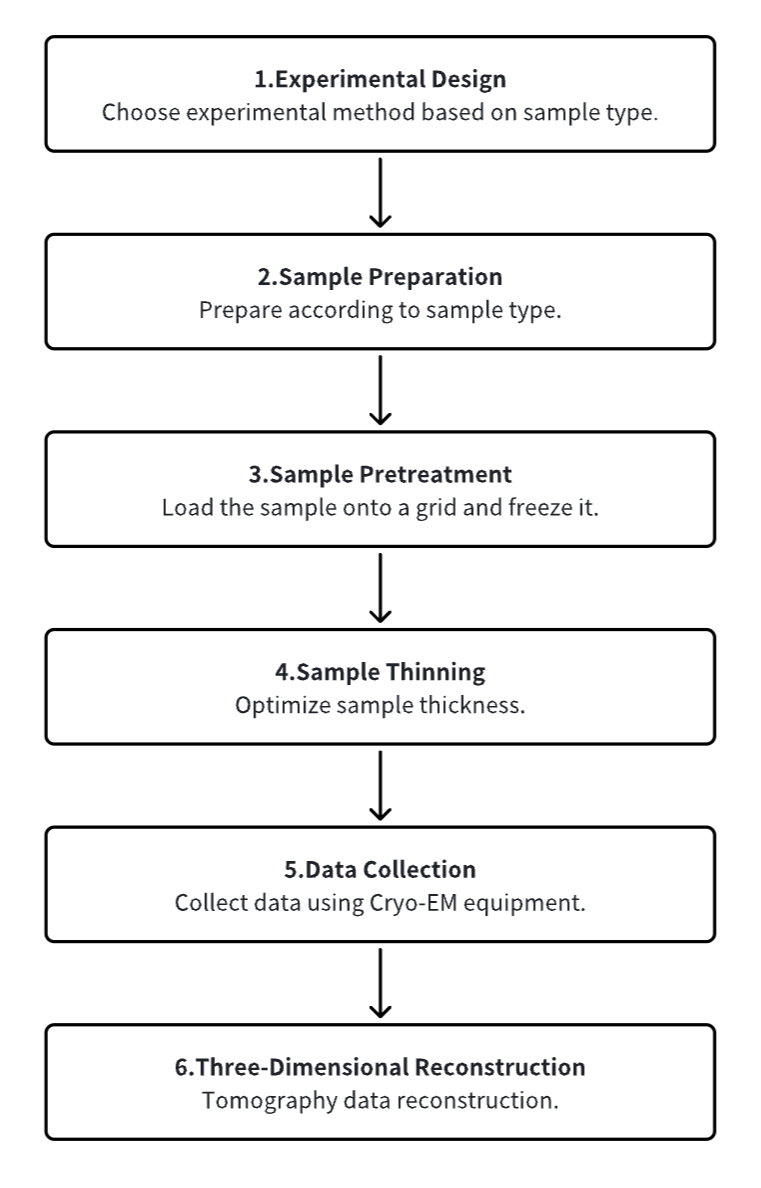
Analysis Workflow
1. Experimental Procedure Determination Based on Requirements
2. Cell/Tissue Sample Preparation
3. Sample Pretreatment and Freezing
4. Sample Thinning
5. Data Collection
6. 3D Reconstruction
Service Advantages
1. Customizable Experimental Methods Based on Requirements
2. Multi-Gradient Design for Optimal Condition Exploration and Sample Optimization Guidance
3. Automated Sample Preparation Platform for Precise Reaction Condition Control
4. High-Resolution Cryo-EM Image Acquisition
5. Diverse Data Analysis Techniques
Sample Results
1. In Situ Structure and Dynamics of PEDV Spike Protein via Cryo-ET and Cryo-EM
Porcine epidemic diarrhea (PED), caused by the porcine epidemic diarrhea virus (PEDV), poses a significant threat to porcine health globally. The trimeric spike (S) glycoproteins of PEDV facilitate virus-host interactions and membrane fusion, making them crucial targets for vaccine development and antigenic studies. While atomic structures of the S proteins from two distinct PEDV strains have been reported, they show variations in the N-terminal domain 0 (D0), which may represent different functional states. Unique to alphacoronavirus, the presence of D0 plays a critical role. Integrative studies using cryo-ET and cryo-EM have demonstrated asynchronous dynamics of the D0 domain on the S protein of the highly virulent PEDV Pintung PT52 in situ. Further cryo-EM analysis of recombinant S proteins expressed in porcine cell lines has unveiled additional domain movements potentially linked to receptor binding.
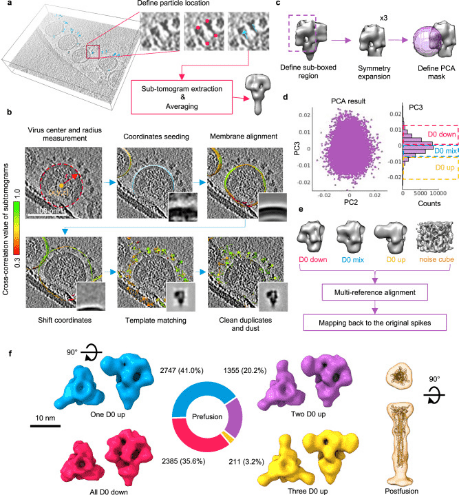
Figure 6. Structural Analysis of PEDV PT52 S by Cryo-ET and STA [8]
2. Cryo-ET of Mammalian Axonal Microtubules and Intracellular Compartments
Neuronal axons are filled with cytoskeletal filaments, membranes, and organelles, many of which move between the cell body and the axonal tip. Studies using cryo-ET have investigated the internal components of mammalian sensory axons. The polarity of axonal microtubules (MTs) was determined through subtomogram classification combined with visual inspection, showing similar structures at both plus and minus ends. Subtomogram averaging of spherical densities in MT lumens suggested they have a defined structure, potentially containing the disordered protein MAP6. The endoplasmic reticulum in axons was found to be connected to MTs through multiple short linkers. Investigations described membrane-bound carriers with unexpected internal features like granules and broken membranes. Additionally, proteinaceous compartments, including numerous virus-like capsid particles, were detected.
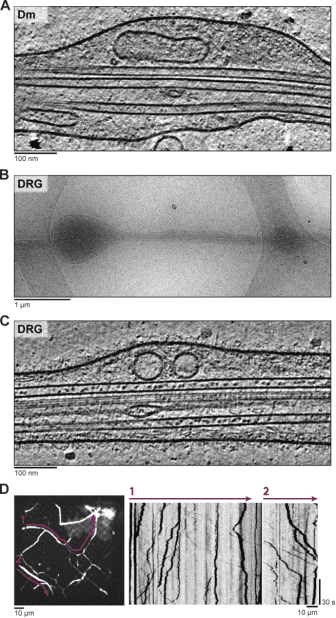
Figure 7. Cryo-ET of Drosophila Melanogaster (Dm) and Mammalian Dorsal Root Ganglion (DRG) Neurites [9]
3. Distinguishing Platelets During Pre-Acute Myeloid Leukemia from Steady State Hematopoiesis Using Cryo-ET
Early detection of acute myeloid leukemia (AML) during the pre-leukemic phase is challenging, as pre-leukemic patients show no symptoms, lacking any known morphological or numerical abnormalities in blood cells. Now we demonstrate that platelets with mitochondrial structural anomalies are indicative of the pre-leukemic phase of AML, appearing before detectable changes in blood counts or visible leukemia foci. Using cryo-ET, researchers observed frozen-hydrated platelets from mice at various stages of AML, employing an unbiased semi-automated process to identify and measure intracellular organelles quantitatively. Notably, a significant proportion of platelets during AML exhibited changes in the overall shape and a reduction of organelles. Remarkably, 23% of platelets in pre-leukemic cells exhibit abnormal, round mitochondria with unfolded cristae, accompanied by a significant drop in ATP levels and altered expression of metabolism-related gene signatures, suggesting that these structural changes in pre-leukemic platelets could serve as early biomarkers for diagnosing AML.
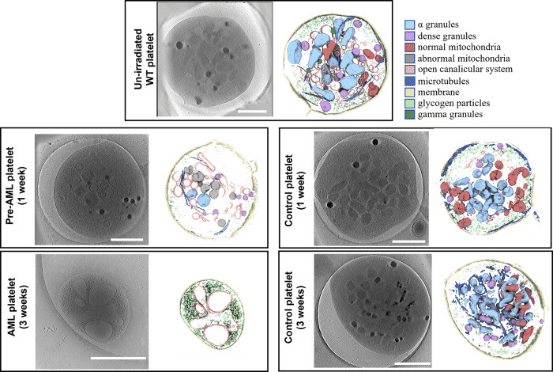
Figure 8. Cryo-ET of Mouse Platelets in Different States [10]
Sample Submission Requirements
1. Comprehensive Experimental Steps
2. Specifications of Relevant Instrumentation
3. Original Experimental Data
4. Data Analysis Report
Applications
1. Analyzing Virus-Related Physiological Processes via Cryo-ET
Viruses employ a range of strategies for replication, such as cell attachment and entry, disassembly and genome release, replication and translation, assembly, and egress. Understanding these mechanisms is vital but visualizing viral activity in situ has long been limited by the scale disparity between viruses and host cells. Traditional lifecycle diagrams of viruses have often been based on conventional functional experiments, frequency modulation observations, snapshots from plastic-embedded cell sections, or even hypothetical models, lacking direct structural evidence of virus-host interactions. Recent advances in cellular cryo-ET techniques now provide unparalleled insights into infected cells, enhancing our understanding of these processes.
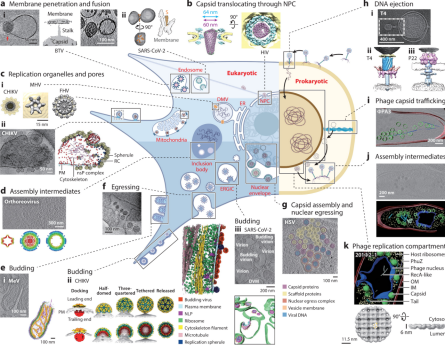
Figure 9. Cryo-ET Showcasing Viral Activities in Infected Eukaryotic and Prokaryotic Cells [11]
2. Cryo-ET for Analyzing Cellular Structures
The interior of eukaryotic cells remains largely mysterious. How do vast colonies composed of macromolecular machines interact? How do the structures and positions of these nanoscopic entities respond to new stimuli? Now, these questions can be addressed using a method known as cryo-ET. Cryo-ET will ultimately reveal the inner workings of cells at the level of protein, secondary structure, and even side-chain. When combined with genetic or pharmacological perturbations, cryo-ET enables us to address previously unimaginable questions about how structure, biochemistry, and forces correlate in situ. As cryo-ET bridges structural biology and cell biology, it becomes indispensable for structural cell biology—the study of cells' 3D macromolecular architecture.
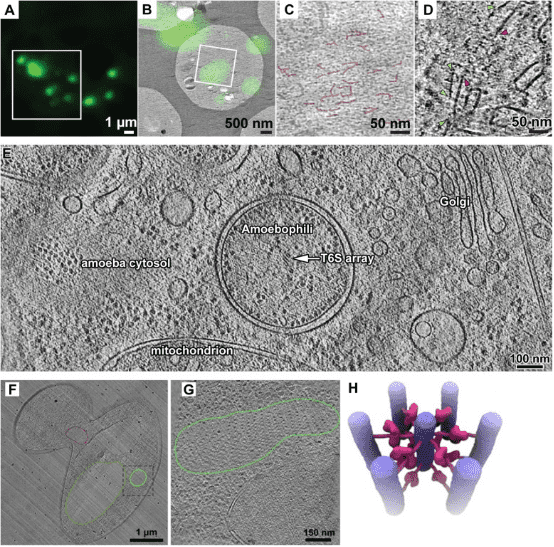
Figure 10. Cryo-ET Analysis of Cellular Structures [12]
3. Cryo-ET for Analyzing Bacterial Cell Biology
Visualizing macromolecules inside bacteria at a high spatial resolution has remained a challenge owing to their small size and limited resolution of optical microscopy techniques. Recent advancements in cryo-ET have revealed the spatial and temporal arrangement of many macromolecules involved in various cellular processes within bacteria in their native environment, with resolutions down to just a few nanometers. Specifically, the application of cryo-FIB milling techniques on thin bacterial specimens makes them suitable for high-resolution cryo-EM data collection.
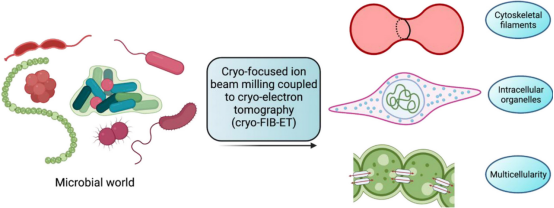
Figure 11. Cryo-ET Analysis of Bacterial Cell Biology [13]
FAQ
Q1: What is the difference between SPA cryo-EM and cryo-ET?
The main difference between SPA and tomography lies in how 3D information of the specimen is collected. In cryo-ET, the different views required for 3D reconstruction come from a series of tilted images from a single specimen area, whereas in SPA, they come from multiple non-tilted areas. Because cryo-ET does not require multiple copies of the same structure, it allows for the analysis of complex and heterogeneous structures, such as cellular volumes.
Q2: What research areas are cryo-ET applied to?
Initially primarily used in structural biology, cryo-ET has, due to recent technological advances, become a powerful tool widely applicable in diverse research fields including microbiology, neurobiology, immunology, cell biology, developmental biology, and molecular biology.
References
[1] Mackay JP, Landsberg MJ, Whitten AE, Bond CS. Whaddaya Know: A Guide to Uncertainty and Subjectivity in Structural Biology. Trends Biochem Sci. 2017 Feb;42(2):155-167. doi: 10.1016/j.tibs.2016.11.002. Epub 2017 Jan 12. PMID: 28089412.
[2] Rout MP, Sali A. Principles for Integrative Structural Biology Studies. Cell. 2019 May 30;177(6):1384-1403. doi: 10.1016/j.cell.2019.05.016. PMID: 31150619; PMCID: PMC6810593.
[3] Wang Z, Zhang Q, Mim C. Coming of Age: Cryo-Electron Tomography as a Versatile Tool to Generate High-Resolution Structures at Cellular/Biological Interfaces. Int J Mol Sci. 2021 Jun 8;22(12):6177. doi: 10.3390/ijms22126177. PMID: 34201105; PMCID: PMC8228724.
[4] Turk M, Baumeister W. The promise and the challenges of cryo-electron tomography. FEBS Lett. 2020 Oct;594(20):3243-3261. doi: 10.1002/1873-3468.13948. Epub 2020 Oct 23. PMID: 33020915.
[5] Wagner, F.R., Watanabe, R., Schampers, R. et al. Preparing samples from whole cells using focused-ion-beam milling for cryo-electron tomography. Nat Protoc 15, 2041–2070 (2020). https://doi.org/10.1038/s41596-020-0320-x
[6] Young LN, Villa E. Bringing Structure to Cell Biology with Cryo-Electron Tomography. Annu Rev Biophys. 2023 May 9;52:573-595. doi: 10.1146/annurev-biophys-111622-091327. PMID: 37159298.
[7] Pyle E, Zanetti G. Current data processing strategies for cryo-electron tomography and subtomogram averaging. Biochem J. 2021 May 28;478(10):1827-1845. doi: 10.1042/BCJ20200715. PMID: 34003255; PMCID: PMC8133831.
[8] Huang CY, Draczkowski P, Wang YS, Chang CY, Chien YC, Cheng YH, Wu YM, Wang CH, Chang YC, Chang YC, Yang TJ, Tsai YX, Khoo KH, Chang HW, Hsu SD. In situ structure and dynamics of an alphacoronavirus spike protein by cryo-ET and cryo-EM. Nat Commun. 2022 Aug 19;13(1):4877. doi: 10.1038/s41467-022-32588-3. PMID: 35986008; PMCID: PMC9388967.
[9] Foster HE, Ventura Santos C, Carter AP. A cryo-ET survey of microtubules and intracellular compartments in mammalian axons. J Cell Biol. 2022 Feb 7;221(2):e202103154. doi: 10.1083/jcb.202103154. Epub 2021 Dec 8. PMID: 34878519; PMCID: PMC7612188.
[10] Wang Y, Huo T, Tseng YJ, Dang L, Yu Z, Yu W, Foulks Z, Murdaugh RL, Ludtke SJ, Nakada D, Wang Z. Using Cryo-ET to distinguish platelets during pre-acute myeloid leukemia from steady state hematopoiesis. Commun Biol. 2022 Jan 20;5(1):72. doi: 10.1038/s42003-022-03009-4. PMID: 35058565; PMCID: PMC8776871.
[11] Hong Y, Song Y, Zhang Z, Li S. Cryo-Electron Tomography: The Resolution Revolution and a Surge of In Situ Virological Discoveries. Annu Rev Biophys. 2023 May 9;52:339-360. doi: 10.1146/annurev-biophys-092022-100958. Epub 2023 Jan 31. PMID: 36719970.
[12] Ng CT, Gan L. Investigating eukaryotic cells with cryo-ET. Mol Biol Cell. 2020 Jan 15;31(2):87-100. doi: 10.1091/mbc.E18-05-0329. PMID: 31935172; PMCID: PMC6960407.
[13] Khanna K, Villa E. Revealing bacterial cell biology using cryo-electron tomography. Curr Opin Struct Biol. 2022 Aug;75:102419. doi: 10.1016/j.sbi.2022.102419. Epub 2022 Jul 9. PMID: 35820259.
How to order?

