


Circular Dichroism (CD) Spectrum Analysis Service
In recent years, with the progress in the field of drug discovery, circular dichroism (CD) has become one of the core technologies for protein and peptide drug development and research. Circular dichrographic scanning analysis of proteins and peptides is of great significance for studying their secondary and advanced structures. Circular dichroism is a special absorption spectrum, which obtains the secondary structure of biological macromolecules by measuring the circular dichroism spectrum of proteins and other biological macromolecules. With its advantages of being simple and quick, circular dichroism (CD) analysis technology is widely applied in fields such as protein folding, protein conformation studies, and enzyme kinetics.
MtoZ Biolabs offers comprehensive circular dichroism (CD) analysis services, collecting samples' CD spectra in the far-ultraviolet range (190-260 nm), and analyzing their secondary structures using CDNN software.
The CD spectrometer utilizes the circular dichroism properties of proteins and the differential absorption of left and right circularly polarized light by asymmetric molecules to analyze structures. In proteins or peptides, the main active groups include peptide bonds, aromatic amino acid residues, and disulfide bonds, etc. When plane-polarized light is absorbed differently, an absorption difference occurs. Due to the presence of this absorption difference, there is a difference in the amplitude of the polarized light vectors, causing the circularly polarized light to become elliptically polarized light, which is referred to as the circular dichroism of proteins. By using circular dichroism scanners, secondary and advanced structures of protein and peptide samples can be analyzed to a certain extent.
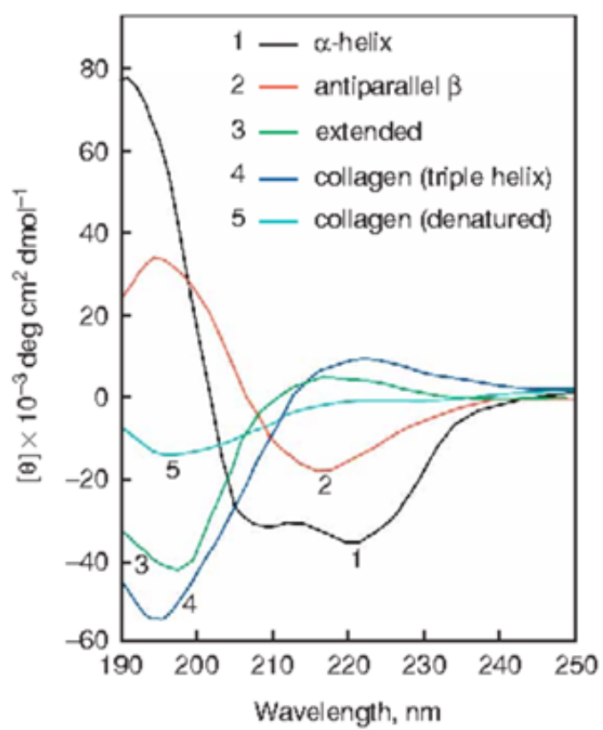
Figure 1. Circular Dichroism Spectrum Showing the Representative Secondary Conformations of Peptides and Proteins
Analysis Workflow
1. Dilute the sample with the blank control solution to 0.01μg/μL.
2. Set the far-ultraviolet detection parameters:
(1) Start wavelength (Begin) 190 nm.
(2) End wavelength (End) 260 nm.
(3) Scanning speed 50 nm/min.
(4) Response 4 sec.
(5) Band width 1 nm.
(6) Accumu Lation 3 times.
(7) Cuvette width 1 cm.
Service Advantages
1. High Resolution and Sensitivity
Modern circular dichroism spectrometers have high resolution and sensitivity, allowing for accurate measurement of samples' absorption and rotation of circularly polarized light. This enables circular dichroism analysis to provide accurate results and reliable data, which is of great significance for studying the structure and properties of substances.
2. Fast and High-Throughput Analysis
Modern circular dichroism spectrometers feature fast analysis speeds and high-throughput capabilities, allowing for the simultaneous processing of multiple samples, thus enhancing analysis efficiency.
3. Circular Dichroism Analysis Requires Minimal Amounts of Sample and can be Conducted in Dilute Solutions
Sample Results
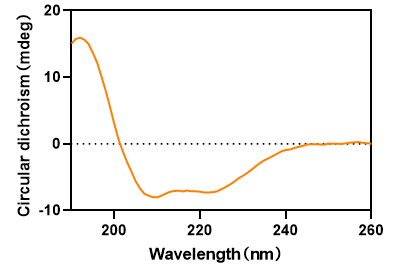
Figure 2. Far-Ultraviolet (190-260nm) Scan of the Sample
The horizontal axis represents the scanning wavelength and the vertical axis represents ellipticity.
Sample Submission Requirements
1. Protein sample concentration > 0.5 mg/mL, purity > 90%, solid protein quality should not be less than 200ug.
2. Circular dichroism analysis is applicable to sample types such as pure protein solutions, peptides, membrane proteins, and assembled protein complexes.
Services at MtoZ Biolabs
1. Sample Testing and Analysis
Experimenters will use a circular dichroism spectrometer to measure the sample, recording the absorption and rotation of circularly polarized light by the sample and generating a circular dichroism curve. Then, by interpreting and analyzing the circular dichroism curve, information about the sample's secondary structure and structural characteristics will be obtained.
2. Results Interpretation and Reporting
According to circular dichroism curve data, technicians will analyze the secondary structure of samples and generate a detailed test report.
Applications
1. Protein Structure Exploration
Employing circular dichroism facilitates the examination of proteins' secondary architectures,including α-helices, β-sheets, etc. It is pivotal for understanding the folding state, stability, and functional activity of proteins.
2. Drug Discovery
Circular dichroism can be used to assess the impact of drug-protein interactions, including drug binding, inhibition or activation of the role of proteins.
FAQ
Q1: What software is employed for analyzing proteins' secondary structures, and what are the advantages?
Currently, there are several softwares available for deconvolution and estimation, and the calculated proportion of protein secondary structure is not exactly the same due to the different theoretical basis of different calculation modes. The CDNN software, a secondary structure calculation tool based on deep neural network technology, can predict the secondary structure composition of proteins by analyzing their amino acid sequences. This software offers highly accurate and fast computational results, making it widely applicable in fields such as protein structure analysis and protein engineering. It is recognized for its speed and cost-effectiveness and has been validated and applied in numerous biomedical applications, including drug design and protein structure prediction.
How to order?

