


CD Spectra Analysis Service
CD spectra analysis is a spectroscopic technique based on circularly polarized light to detect secondary structural characteristics of molecules, also known as circular dichroism spectroscopy. By examining changes in polarization when light interacts with matter—particularly the differences between left and right circularly polarized light—molecular structural information can be obtained. CD spectra analysis service is especially effective in analyzing the structures of biomacromolecules such as proteins and nucleic acids. MtoZ Biolabs provides CD spectra analysis service to study the secondary structures of protein and peptide based bioproducts. Our instrument is equipped with temperature control and titration modules, which allows further investigation into how factors such as temperature, pH, and ionic strength affect protein folding states and stability.
Miles A J. et al. Chem. Soc. Rev., 2016.
Analysis Workflow
1. Sample Preparation
Purification and Concentration Determination: Use methods such as SDS-PAGE, electrophoresis, or HPLC to ensure high sample purity. Determine the concentration using a spectrophotometer (typically in the 10–100 μM range).
Solvent and Buffer Selection: Choose suitable solvents and buffers that do not interfere with the measurement. Adjust pH to a range where the target molecule remains structurally stable, and avoid high salt concentrations that may affect spectral quality.
2. Instrument Calibration
Baseline Correction: Use a blank solvent for baseline correction to eliminate background signals from both the solvent and the instrument.
Wavelength Calibration: Verify and adjust the instrument’s wavelength accuracy to ensure reliable spectral data.
3. Spectral Measurement
Pathlength Setting: Select an appropriate pathlength based on sample concentration (usually 0.1–1 cm) to optimize the signal-to-noise ratio.
Scanning Parameters: Set the scanning range (commonly 190–250 nm), scan speed, and number of averages to obtain high-quality CD spectra.
4. Data Processing
Spectral Preprocessing: Apply denoising, smoothing, and baseline correction to improve the signal-to-noise ratio and resolution.
Secondary Structure Analysis: Use specialized software to quantify secondary structure components, such as the proportions of α-helix, β-sheet, and random coil.
5. Results Analysis and Reporting
Spectral Interpretation: Analyze the location and intensity of characteristic peaks to assess the molecule’s secondary structure and its conformational changes.
Report Generation: Prepare a detailed analysis report that includes spectral graphs and structural analysis results.
Why Choose MtoZ Biolabs?
1. Advanced Analysis Platform: MtoZ Biolabs established an advanced CD spectra analysis service platform, guaranteeing reliable, fast, and highly accurate analysis service.
2. One-Time-Charge: Our pricing is transparent, no hidden fees or additional costs.
3. High-Data-Quality: Deep data coverage with strict data quality control. AI-powered bioinformatics platform integrates all CD spectra analysis data, providing clients with a comprehensive data report.
Sample Submission Suggestions
Sample Types
We accept various types of samples, including but not limited to purified protein samples in solution, as well as polypeptides and small-molecule compounds with chiral structures.
Sample Quantity
Concentration Requirements: A sample concentration of 10–100 μM is typically required. The exact concentration should be adjusted based on the molecular weight and extinction coefficient to ensure moderate signal intensity without spectral saturation.
Volume Requirements: Each sample must be provided in sufficient volume for multiple scans and repeat experiments, typically around 100–200 μL per sample.
Applications
1. Protein Secondary Structure Analysis
Quantitatively measure the proportions of α-helix, β-sheet, and random coil structures in proteins. CD spectra analysis plays a critical role in understanding the structural characteristics and functional mechanisms of proteins.
2. Protein Folding and Stability Studies
CD spectra analysis enables real-time monitoring of protein folding and unfolding processes, evaluating their stability under various environmental conditions, such as temperature, pH, and ionic strength. This is essential for studying protein dynamics and stability mechanisms.
3. Protein-Ligand Interactions
By analyzing changes in CD spectra before and after ligand binding, the impact of ligand binding on protein conformation can be revealed. This provides valuable insights into the interaction mechanisms between ligands and proteins.
4. Drug Development and Quality Control
In pharmaceutical research, CD spectra analysis can determine the binding mechanisms and binding sites of drug molecules to proteins or nucleic acids. It is also used to evaluate the conformational integrity and stability of biopharmaceuticals, monitor structural changes during storage and transportation.
5. Peptide and Small Molecule Structural Characterization
Analyze the conformational properties of chiral small molecules and peptides, offering guidance for drug molecule design.
FAQ
Q: How can noise and background signals be effectively removed from CD spectra?
In CD spectral analysis, noise and background signals are the primary factors that affect data quality, especially when dealing with low-concentration samples or weak signals. These interferences can come from the sample, solvent, the instrument itself, and various factors in the experimental process.
1. Sources of Noise and Background Signals
Selecting an Appropriate Solvent: Certain solvents (e.g., alcohols or components in buffer solutions) may exhibit strong intrinsic absorption signals in the far-UV region (190–250 nm).
Choosing an Appropriate Sample Concentration: Based on the protein’s molecular weight and absorption coefficient, ensure the sample concentration falls within the optimal detection range of the CD instrument. Signals from low-concentration samples are weaker and more easily overshadowed by background noise.
2. Data Acquisition Optimization
Baseline Correction: Use the same buffer as the sample for baseline correction to eliminate background signals from the solvent and the cuvette.
Increasing Scan Repetitions: Perform multiple scans and average the data to effectively reduce random noise.
Reducing Scan Speed: Appropriately lowering the scan speed helps improve signal stability and resolution.
3. Data Processing and Analysis
Smoothing: Apply mathematical smoothing algorithms (such as the Savitzky-Golay method) during post-processing to remove high-frequency noise, while avoiding excessive smoothing that may distort the signal.
Background Subtraction: Use software tools to subtract solvent and background signals from the sample spectrum.
Reproducibility Verification: Ensure that repeated measurements under the same experimental conditions yield consistent spectral results.
4. Instrument Maintenance and Calibration
Calibrate the CD spectrometer regularly to maintain the stability of the light source, detector, and scanning system.
Check the quality of the cupola to ensure that the light path length is accurate and free of scratches or contamination.
Effectively removing noise and background signals requires a combination of pre-experimental optimization, data acquisition optimization, and subsequent data processing. By preparing high-purity samples, performing strict baseline corrections, averaging multiple scans, and applying smoothing algorithms, the signal-to-noise ratio and data quality of CD spectra can be significantly improved, providing a reliable basis for subsequent protein secondary structure analysis.
Case Study
CD spectral analysis showed that the antimicrobial peptide TC-14 adopts a predominantly unstructured form in aqueous solution but formed an α-helical structure in a biomimetic membrane environment. This finding provides a foundation for further research into the relationship between the structure and function of TC-14.
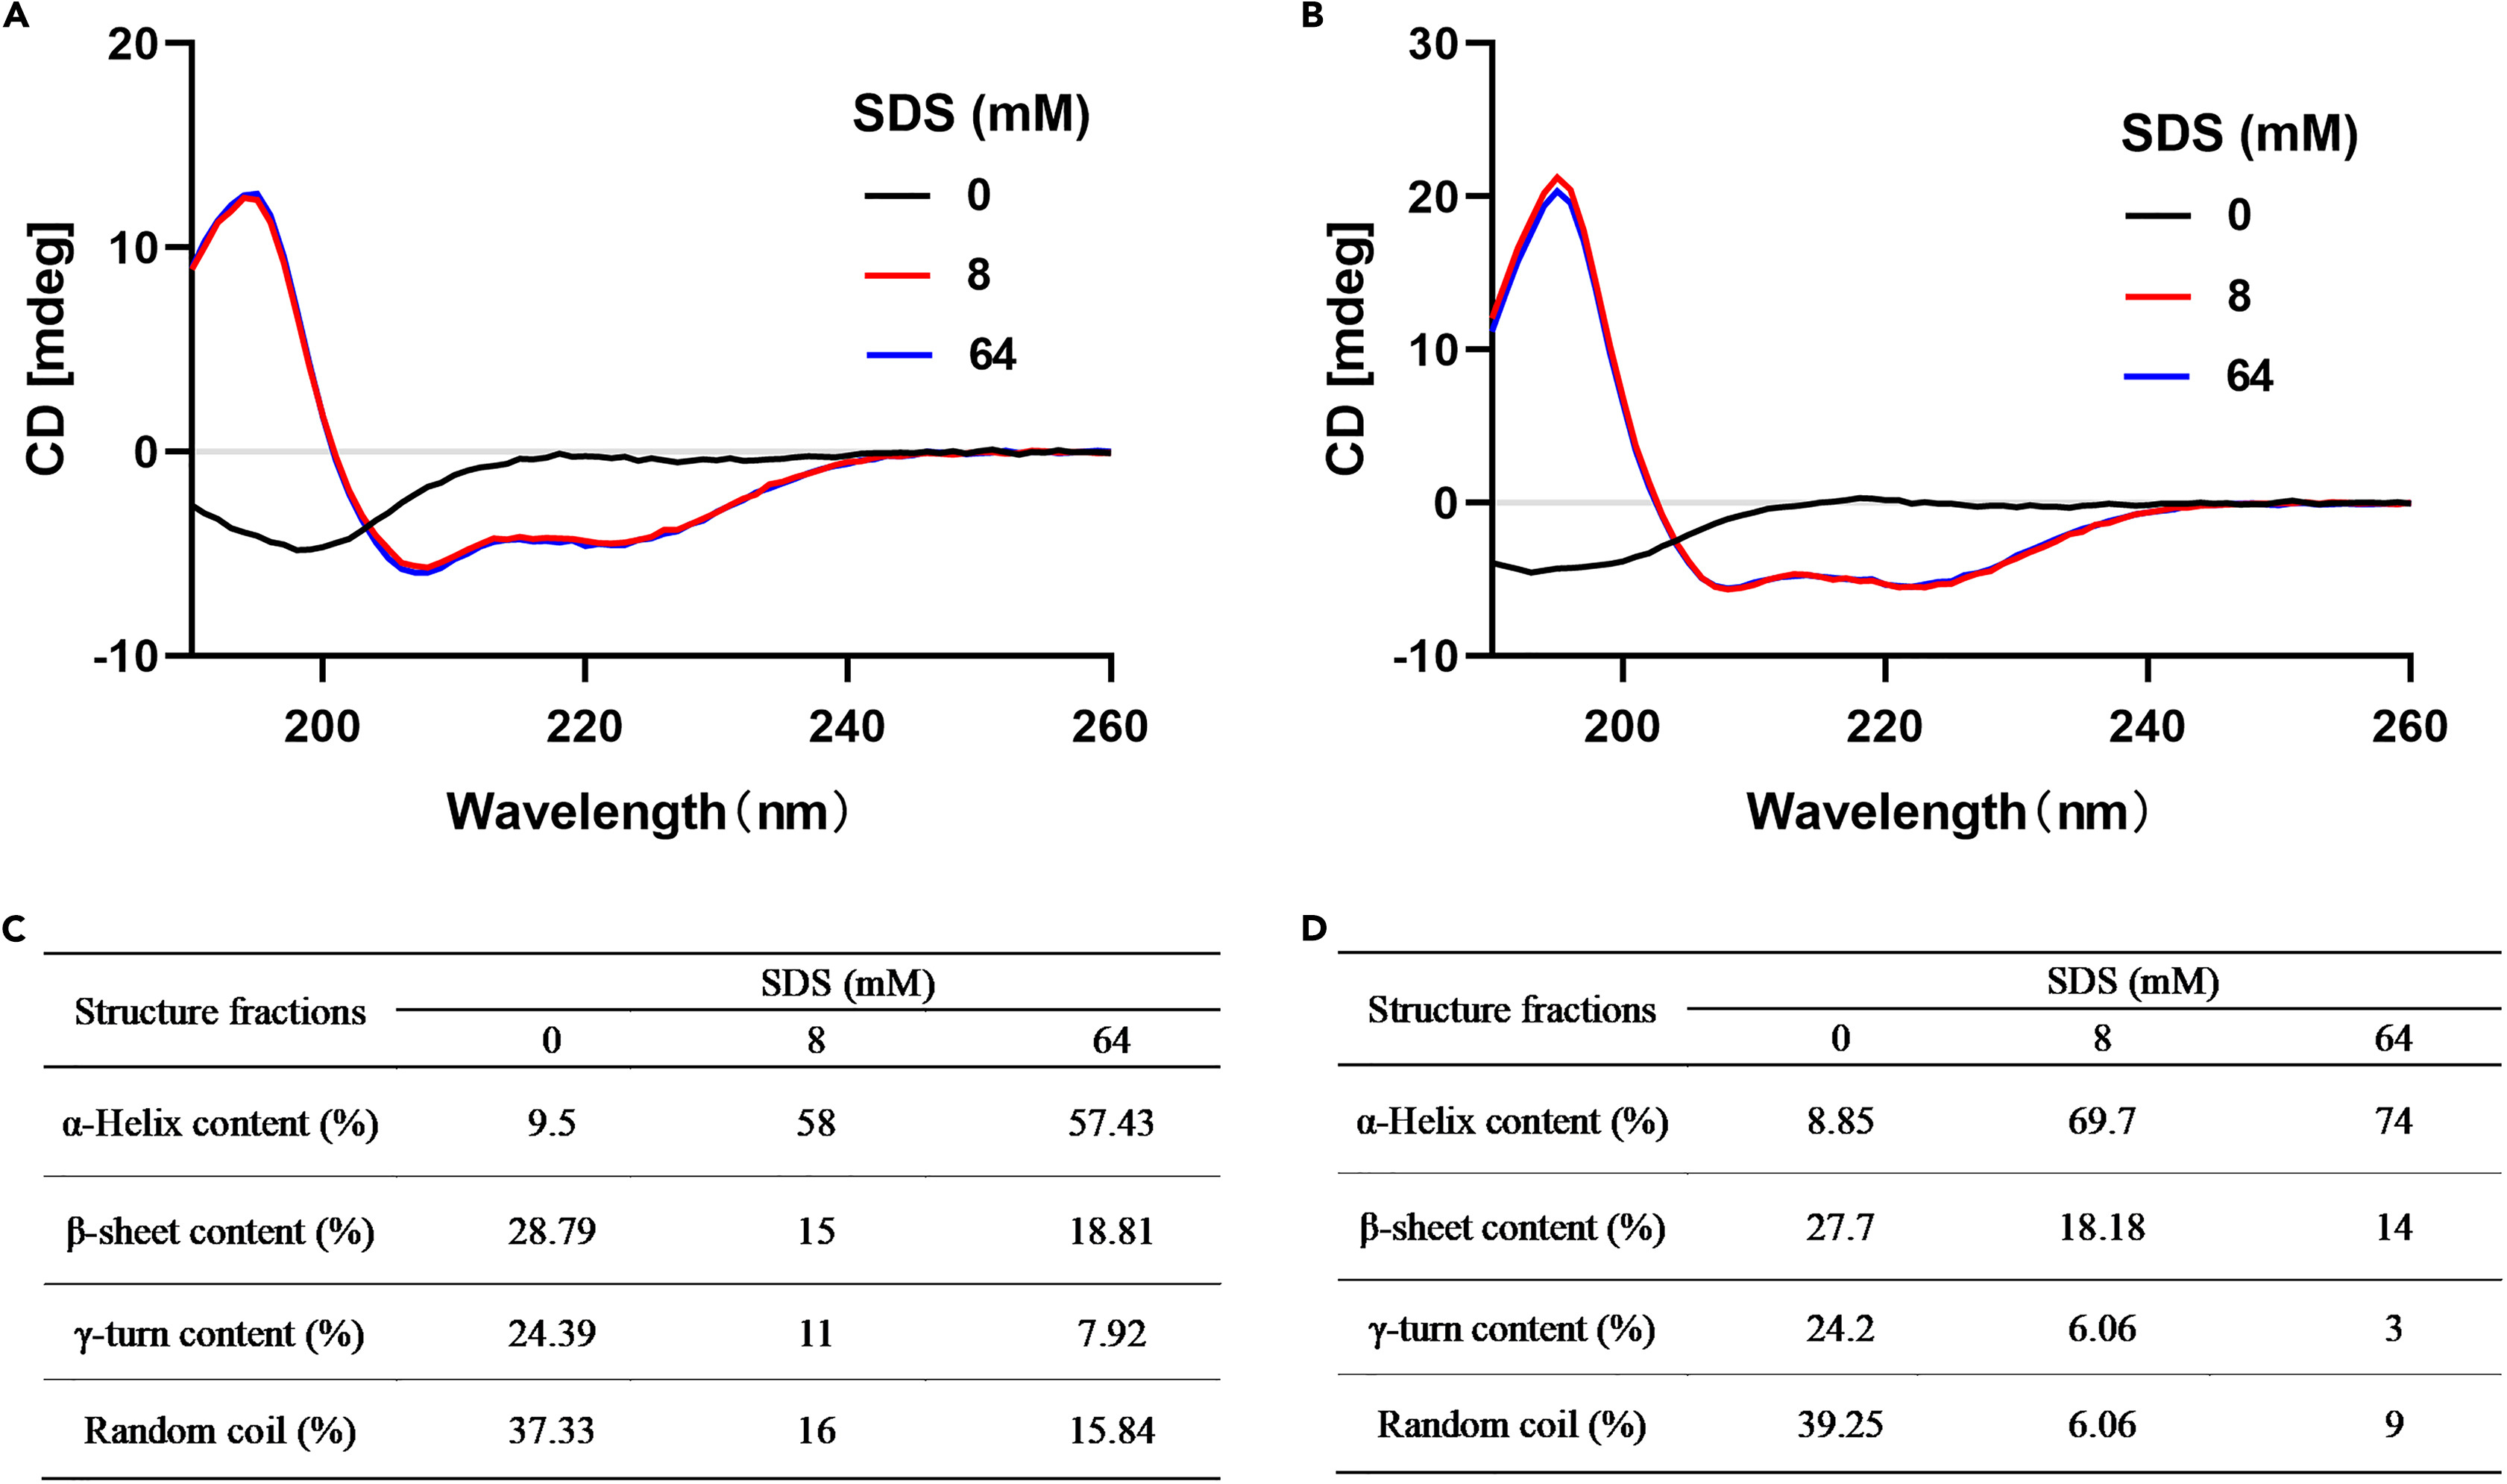
Li Chenxi , et al. iScience. 2024.
MtoZ Biolabs, an integrated Chromatography and Mass Spectrometry (MS) Services Provider, provides advanced proteomics, metabolomics, and biopharmaceutical analysis services to researchers in biochemistry, biotechnology, and biopharmaceutical fields. Our ultimate aim is to provide more rapid, high-throughput, and cost-effective analysis, with exceptional data quality and minimal sample consumption.
Free project evaluation, welcome to learn more details! Our technical specialists are available to provide a free business assessment.
MtoZ Biolabs, an integrated chromatography and mass spectrometry (MS) services provider.
Related Services
Protein Structure Identification Service
X-Ray Crystallography Protein Structure Determination Service
How to order?

