



AP-MS protein interaction analysis reports bait-centered co-enrichment after affinity capture and liquid chromatography–tandem mass spectrometry (LC-MS/MS). The interaction sentence it can support is that a protein was recovered with this bait under these wash and control conditions. That sentence is narrower than mapping an intracellular interaction network, defining a complex, or explaining a pathway.
Protein–protein contacts still sit under signaling, gene-expression control, and metabolism. Those processes are contexts in which a bait may be tested. They are not outputs of the spectrometer. AP-MS does not, by being named protein-interaction analysis, identify regulatory proteins, assemble complex composition, or read dynamic network change. For the technique definition behind that sentence, What Is the AP-MS Technique? provides a complementary definition page.
Researchers who already have a tagged bait and need a ranked co-enrichment table can also review the MtoZ Biolabs Affinity Purification-Mass Spectrometry Service for project-specific feasibility and analysis planning.
What Interaction Means in an AP-MS File
The original three-stage description remains useful if each stage is read as an evidence step. Affinity purification concentrates the bait and whatever survived the kinetic filter. Mass spectrometry names peptides in that eluate. Interpretation ranks those names against a matched control and can attach a public annotation. Ranking and annotation do not validate a contact and do not construct a comprehensive interaction network.
A name in the bait eluate is identification. Enrichment against empty-tag, bead-only, or a matched non-bait arm is a stronger, still provisional, candidate. Direct binding is a later assay. For that evidence split after the file exists, Understanding AP-MS: A Comprehensive Guide provides a complementary evidence page.
Tag-based capture is the common AP-MS format on this site. Antibody capture of an endogenous bait is usually planned as IP-MS. Immobilized recombinant bait is pull-down MS. Those three formats do not share a control, and none of them grants “high specificity and efficiency” by the handle name. An overexpressed tag can recover names that do not follow the endogenous protein. That is still an AP-MS protein-interaction file. It is a different biological object.
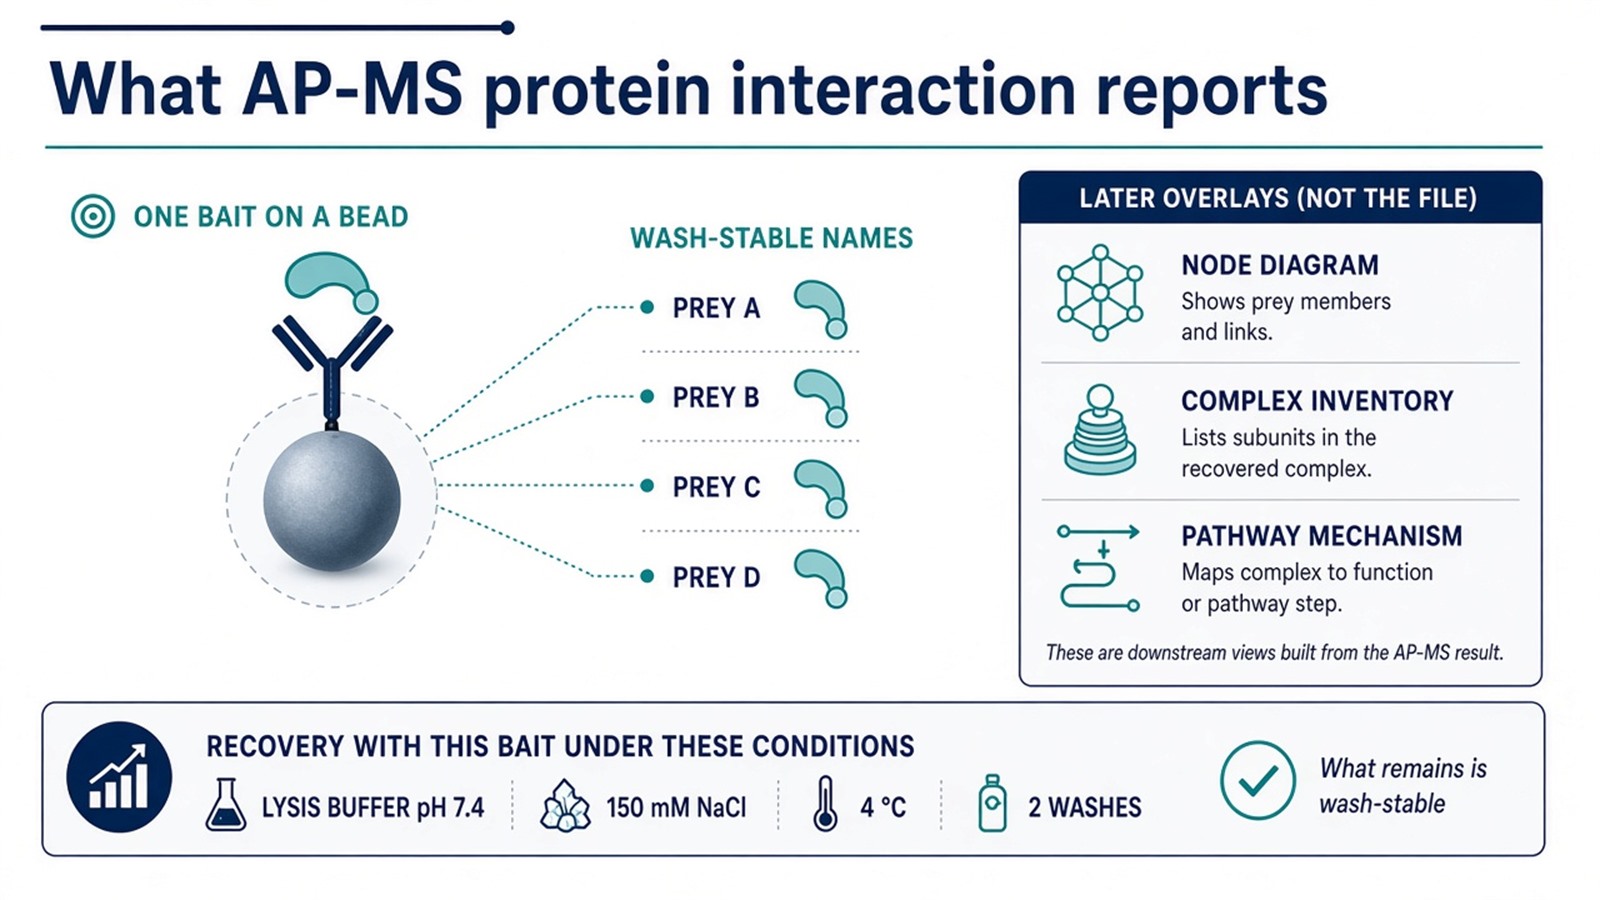
Figure 1. The file is bait-centered co-enrichment. A node diagram, a complex inventory, and a pathway mechanism are later overlays.
Write the interaction sentence as recovery with this bait under these conditions. Do not write it as a network, a complex, or a disease mechanism.
Three Stages, Recast as Evidence Steps
Affinity purification still comes first. The handle decides which protein entered the tube. The wash decides which associations remain. A missing partner can be wash-off, low bait occupancy, or insufficient depth. It is not true absence. For the capture–wash–elute chain, How AP-MS Works provides a complementary mechanism page.
Mass spectrometry still names the eluate. Database search returns accessions. Accessions are not interactors. Quantification, when designed, is a contrast: bait versus control, or condition A versus condition B under matched capture. It is not a proof that the contact changed in the cell.
Interpretation still matters, and it is where the original page overclaimed. Functional annotation can group candidates for review. It does not confirm a regulatory role. Graph layout can make a long table inspectable. It does not convert co-enrichment into a structured interaction model. For the drawing that can follow this table, Affinity Purification Mass Spectrometry and Network Analysis to Understand Protein-Protein Interactions provides a complementary network page.
The original applications remain allowable as study settings. A signaling-pathway project can ask which names follow this bait after a written stimulus. A physiological-versus-pathological comparison can ask which names change rank when capture chemistry is matched. Neither setting identifies a biomarker, names a key signaling protein as a class, or advances a therapeutic strategy by itself. Pathway insight is a later sentence that still needs an orthogonal assay.
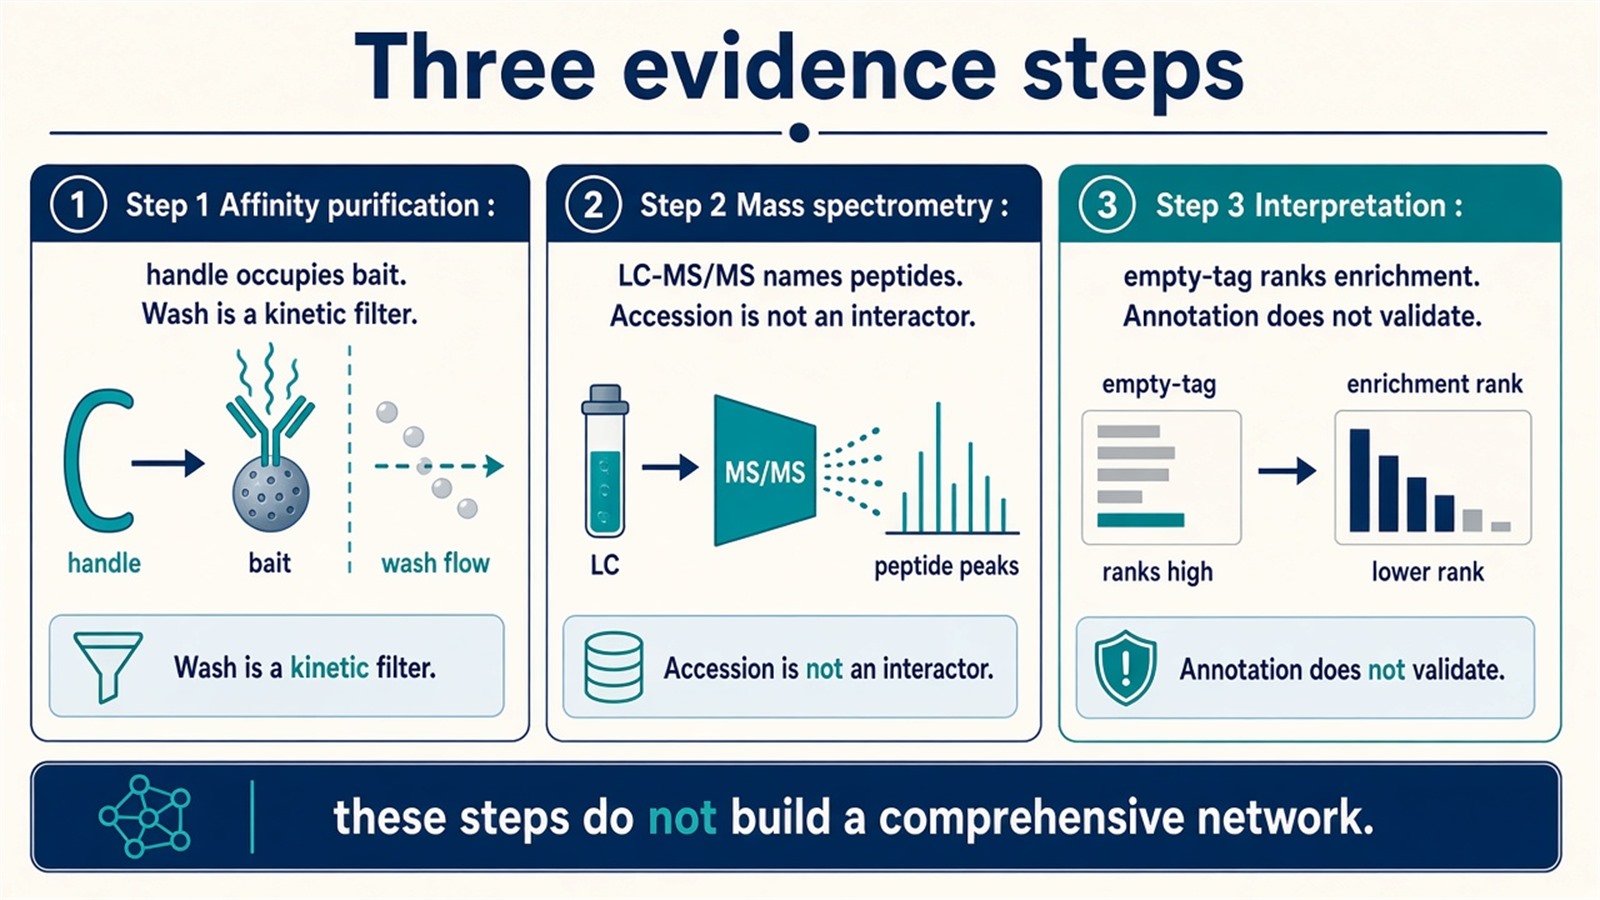
Figure 2. Stage 1 concentrates what survived the wash. Stage 2 names peptides. Stage 3 ranks bait-enriched names. Annotation does not validate the contact.
Quantitative Overlay Is Contrast, Not Dynamics
Stable-isotope or reporter-label designs can make the bait-to-control or condition-to-condition contrast more explicit. They do not grant precise quantification of interacting proteins, and they do not capture dynamic interaction-network change. A ratio is a file contrast under the purification used.
Multi-omics integration can sit beside the table later. It does not dissect regulatory mechanisms inside the AP-MS file. Computational overlay of a pathway term is a label on a candidate, not a mechanism measurement.
If the needed interaction sentence is live-cell neighborhood rather than wash-stable recovery, AP-MS is the wrong first table. For that split, AP-MS vs BioID and TurboID How Should You Choose? provides a complementary method-choice page.
Experimental Limits
AP-MS protein interaction analysis reduces a project to one bait, one handle, one wash, and one control class. Indirect co-recovery remains inside the table: a prey can ride a true partner and still look bait-specific after empty-tag filtering. Diagnostic network, complex-composition, biomarker, and therapeutic-development language sits outside ordinary research reporting unless a separately validated assay is already named. A clean gel does not replace that control, and a long identification list does not become an interactome by being labeled protein-interaction analysis.
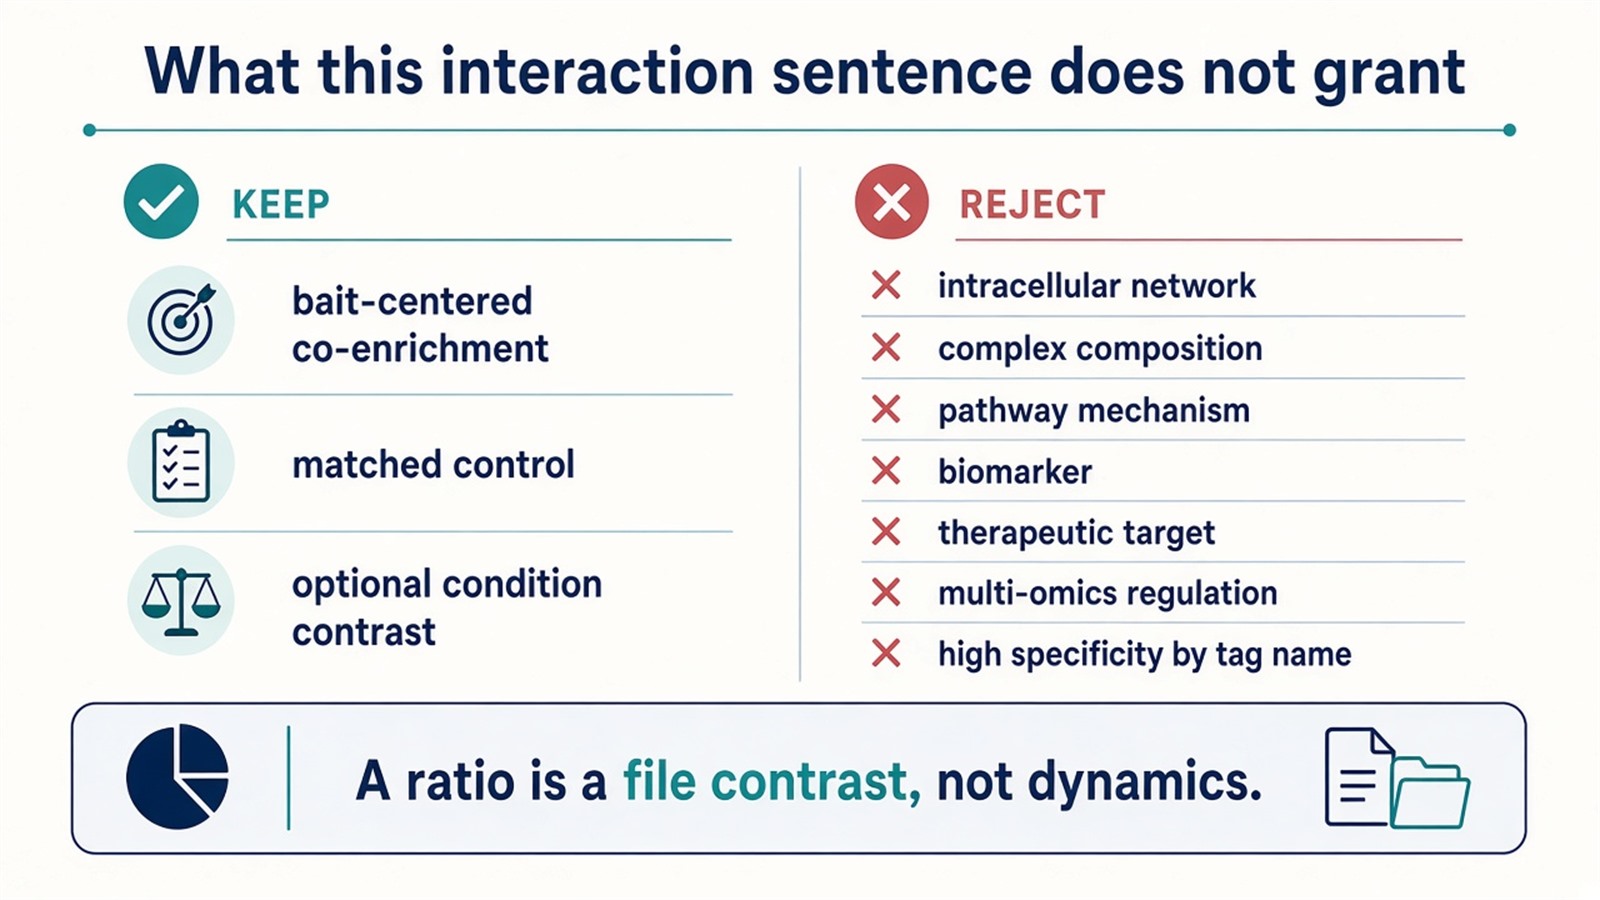
Figure 3. Keep: recovery with this bait under these conditions. Not granted: intracellular networks, complex composition, pathway mechanism, biomarkers, or multi-omics regulation.
Project Planning and Service Scope
A usable request names the bait format, the interaction sentence that will be allowed, the matched control, and the orthogonal assay that would be required for a binding or mechanism sentence. If only one predefined prey is in scope, a focused Co-IP is the shorter route and should not be written as AP-MS protein-interaction analysis. MtoZ Biolabs scopes tagged-bait AP-MS on Orbitrap-class LC-MS/MS. Interpretability still follows those arms, not a protein-interaction-network heading.
Once the next sentence is a named prey that only needs a yes-or-no recovery check, this page should hand off. Researchers who need that blot or targeted pellet can review the MtoZ Biolabs Co-IP MS Protein Interaction Analysis Service for project-specific sample evaluation, feasibility assessment, and workflow planning.
Frequently Asked Questions
1. Does AP-MS map intracellular protein interaction networks?
No. It reports bait-centered co-enrichment. A graph is a drawing of that table.
2. Can AP-MS define protein-complex composition?
Not from one bait eluate. Shared recovery across related baits is a later analysis, still not a complete complex.
3. Does identification of a prey prove a protein interaction?
No. Identification is weaker than enrichment against a matched control. Enrichment is still weaker than a binding assay.
4. Is antibody capture part of AP-MS protein interaction analysis?
Literature uses both labels. On this site, tagged bait is the usual AP-MS format. Endogenous antibody capture is usually planned as IP-MS.
5. Does quantification validate the interaction?
No. A ratio ranks a contrast under the purification used. It does not confirm a contact or a regulatory role.
Reference
- Gingras A.C., Gstaiger M., Raught B., Aebersold R. (2007). Analysis of protein complexes using mass spectrometry. Nat. Rev. Mol. Cell Biol., 8, 645-654. https://doi.org/10.1038/nrm2208
- Dunham W.H., Mullin M., Gingras A.C. (2012). Affinity-purification coupled to mass spectrometry: basic principles and strategies. Proteomics, 12, 1576-1590. https://doi.org/10.1002/pmic.201100523
- Mellacheruvu D., Wright Z., Couzens A.L., et al. (2013). The CRAPome: a contaminant repository for affinity purification-mass spectrometry data. Nat. Methods, 10, 730-736. https://doi.org/10.1038/nmeth.2557
- Choi H., Larsen B., Lin Z.Y., et al. (2011). SAINT: probabilistic scoring of affinity purification-mass spectrometry data. Nat. Methods, 8, 70-73. https://doi.org/10.1038/nmeth.1541
- Gavin A.C., Bösche M., Krause R., et al. (2002). Functional organization of the yeast proteome by systematic analysis of protein complexes. Nature, 415, 141-147. https://doi.org/10.1038/415141a
