



Challenges in Blood Proteomics Analysis
Blood proteomics studies can produce different protein identification depths, low-abundance protein coverage, and relative quantitative profiles across samples. A lower identification count, an inconsistent protein signal, or an unexpected group difference may arise from several distinct sources. Protein abundance range affects detectability, sample abnormalities change the measured protein background, storage and degradation influence protein stability, and biological or technical variation affects between-sample comparability. Understanding these factors helps researchers assess whether an observed protein pattern is consistent with biological variation, sample condition, or analytical variation.
Protein Abundance and Detection Challenges
Protein abundance in plasma and serum spans a wide range, so measured signals are not contributed equally by all proteins. Differences in signal strength and detectability between abundant and low-abundance proteins shape overall protein coverage and the comparability of identification results across samples.
1. Wide Dynamic Range of Blood Proteins
Highly abundant proteins contribute strong peptide signals and form a large part of the measured protein background. Proteins present at lower concentrations produce weaker signals and may be less consistently detected. The wide dynamic range therefore limits the coverage of low-abundance components in routine blood proteomics. Samples with different abundance distributions may yield different identification counts even under the same analytical workflow. Identification depth should be interpreted alongside sample type and condition rather than as a stand-alone measure of sample quality.
2. Challenges in Low-Abundance Protein Detection
Peptides from low-abundance proteins can be masked by stronger signals from abundant proteins. Detection also depends on peptide properties, protein recovery, and LC-MS/MS performance. A protein close to the detection limit may be identified in one sample but not another, even when present in both samples.
Routine serum and plasma proteomics at MtoZ Biolabs uses magnetic-bead pretreatment to improve low-abundance protein detection. The low-input serum/plasma workflow does not include low-abundance enrichment or electrophoresis QC, and generally provides lower identification depth and quantitative stability than the standard workflow.
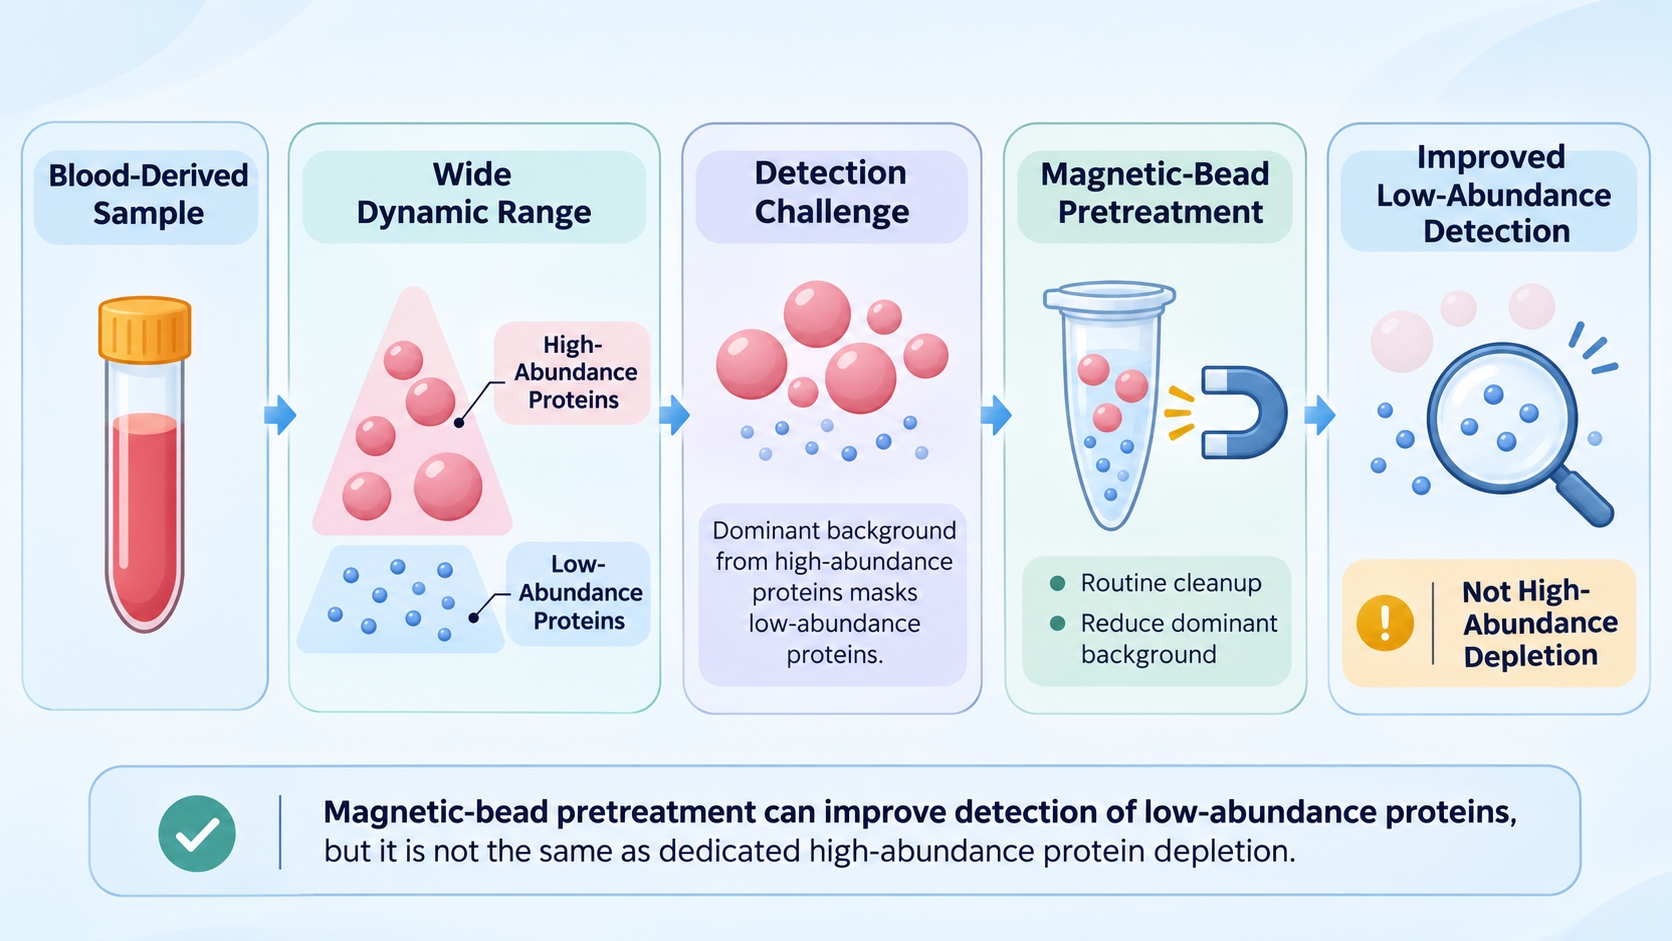
Figure 1. Protein abundance range and low-abundance protein detection challenges in blood proteomics.
Blood Sample Quality Issues Affecting Proteomics
Blood-derived samples can contain components introduced or altered during collection, separation, and handling. Hemolysis, anticoagulant choice, lipemia, icterus, clots, and residual blood cells can each change the measured protein background in a different way. These factors may affect protein detection and make comparisons across samples less straightforward.
1. Hemolysis and Hemoglobin Interference
Hemolysis releases hemoglobin and other erythrocyte proteins into serum or plasma. The added proteins change the measured profile and can make low-abundance proteins harder to detect. Unequal hemolysis across study groups can also complicate relative protein comparisons.
Lightly pink samples may be analyzed, with the sample condition noted in the report. Clearly red or dark-red samples are more likely to have substantial hemoglobin interference, and recollection is recommended. Magnetic-bead pretreatment may partly improve low-abundance protein detection, but it does not remove the hemoglobin-related signal.
2. Anticoagulants and Collection-Tube Effects
Anticoagulant choice is a preanalytical variable in plasma proteomics. EDTA tubes (purple top) are recommended because EDTA has minimal interference with downstream digestion and mass spectrometric analysis. Heparin and citrate anticoagulants are also acceptable.
For comparisons across groups, using the same anticoagulant and collection-tube type helps limit collection-related variation. Differences in tube type that coincide with study groups can complicate interpretation of group-level protein changes.
3. Lipemia, Icterus, Clots, and Cellular Carryover
Each sample abnormality has a different impact on protein analysis. The main considerations are summarized below:
- Lipemia: Mild turbidity can be accepted and may be improved by centrifugation or clarification. Marked milky turbidity or a thick lipid layer can reduce protein detection and between-sample comparability; recollection is recommended where possible.
- Icterus: Mild yellow coloration is generally acceptable. Deep-yellow or yellow-brown samples should be recollected where possible; otherwise, the potential impact should be considered when interpreting the results.
- Clots and residual fibrin: Limited fibrin residue can usually be removed by centrifugation. Obvious clots may require repeat centrifugation to recover the supernatant or recollection.
- Platelet carryover: Residual platelets add cellular proteins to plasma or serum and can alter the measured protein profile. A second centrifugation can help reduce platelet contamination.
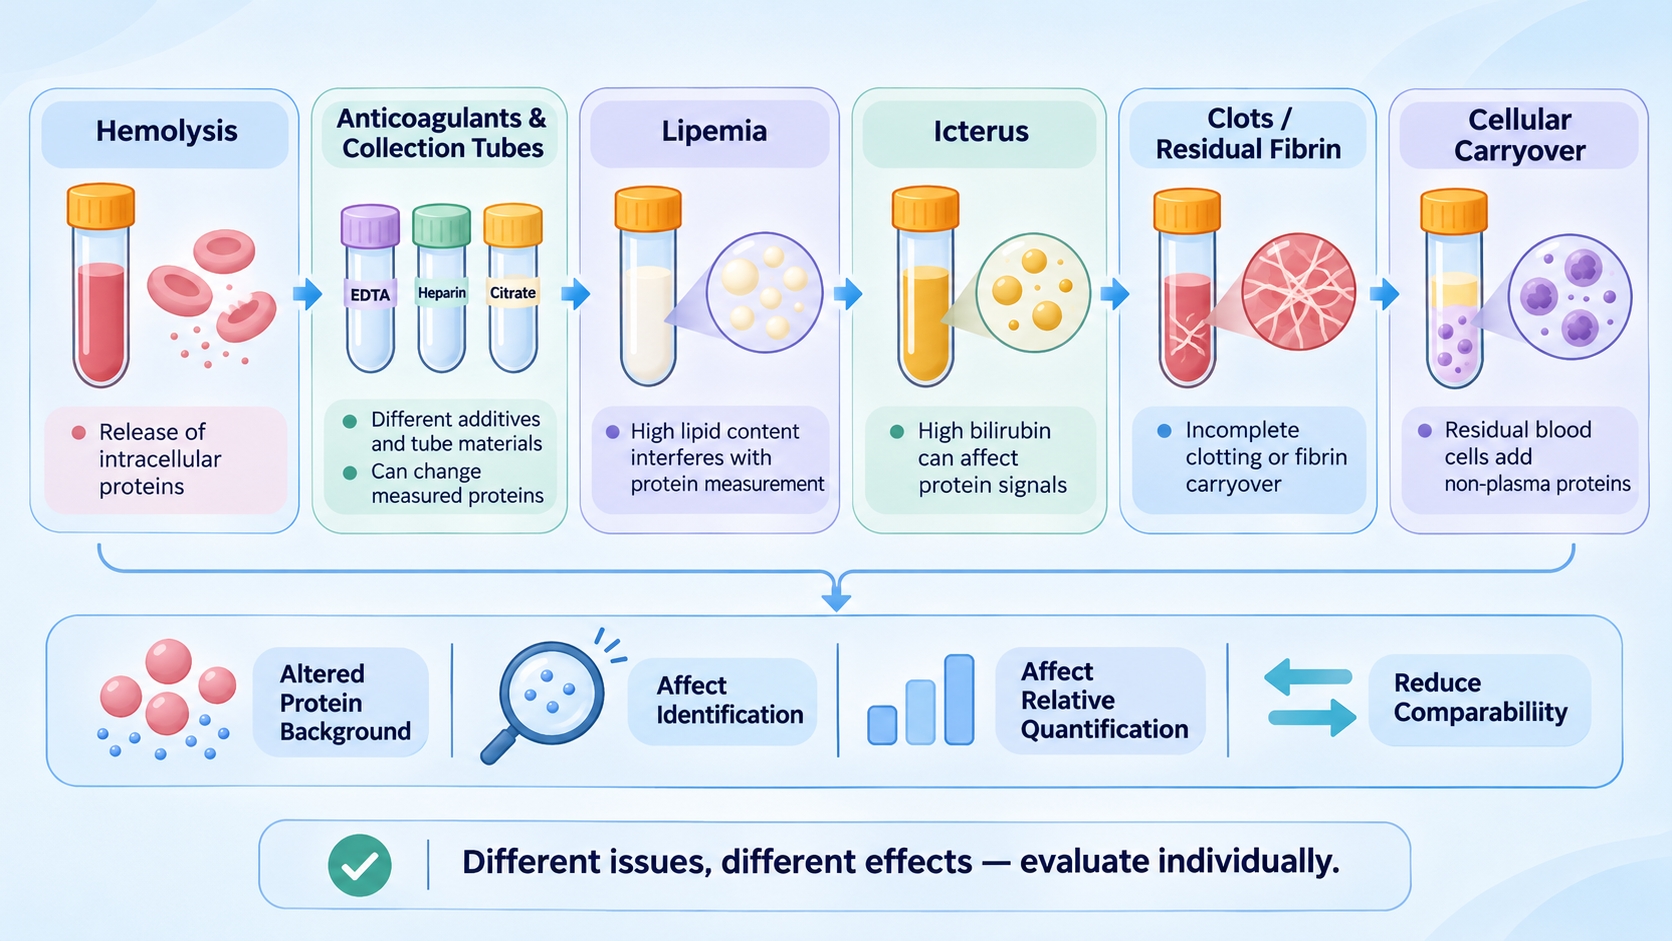
Figure 2. Sample-quality and preanalytical factors that can affect protein identification, relative quantification, and comparability in blood proteomics.
Sample Handling, Storage, and Protein Degradation
The interval between collection and LC-MS/MS analysis is also important for preserving the protein profile. Storage duration, freeze-thaw history, and processing delays can affect protein integrity and the peptide composition available for measurement. When handling histories differ among study groups, sample-related changes may add variation to the data.
1. Storage Conditions and Freeze-Thaw History
Repeated freeze-thaw cycles can affect protein stability and add variation to the measured profile. Different storage durations or thawing histories across groups can therefore complicate comparisons. Record the storage and freeze-thaw history when reviewing the dataset. Detailed collection and storage instructions are covered in Blood Proteomics Sample Collection, Processing, and Storage.
2. Processing Delays and Protein Degradation
Delays before processing and unsuitable storage conditions may allow protein degradation. Degradation reduces the amount of intact protein available for digestion and changes the peptide profile entering LC-MS/MS. In the resulting dataset, degradation may appear as reduced identification depth or shifts in relative quantitative signals.
Mildly degraded samples can still be processed, with the protein-quality pattern shown in the SDS-PAGE result. Severe degradation, often indicated by extensive low-molecular-weight smearing, warrants recollection where possible.
Biological and Technical Variation in Blood Proteomics
Between-sample variation can be biological or technical, and the two sources can overlap. Biological heterogeneity changes the actual protein composition of the sample, whereas technical variation changes how that composition is recovered or measured. QC helps determine whether unusual patterns are isolated, group-associated, or consistent with broader analytical variation.
1. Biological Variation and Blood Cell Composition
Biological variation reflects genuine differences among individuals or study conditions. Such variation can occur within the same group, even when samples are handled consistently.
For PBMC and other cell-pellet samples, cell composition can also affect the bulk protein profile. A shift in the relative proportions of cell populations may change the measured profile even when protein abundance within each population remains similar. PBMC samples contain multiple cell populations, and bulk proteomic data alone may not distinguish a change in cell composition from a change in protein abundance within a cell population.
2. Technical Variation and Batch Effects
Technical variation may arise from differences in protein recovery, digestion consistency, or LC-MS/MS acquisition. Such differences can alter peptide signals, identification depth, and relative quantitative values.
Batch effects may appear as systematic shifts in sample profiles or selected protein signals. When batch-related shifts align with study groups, technical variation can resemble a biological group difference. The design-stage approach to group allocation and batch balancing is discussed in How to Design Blood Proteomics Studies.
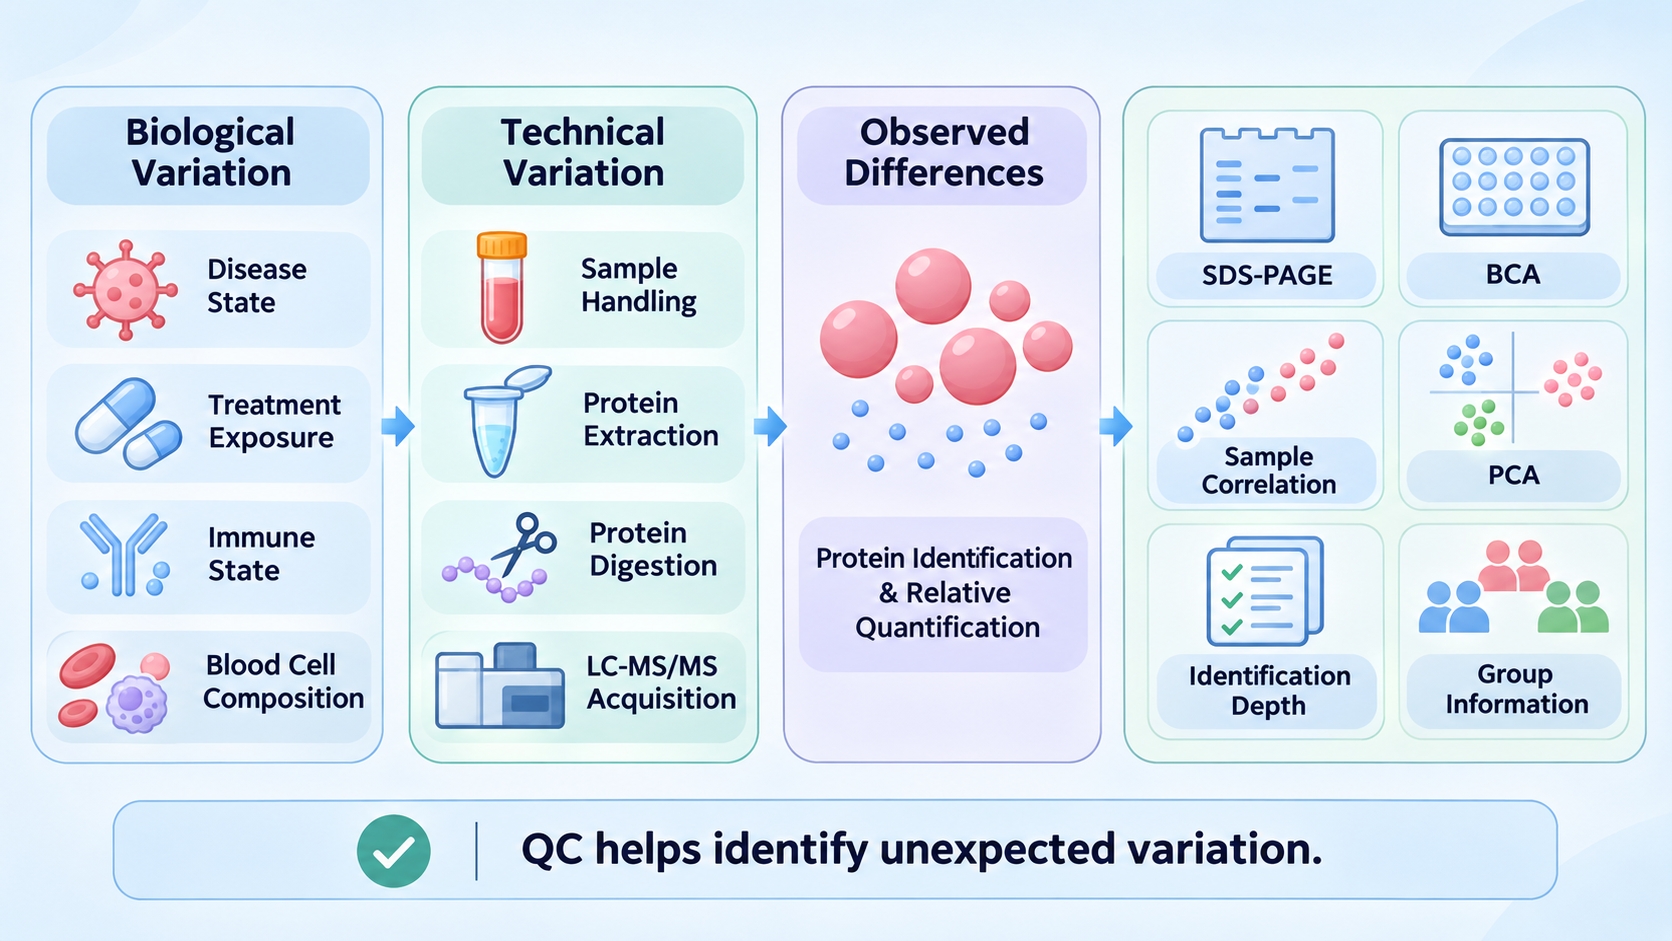
Figure 3. Biological and technical sources of variation and the QC evidence used to evaluate blood proteomics data.
3. Recognizing Variation Through Quality Control
QC interpretation brings together sample records, extracted-protein checks, and data-level patterns. Sample records describe pre-analytical conditions, protein-level checks describe the recovered material, and data-level patterns show how samples relate within the dataset.
- Sample records: Visible sample condition and storage or freeze-thaw history provide context for interpreting unexpected protein profiles.
- Extracted-protein QC: BCA and SDS-PAGE results provide complementary information about recovered protein amount and overall band pattern. These measurements describe the extracted protein preparation and should be interpreted separately from data-level patterns.
- Data-level QC: Sample correlation and PCA show broad relationships among quantitative profiles. Protein identification depth and quantitative distributions help identify samples or proteins that contribute to unusual patterns.
An unusual PCA position should be reviewed alongside sample records, extracted-protein QC, and acquisition-batch information. For details on the laboratory steps that generate protein identification and quantitative results, see Blood Proteomics Workflow from Protein Extraction to LC-MS/MS Analysis.
Frequently Asked Questions
1. Can sample correlation replace differential protein analysis?
No. Sample correlation summarizes the overall similarity between protein profiles, whereas differential protein analysis tests abundance changes for individual proteins between defined groups. A dataset may show high overall sample similarity while a smaller set of proteins differs between groups. The two analyses therefore answer different questions and are interpreted together.
2. Why can samples show high pairwise correlation but still separate in PCA?
Pairwise correlation summarizes the overall similarity between two quantitative profiles. PCA evaluates the major sources of variation across the full dataset and can highlight coordinated shifts across many proteins. Samples may therefore retain high pairwise correlation while separating along a principal component because of consistent differences across a subset or broad group of proteins.
3. Should missing quantitative values be replaced with zero before analysis?
Not automatically. A missing value may reflect a signal below the detection range, inconsistent peptide detection, or a data-processing filter. Replacing every missing value with zero can distort abundance distributions and downstream statistical comparisons. The handling method should be selected according to the acquisition strategy, the pattern of missingness, and the purpose of the analysis.
4. Can pathway analysis reveal coordinated changes when few individual proteins are significant?
Yes. Several proteins in the same biological pathway may show modest changes in a coordinated direction, even when only a small number pass an individual-protein significance threshold. Pathway analysis can help identify these coordinated patterns, but the result depends on the protein list, statistical method, and background set used. Findings should be interpreted alongside the underlying protein changes and the biological question.
Conclusion
Blood proteomics variability is easier to interpret when detection limits, sample-quality effects, preanalytical changes, and biological or technical variation are considered separately. The practical goal is to identify which factors can plausibly alter protein detection or relative quantification and whether those factors are distributed unevenly across the samples being compared.
For a broader view of blood-derived sample types, workflows, and result interpretation, see Understanding Blood Proteomics and Its Applications in Research. For plasma-based projects, see Plasma Proteomics Service. For projects using serum samples, see Serum Proteomics Service. For studies involving a broader range of blood-derived samples, see Blood Proteomics Service. MtoZ Biolabs can discuss the sample type and research objective to identify a suitable project route.
